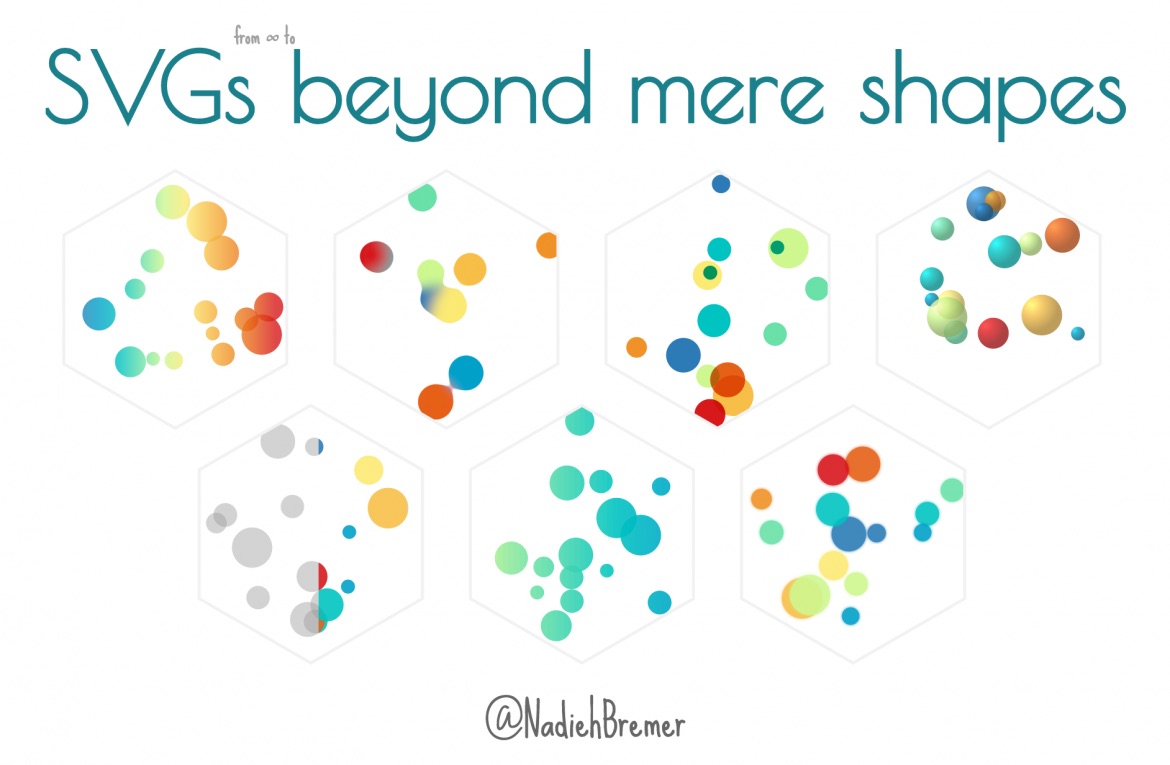
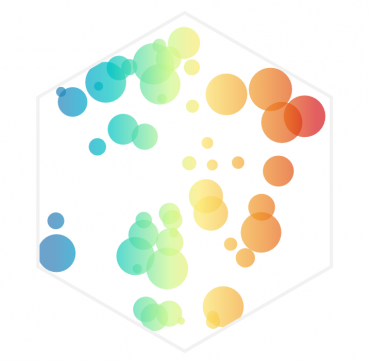
You’ve come to the blog that is the written companion to my talk called SVGs beyond mere shapes. SVG can do much more than create nice shapes and paths. In my talk I discuss several techniques and demonstrate how to implement them in D3: from dynamic gradients based on data, to SVG filters, to creating glow, gooey, and fuzzy effects that brighten up any visual.
My goal is to give people a whole bunch of effective or fun examples. But to also show them that, even if I focus on a subject as narrow as SVG gradient and filters, if you try to experiment and use things in an unconventional manner you can create some very interesting results. I hope I’ve managed to inspire the audience to show a dedication to the details, to go beyond the norm, so they have to make as few concessions to the computer as possible to recreate the image that they have in their mind.
I had 30-40 minutes to get people enthusiastic and show them the potential other uses for SVGs. But here on my blog, I’d like to take more time and go through each of these techniques in more detail. And of course, share the code for each of the examples that I showed.
Since this is too much to share in one blog I’ve posted a separate blog for each subject that came to pass in my talk. You’ll find them as separate blogs on my blog archive page (all in year 2016), but I’ve also created a link to each of them in the list below.
I hope you’ll enjoy the blogs!
The SVG beyond mere shapes blog series
The interactive slides | A bonus blog with the slides of the presentation, fully interactive and bouncing around. But there’s more, I also explain what tools and resources I used and show a bit of the sketching phase and screenshots of things that didn’t make the final cut.
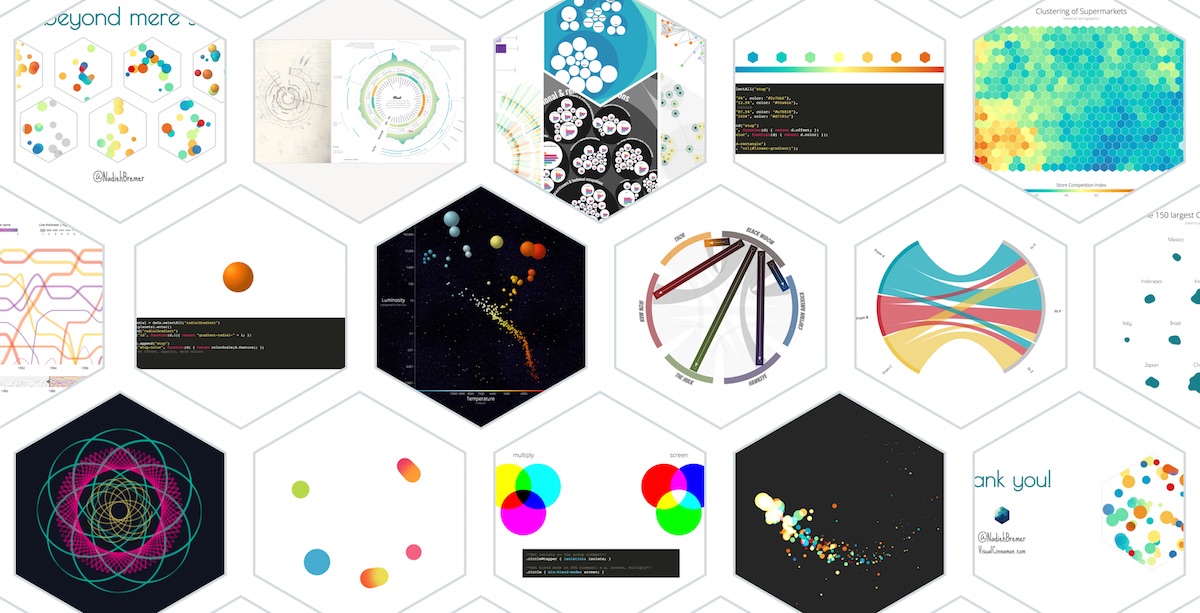
The video of the talk at OpenVis 2016 | If you’re interested to know more about what I said with each of the slides (they are rather word-empty) you can look at the video of the talk that Bocoup has made available. If you also want to be able to play around with a cool visualization/analysis that was made about all of the talks at OpenVis, check out the video section at OpenVisconf.com.
Linear SVG gradients | Both and introduction to linear gradients and showing how to create smooth color legends in a few simple steps. Example visualization that include this technique are: Self Organizing Maps, a more general heatmap of traffic accidents and Weather Radials.
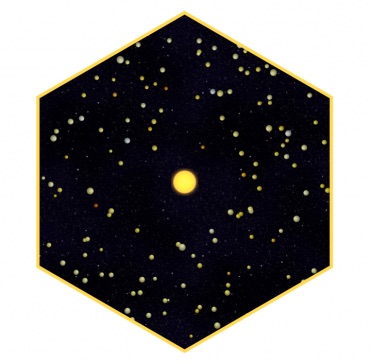
Data based & Radial SVG gradients | Explaining how a radial gradient is different from a linear one, but also showing how to use D3 in creating a unique gradient for each datapoint in your dataset. This was you can base the colors of the gradient on the data itself. I’ve taken a few Astronomy examples such as exoplanets and stars to build up the visualizations
Gradient orientations based on data | Besides making the colors of a gradient be based on data, you can also use the data to set the direction along which a gradient can run. In this blog, I’ll be using a Chord diagram showing collaborations of Avengers in the MCU to create a unique gradient the seems to run along each separate chord.

SVG Gradients for abrupt color changes | Gradients can be very useful to show abrupt color changes as well. Just think of thresholds or changes between categories. I’m using my Top 10 Baby Names project as an example where a gradient has been used in a non-conventional manner to create a more intuitive link between the section that is visible in both the focus and the context chart.
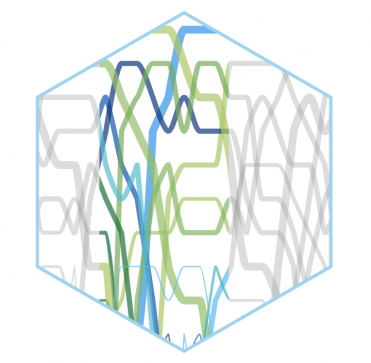
Animated SVG gradients | SVG gradients can easily be animated. Although you can animate (transition) almost any aspect of the gradient, for this blog I’ll show you the basics of creating an animation that will mimic a flow going from left to right. The data visualization example is the Stretched Chord diagram that came to pass in a previous blog. We’re picking up right where the previous blog ended and make those grey chords animated with a flow.

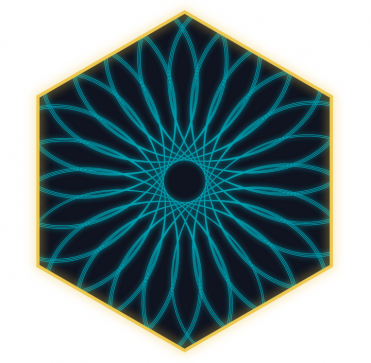
Glow filter | A subtle but nice filter, which is already being used in my radar chart redesign, but now I’ll show you how to create a glow around an SVG element in just a few lines of code.
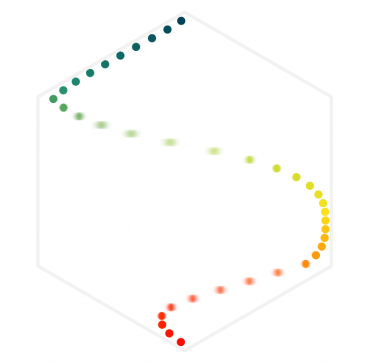
Real-life motion blur effects | The easiest filter to understand, creating the appearance of motion blur by making your SVG elements more fuzzy while moving across the screen. Plotting the top running speeds of several animals seemed like an appropriate example to apply this effect on.
Gooey filter | I’ve already posted a blog about a year ago on how to create this effect, but in this follow-up post I’ll show some other fun examples, such as maps and collision detection, and give a bit more insight into how to adjust the filter to your needs.

Color blending | Officially done with CSS alone, this effect has a really nice result when applied to SVGs. It is similar to the wonderful color blending settings of Photoshop where two colors that overlap each other might create a completely different color. Although no useful data visualization is used here, the example is actually my favorite one to watch in the entire series.
SVG gradient tutorial
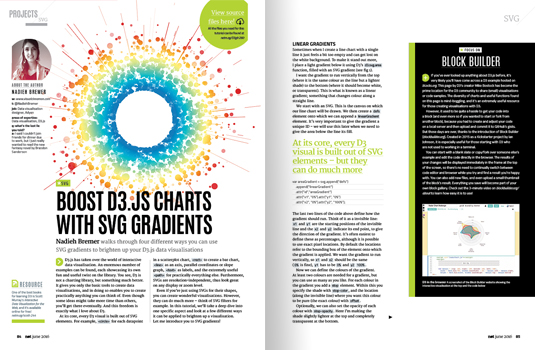
I’ve also written a 6-page tutorial for .net magazine on the usage of SVG filters in d3.js visualizations that came out on April 21st 2016 (but can now be found on the creative bloq site for free!). An introduction to gradients, smooth color gradients for legends, data-based (radial) gradients and orientation based gradients are all explained in there and you can find links to all of the material and examples used as well.