An Astronomer Passionate about Data Visualization & Data Art
Hi! My name is Nadieh Bremer, which is pronounced as Na-di (di as in ra-di-o), so forget about that eh at the end. Nice to see you here! Let me explain a bit more about myself and how I got to where I am now.
I’m a freelancing data visualization designer and artist, working from a lovely house in the woods, somewhere in the Netherlands, with a background in data science. In 2011 I graduated as an Astronomer from the University of Leiden. Looking for more tangible and dynamic work I left the world of academia and worked as an analytics consultant and data scientist at Deloitte for four years.
It took me a while to realize that, although I liked doing data analysis, I loved the visualization of the analysis and insights. In my evenings and weekends, I started teaching myself about the subject of data visualization and I also started creating personal projects. A year later in 2015, I got the opportunity to join Adyen as a full-time data visualization designer. There I worked on designing & building dashboards and other data visualizations for their client environment.
However, after a year I figured out that my passion lies with the more creative kind of data visualization, not dashboards. Therefore, I quit my job to become a freelancing data visualization designer to explore if there is a market for unique and captivating visualizations of data. If you’d like, you can read this blog for a more thorough story about my journey from Astronomy to Dataviz.
My projects include print and web-based (subtly) interactive data visualizations. From single charts to whole stories involving many unique and custom-made visuals. I love doing static visuals the most, as this gives me the freedom to get as creative as I can be. However, I also enjoy adding some subtle animations and interactions to my work. Going all the way to the creative side, I make data art to frame on a wall or use as branding or marketing material. And finally, I thoroughly enjoy spreading my enthusiasm for good data visualization by speaking and presenting at meetups and conferences.
If you’re interested in my projects & experiments, please feel free to contact me to find out how we might work together!
Awards
2022
Exemplary Book
Information is Beautiful Awards
winner
2022
NFT
Dutch Creativity Awards
winner
2021
Data Visualization
Eddie and Ozzie Awards
finalist
2020
Silver in Features | Print
Malofiej
winner
2020
Silver in Features | Digital
Malofiej
winner
2020
Bronze in Features | Digital
Malofiej
winner
2020
Bronze in Innovation | Dataviz
Malofiej
winner
2019
Arts, Entertainment & Culture
Information is Beautiful Awards
shortlist
2019
Best DataViz
World Digital Media Awards
winner
2019
Bronze in Innovation | Dataviz
Malofiej
winner
2018
Gold in Politics & Global
Information is Beautiful Awards
winner
2018
People, Language & Identity
Information is Beautiful Awards
shortlist
2018
Arts, Entertainment & Culture
Information is Beautiful Awards
shortlist
2017
Best Individual
Information is Beautiful Awards
winner
2018
Investigative Data Journalism
Online Journalism Awards
winner
2018
Best DataViz
North American Digital Media Awards
winner
2018
Innovation
Amnesty Media Awards
finalist
2018
Silver in Features | Digital
Malofiej
winner
2018
Bronze in Design
Malofiej
winner
2017
Gold in Unusual
Information is Beautiful Awards
winner
2017
Silver in Science
Information is Beautiful Awards
winner
2016
Rising Star
Information is Beautiful Awards
winner
2017
People, Language & Identity
Information is Beautiful Awards
shortlist
2017
People, Language & Identity
Information is Beautiful Awards
shortlist
2016
Data Visualization
Information is Beautiful Awards
shortlist
2015
Urbanization challenge
The World Bank & Visualizing.org
winner
Publications
- Data Sketches | A journey of imagination, exploration & beautiful data visualizations
- Playful Data | Graphic Design and Illustration for Infographics
- Data Visualization for Success | Interviews with 40 Experienced Designers
- Data Visualization Handbook | A Practical Guide to DataViz
Exhibitions
- Flatlands | Alba | 20 - 30 June, 2023 | Online | Release of the Fleeting Thoughts at Alba’s “Flatlands” exhibition.
- The Turning Point | Thud Studio | 19 - 28 May, 2023 | Amsterdam, The Netherlands | Display of a “Wanderlust” and more at Thud Studio’s exhibition.
- NFCastle | NFCastle 2022 | 27 October - 13 November, 2022 | Prague, Italy | Display of “The Essence of Us” in the “NFCastle” exhibition at the Lobkowicz Palace in Prague Castle.
- Cortesi Gallery | Unpredictable Lines | 7 July - 5 August, 2022 | Milan, Italy | Display of my Obscured collection in the “Unpredictable Lines” exhibition of Cortesi Gallery.
- Art Blocks | NFT.NYC | 22 June, 2022 | New York, USA | Display of nine Rotae at the “Art Blocks x Samsung” exhibition.
- NINFA | NFT.NYC | 20 June, 2022 | New York, USA | Display of Westerlund 2 | #2 at the “NINFA X SuperChief” exhibition.
- Immutable | Vellum LA | 2-9 June, 2022 | Los Angeles, USA | Display of several Anhedra at the GEN.ART “Immutable” exhibition.
- Decentral Art Pavilion | Venice Art Biennale | April 29 - May 1, 2022 | Venice, Italy | Display of two Rotae at the “Generative Art Special Weekend” exhibition.
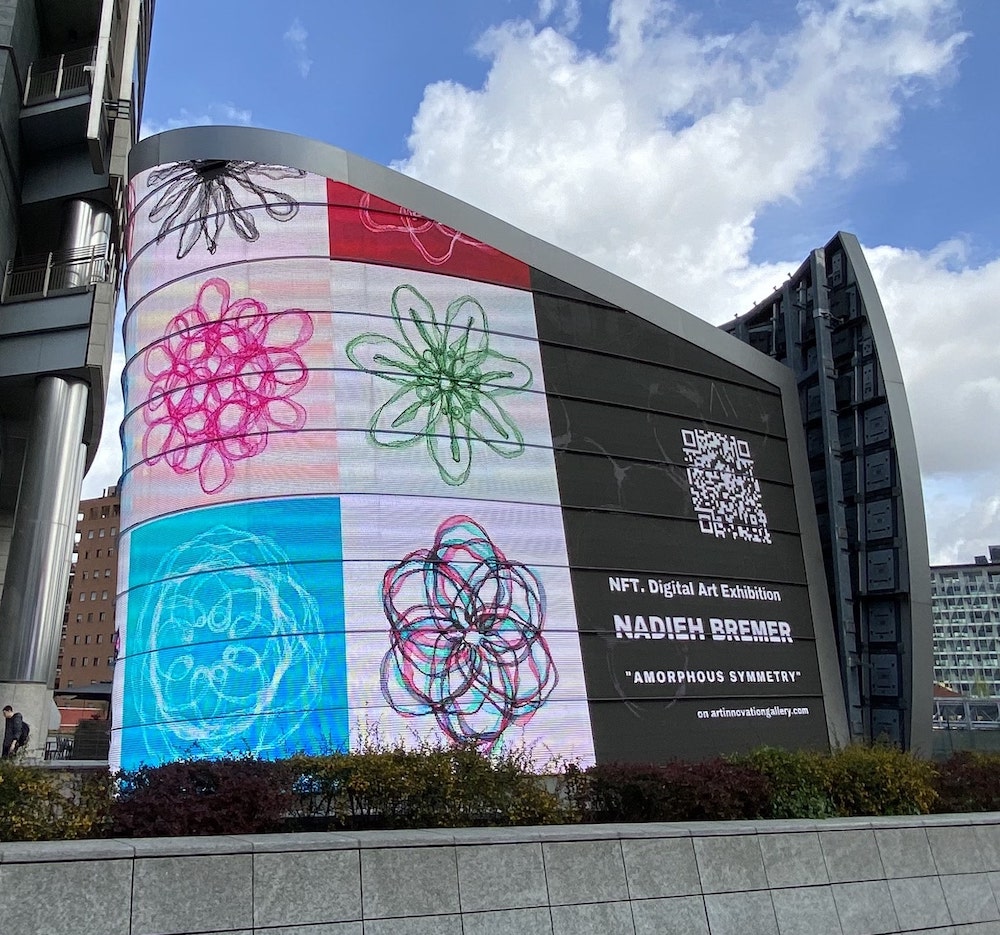
- Art Innovation Gallery | International Modern and Contemporary Art Fair | 1-3 April, 2022 | Milan, Italy | Display of my Amorphous Symmetry collection on giant LED walls at the Piazza Gae Aulenti square during the Milan Art Fair.
I love to speak & teach about my passion for data visualization
I’ve had the pleasure of speaking at conferences such as
Selected interviews
- Data Science by Design | A Conversation With Nadieh Bremer
- Datawrapper | Freelancing, finding inspiration, and sharing the full journey
- Shaping Design | Designing data visualizations
- Being Freelance | Episode 213 | Documenting the process
- Nightingale | Intricate & Visually Exciting
- The Outlier | The Beauty of Data Visualization
- Communication Arts | The Art of Data
- VizSimply | An interview that goes into my first year as a freelancer
- Malofiej | Nadieh Bremer, self-taught Data Visualization Designer
- DigitalArts | How to create powerful data visualisations
- SuperDataScience | Episode 81 | DataViz & How to Freelance Your Passion
- ScriptCast | Episode 3 | Sushi with Nadieh Bremer
- Data Stories | Episode 98 | data sketch|es
- UI Animation Newsletter | Animation in Dataviz
- PolicyViz | Episode 65 | SVGs, colors, d3 & data sketch|es
- Data Stories | Episode 85 | Olympic Feathers
Selected online press
- Hackaday | Jigsaw Puzzle Lights Up With Each Piece
- WIRED UK | Translations from across the world prove we are united by goodness & beauty
- Co.Design | What Happens When Google Turns Artists Loose On Its Search Data
- Scientific American | The Boundless Beauty of Pi
- .NET magazine issue 280 | Boosting d3.js charts with SVG gradients
- The Washington Post | The mind-blowing growth in East Asian cities, visualized