recent post
Design & D3.js
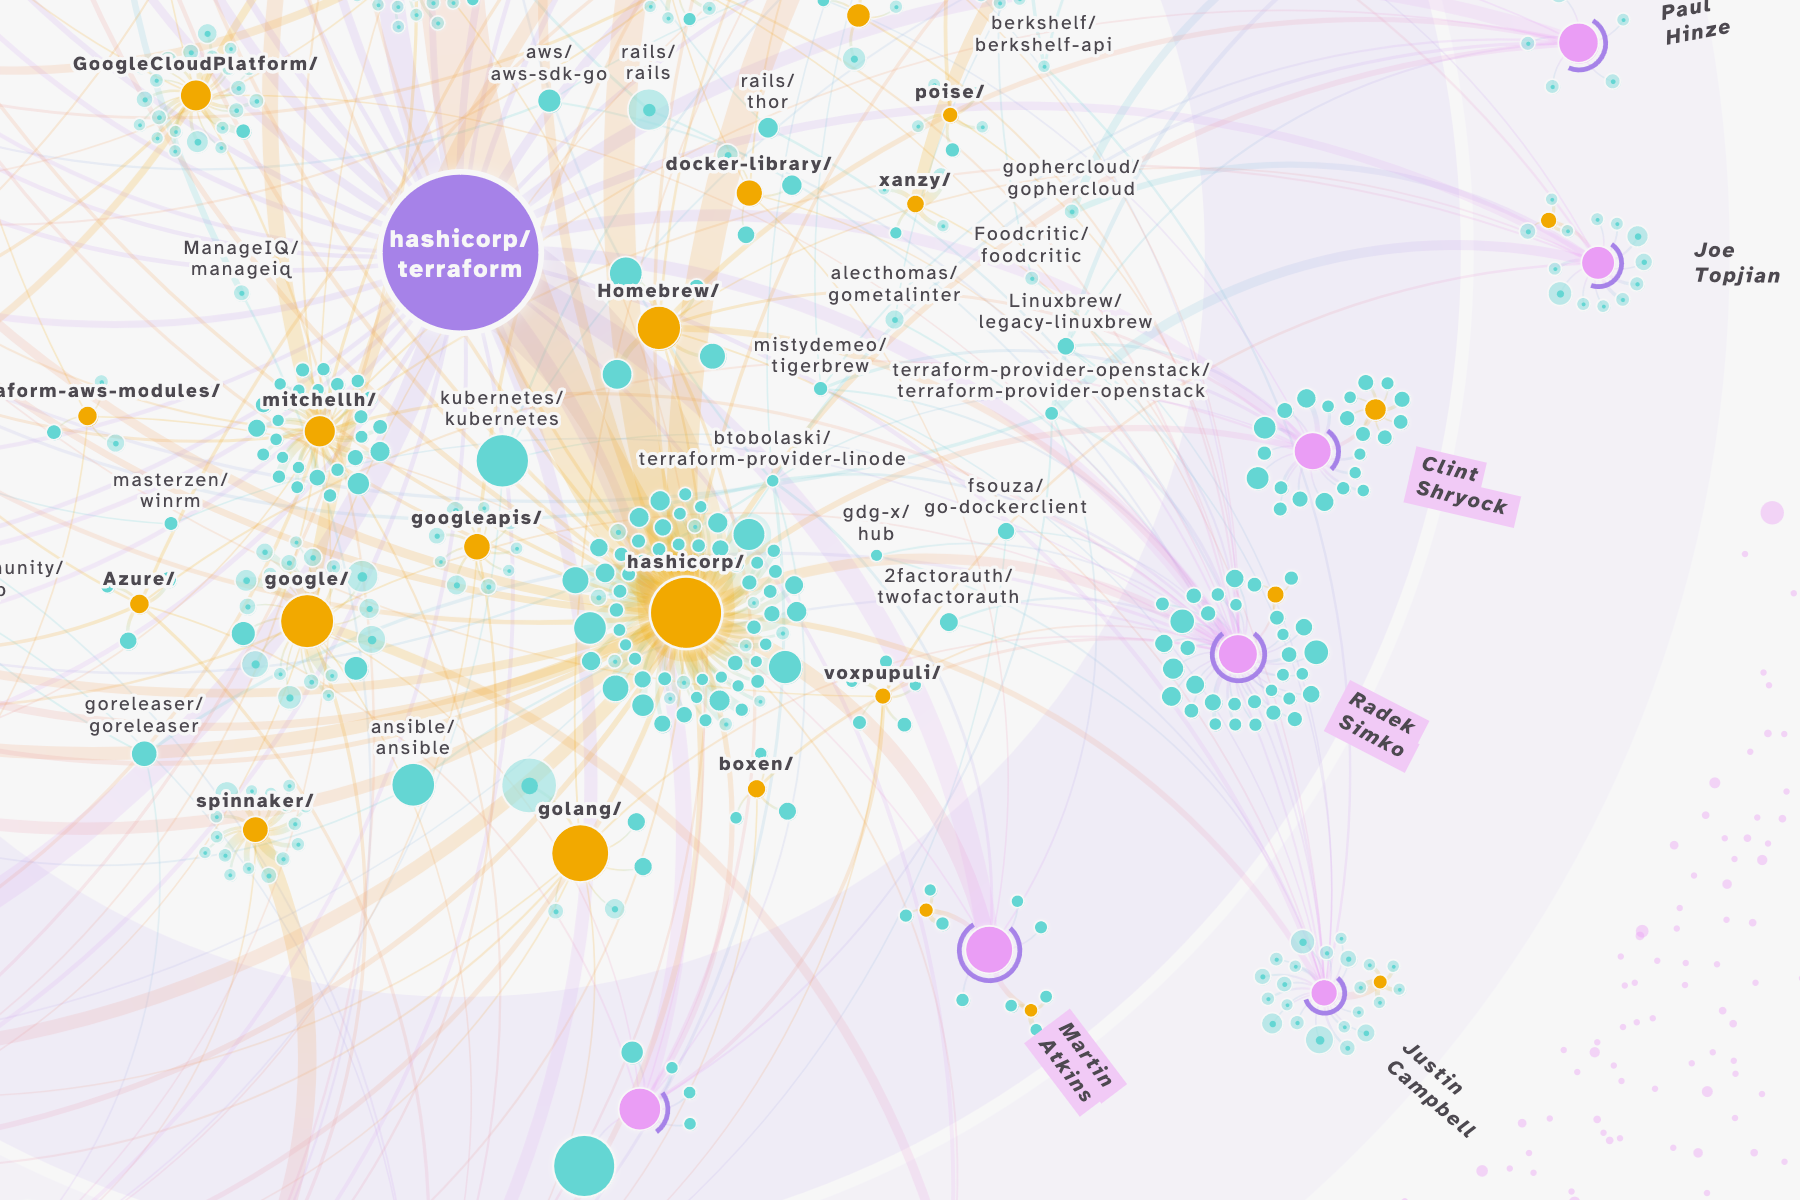
In this blog I want to show you the design process that went into creating the “Top Contributor Network” visual. Showing the ecosystem and synergy of the other repositories the top contributors of any GitHub repository have worked on.
How it started from a simple network, and became …
Design & Map
Design & Personal
Design & Data Art
Design & Static
Design & Static
Tutorial & D3.js
Design & D3.js