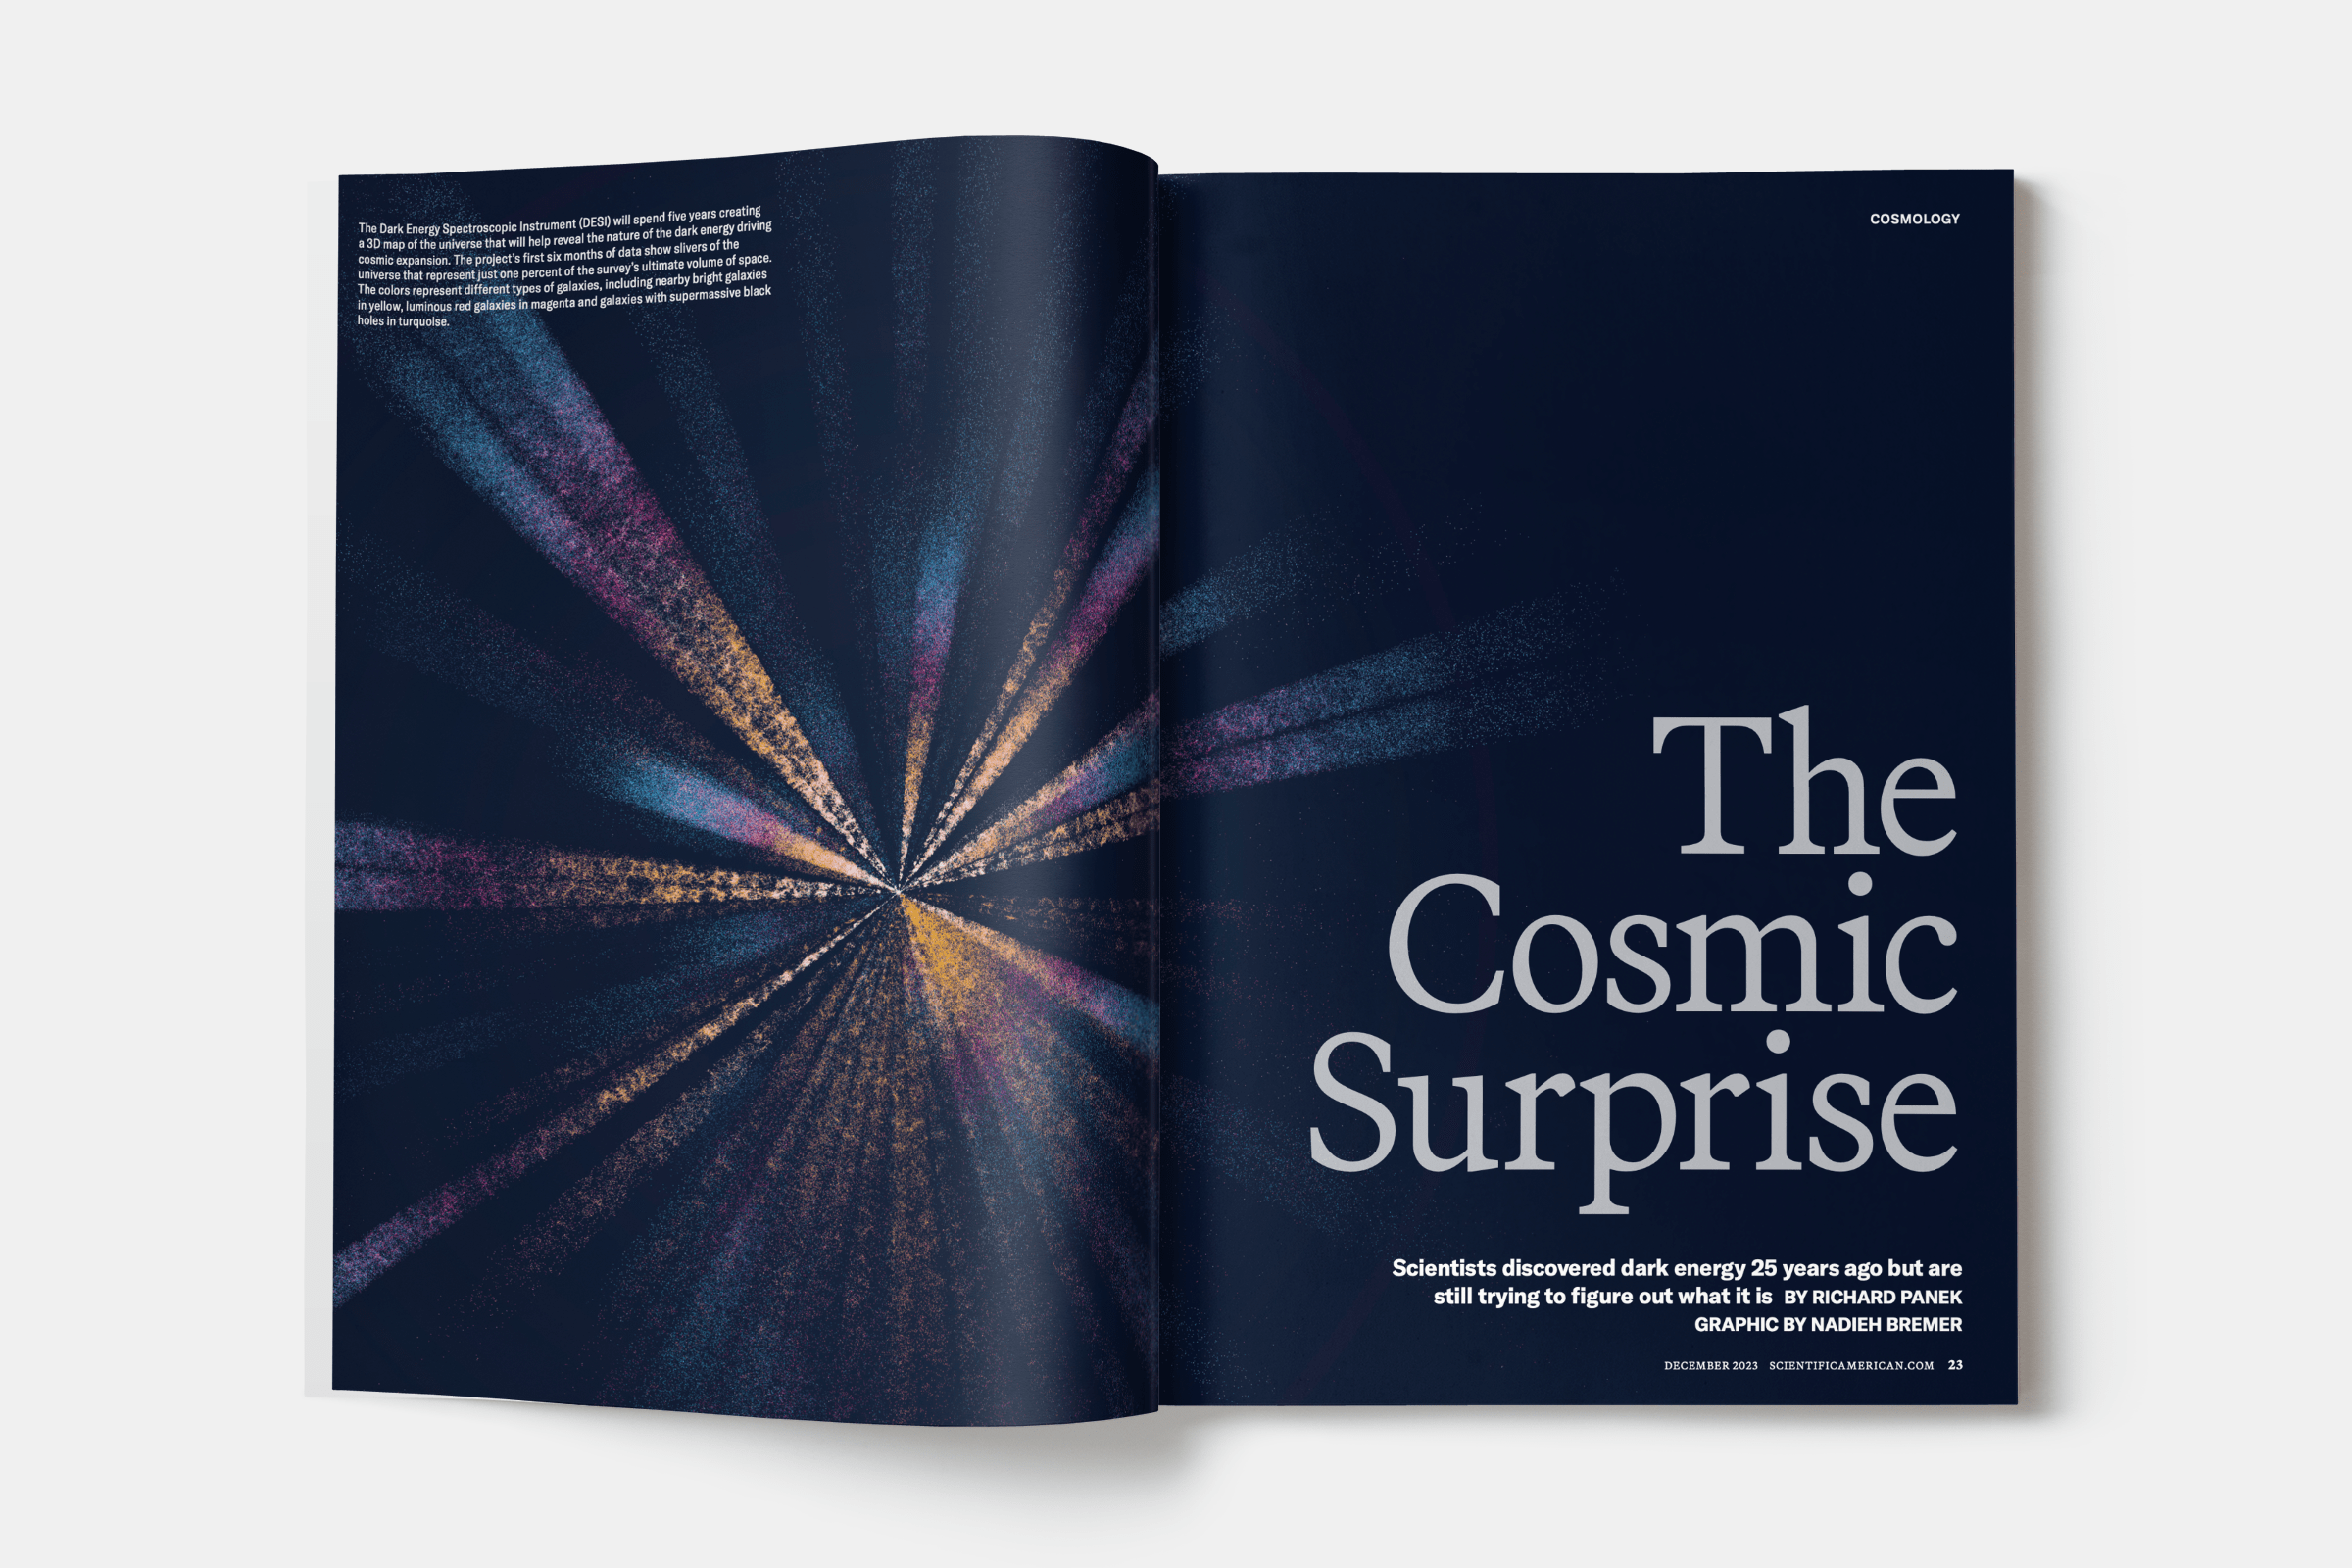
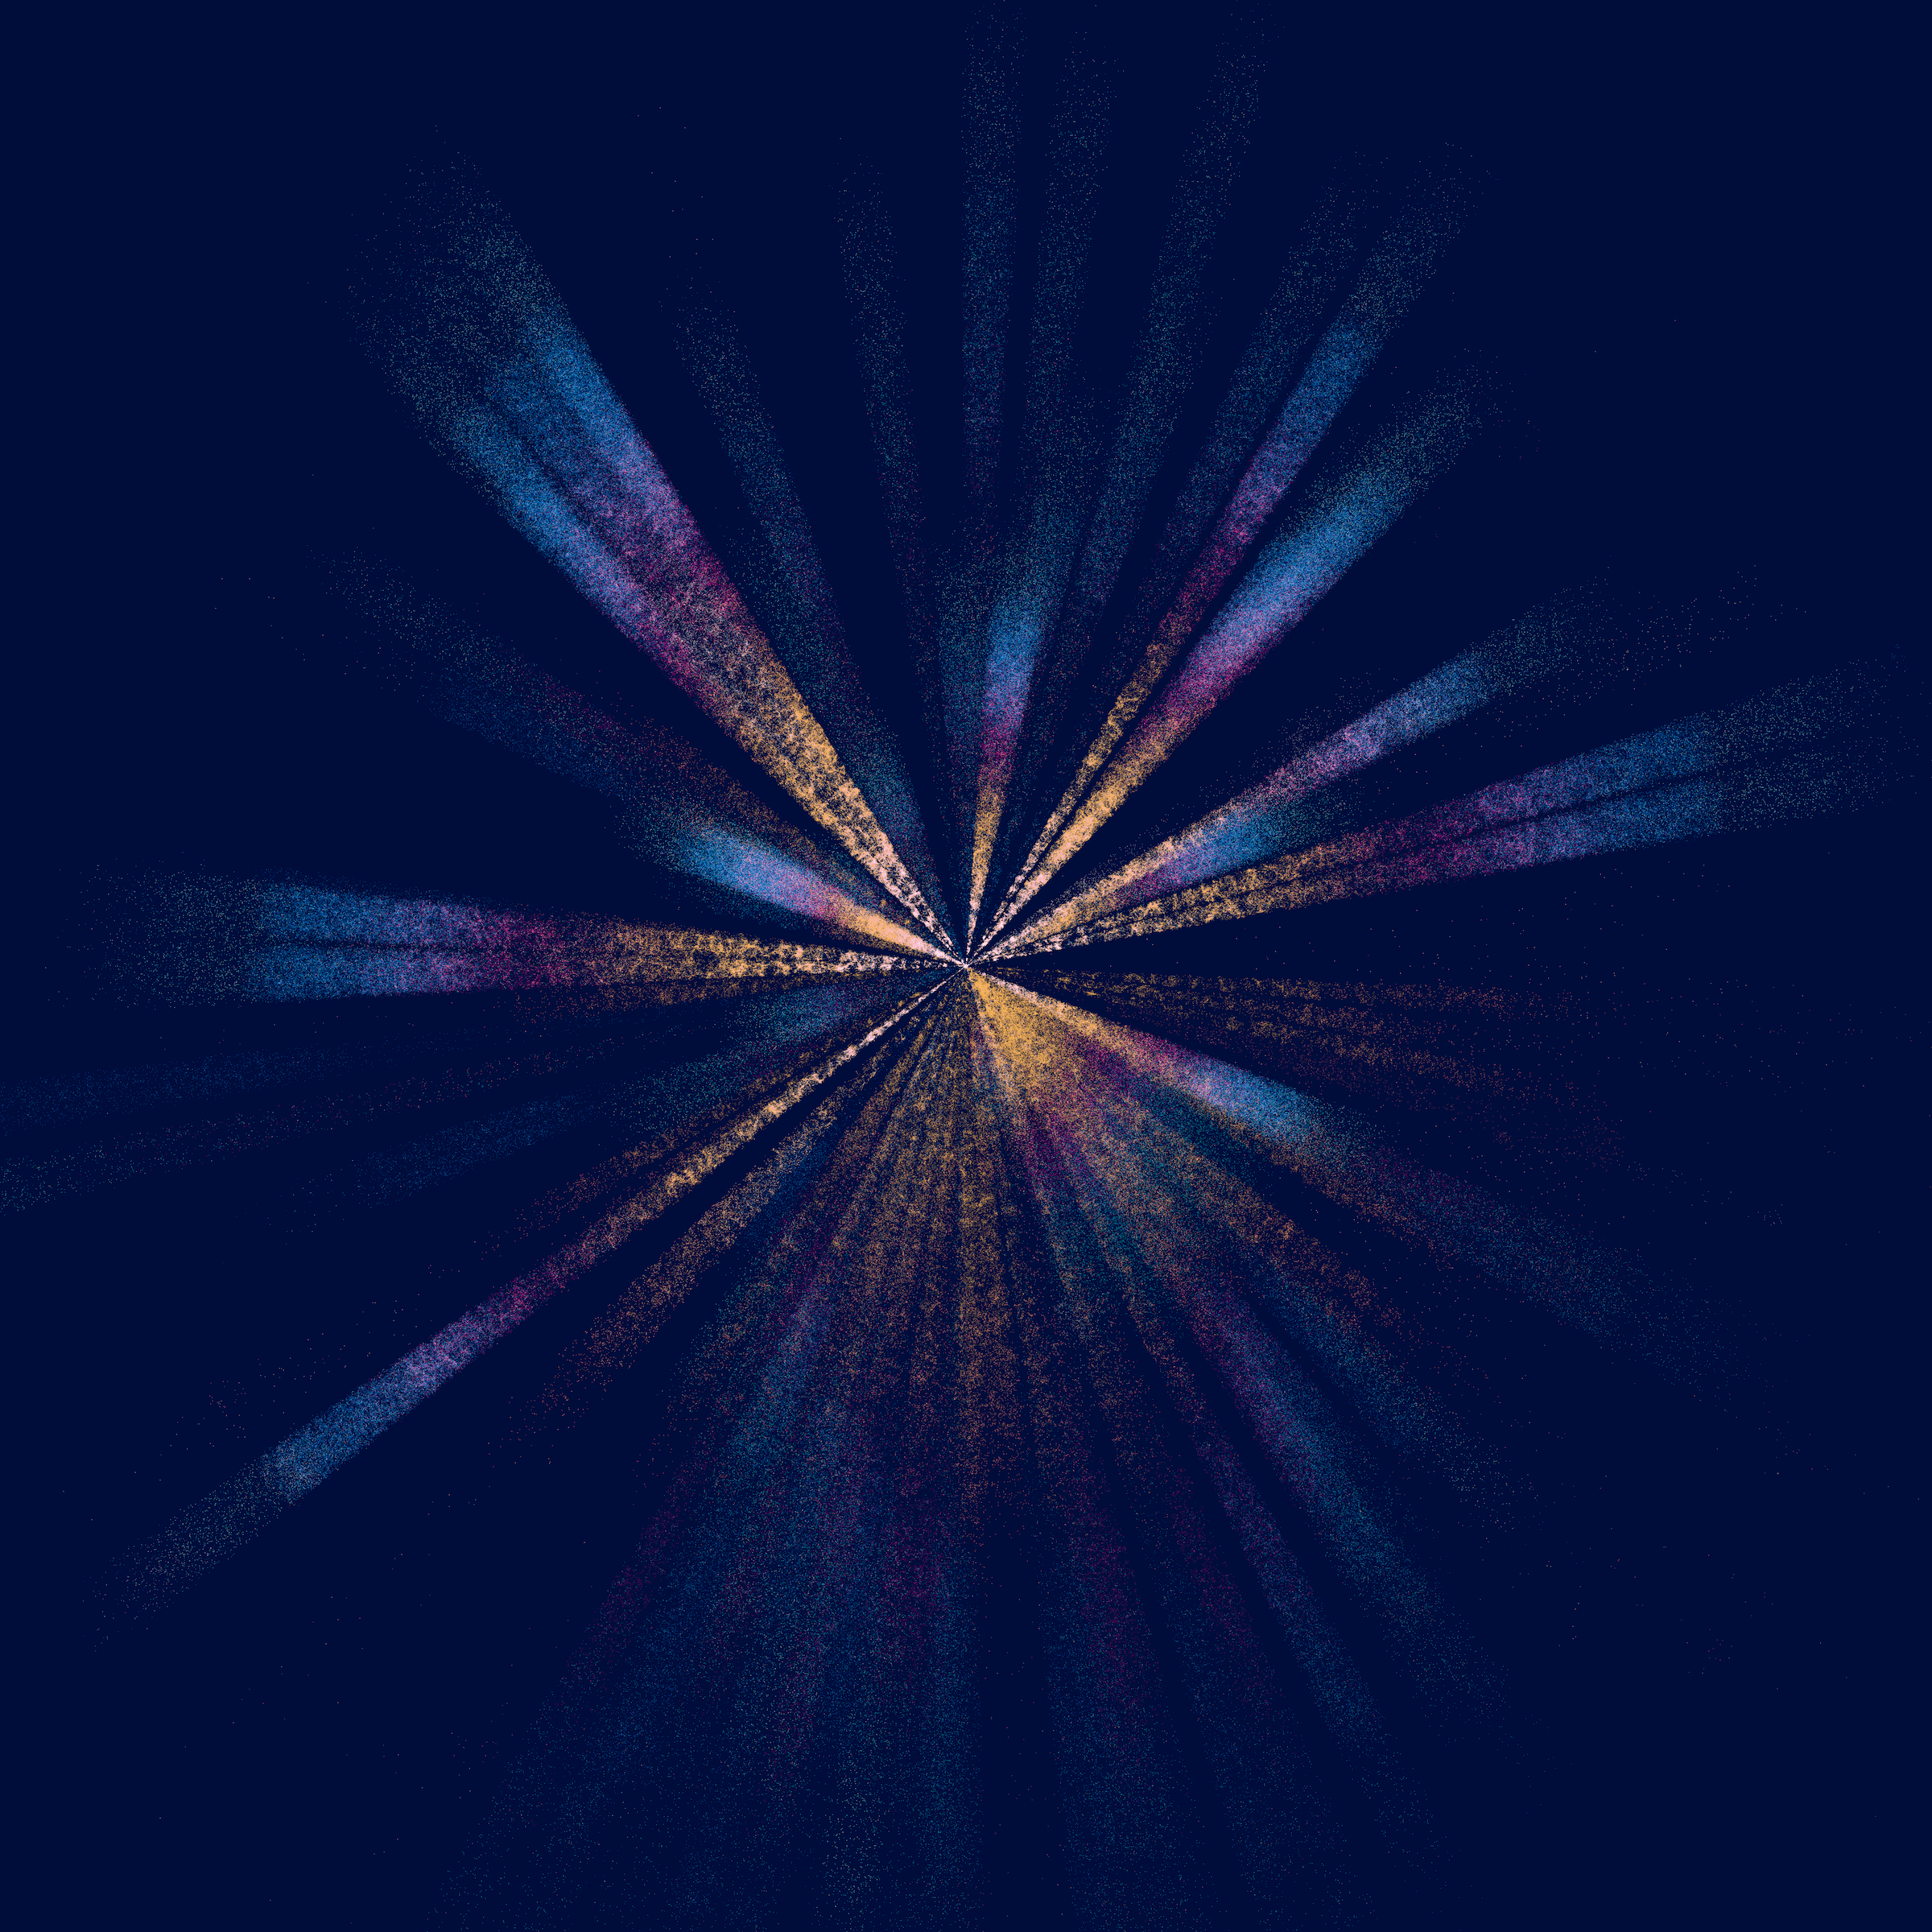
Scientific American asked me to create an image for the opening spread of an article that goes into the 25 years since the discovery of Dark Energy, for the December issue of 2023. They felt that the “Cosmic Web” style of imagery had been overused, and they wanted something fresh. Thankfully, they gave me several possible data sources to explore. From this, I choose to go with DESI (Dark Energy Spectroscopic Instrument) which had recently made an Early Data Release available. When reconstructed in a 3D fashion, the data looked like “beams” pointing out into space, with millions of galaxies revealed. This created a unique image, akin to data art, to use for the spread.
It took several hours to get myself acquainted with the DESI dataset, which of their variables to use, how to remove obvious faulty observations, and to use the Python API to download the data I wanted to use for the visual.
With my past experience working with astronomy data, turning this data into a 3D scene of dots thankfully went very quickly.
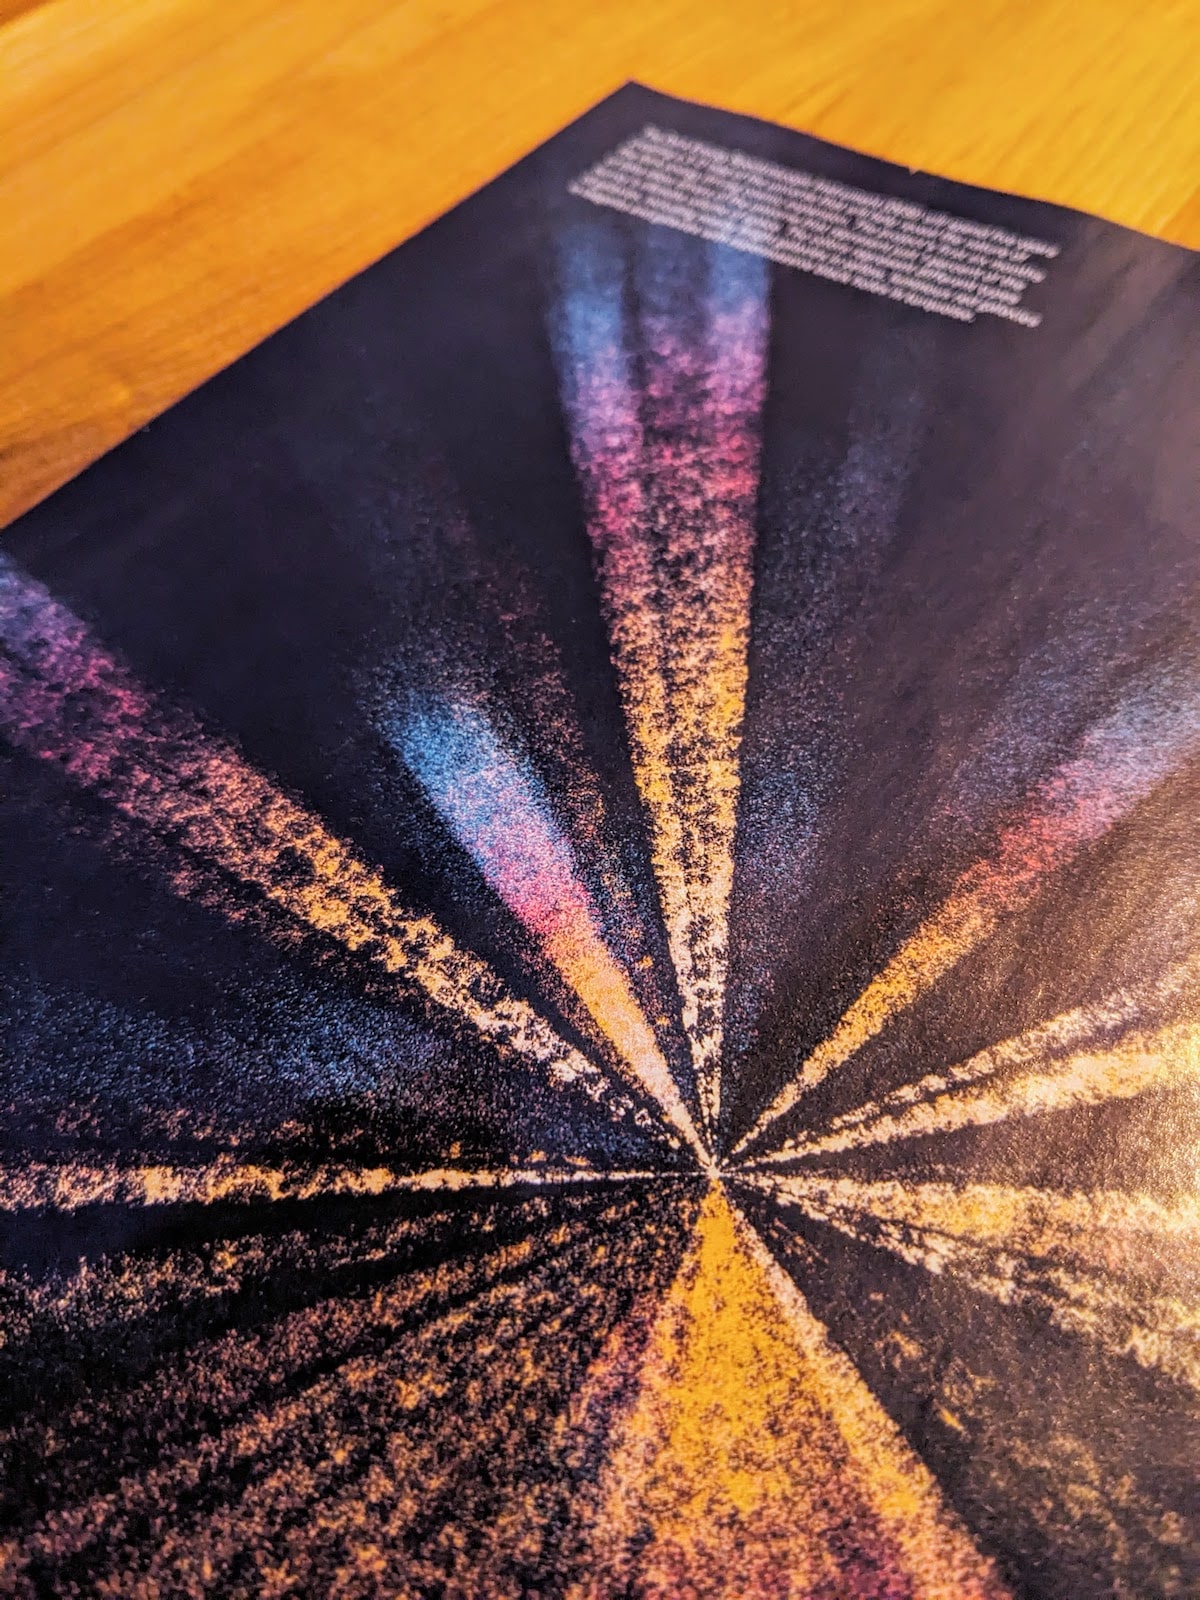
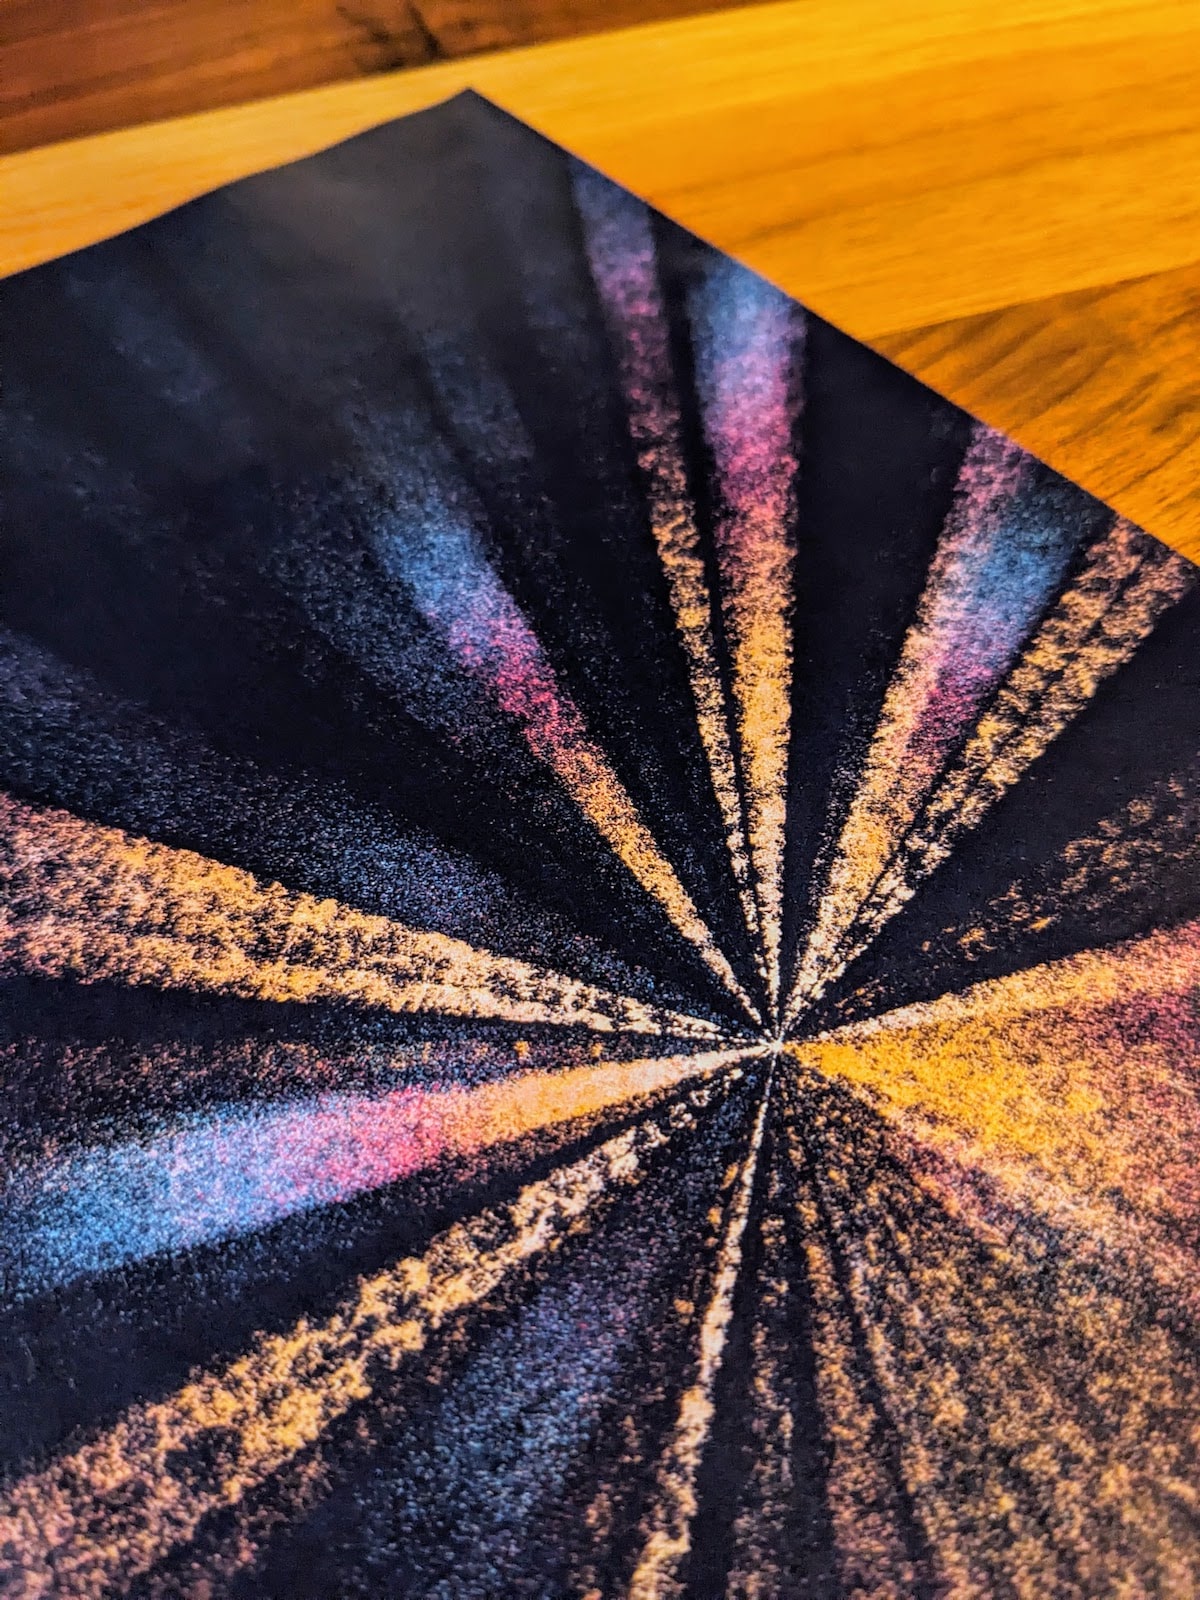
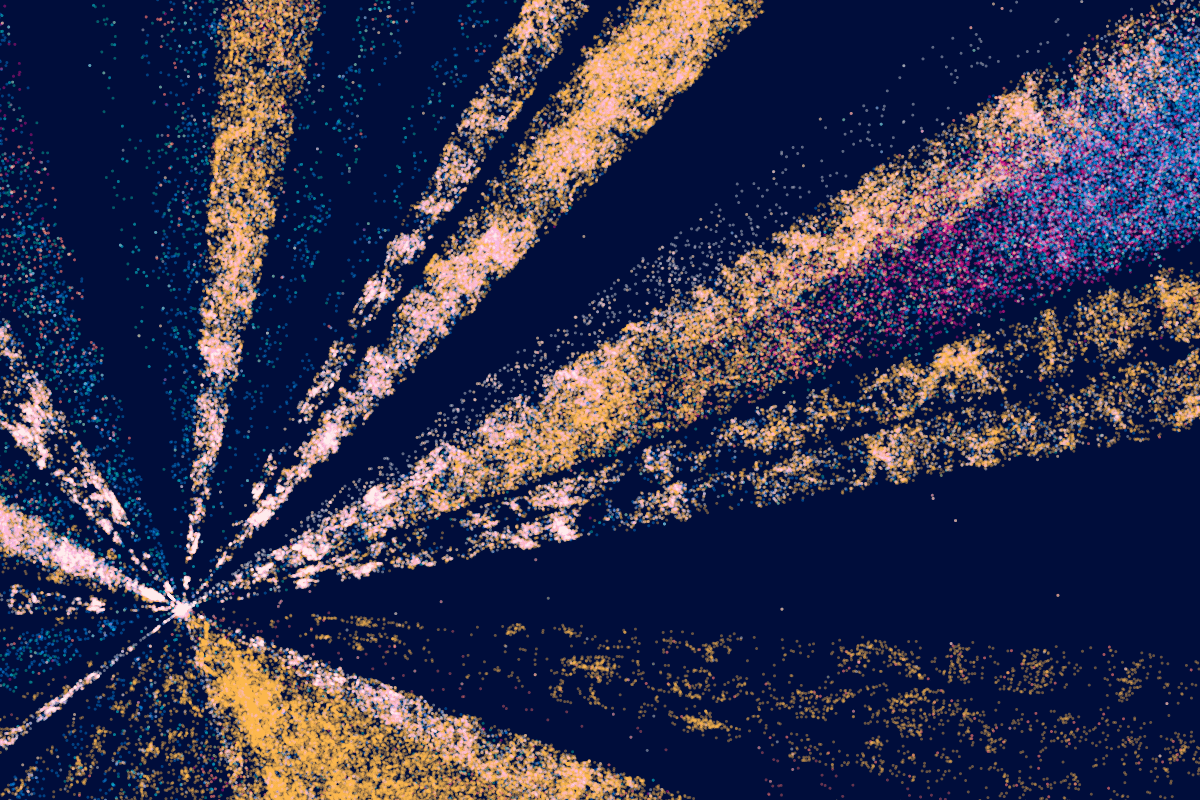
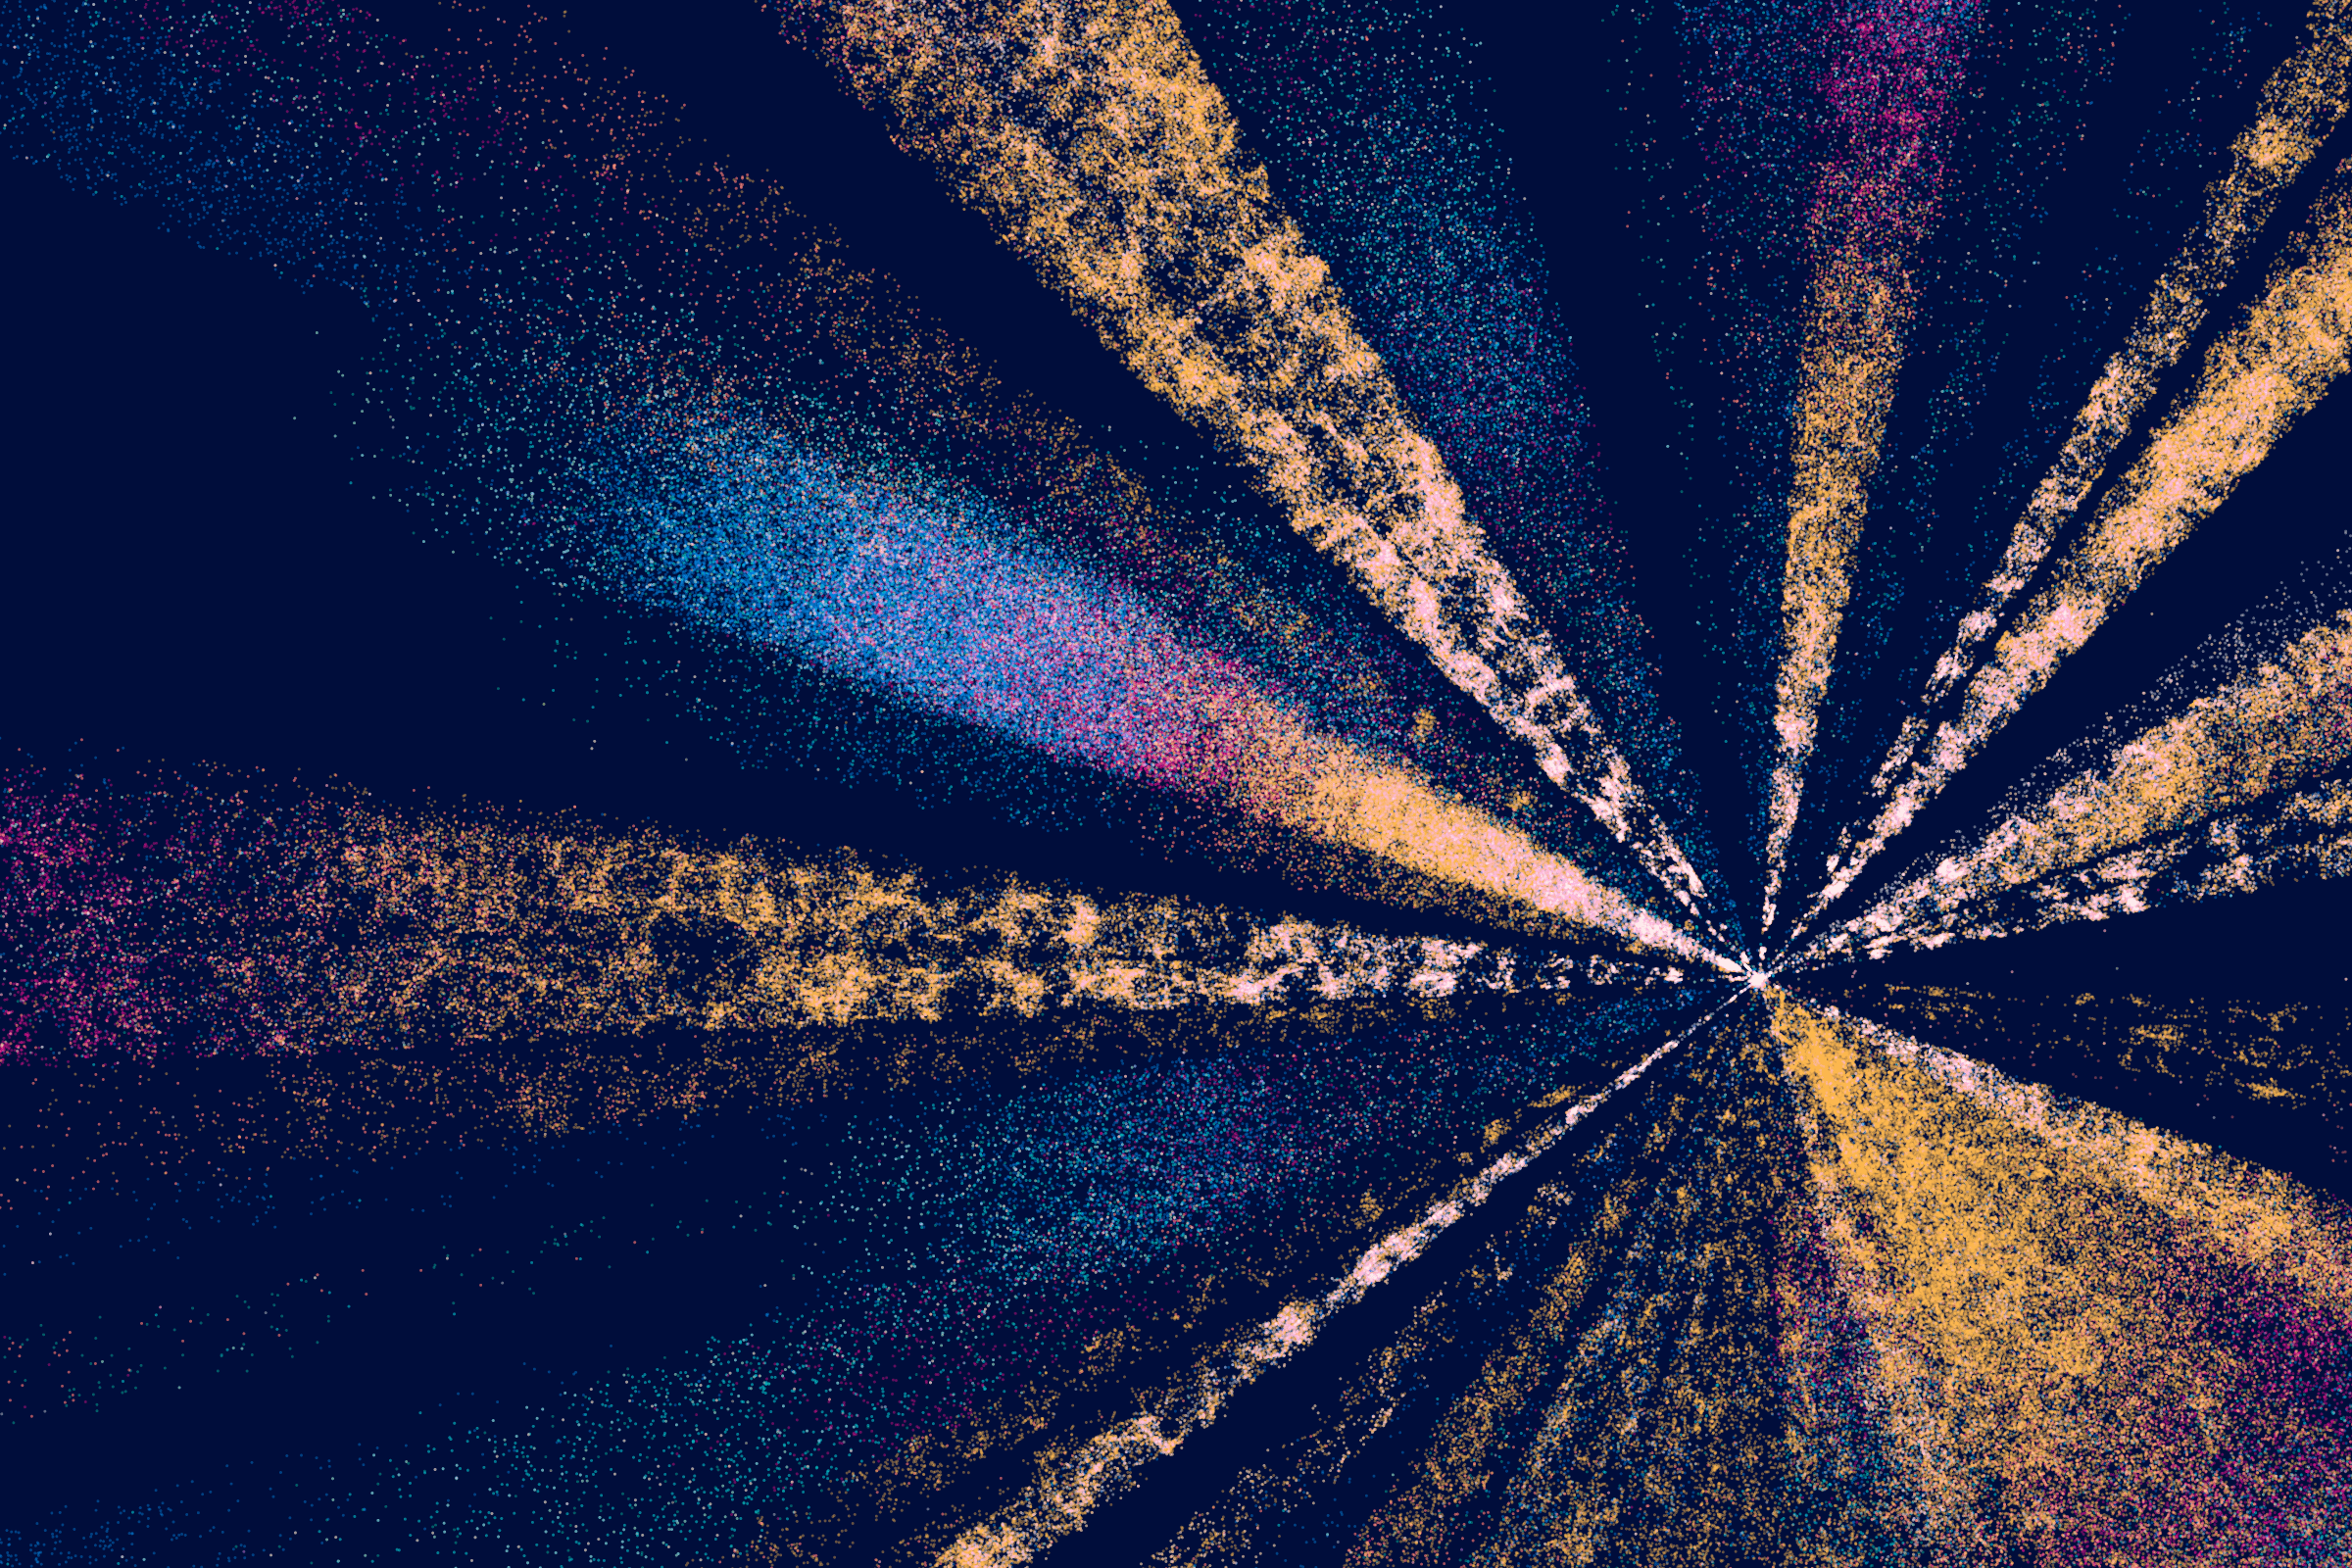
The final image shows roughly 1.6 million objects from the DESI Early Data Release. Each of the “beams” shows a direction that DESI has been pointed into. I loved the metaphor this created visually. As if a flashlight had been pointed out into space and in its beam all these millions of galaxies revealed themselves.
As the visual structure of the beams was already quite powerful, I only color-coded the galaxies to their type (including nearby bright galaxies in yellow, luminous red galaxies in magenta and galaxies with supermassive black holes in turquoise), for an extra bit of vibrance and detail to add.
You can read an online version of the article on the Scientific American site.