I’ve been using self organizing maps (or SOM) to analyse client data for more than a year now. In the beginning I tried some commercial software, but I did not like the fact that it was too easy to just randomly click some buttons and a map showed up. I wanted to know what was happening under the hood.
I wanted to learn R anyway, so I thought creating my own SOM program in R would be a good goal to start doing this. I used the som function in the Kohonen package as a base, but in the next month or two I added a lot of functionality around it:
- Taking a sample
- Turning character variables into binary/flag fields
- Showing distributions per variable to get a sense of the spread
- Capping outliers
- Pop-up window making variable selection a matter of checking the box before the variable name
- Scaling the chosen variables to cluster on: either based on variance or range, depending on the distribution of the variable
- Making the SOM function work with
NAvalues - Calculating both the quantization error and the topographic error
- Adding the option to make a Growing SOM -> starting with a 2x2 grid and adding either a new row or column at the point with the biggest quantization error until the total map has a quality below some set value by the user. In this manner, the user does not have to specify the map size (number of rows and columns) at that start, but only the final map quality
- Automatically output the results. After the SOM has been performed once, the results can to be read in at a later stage (which I automated as well) and all the heatmaps and statistics are immediately accessible
- Using SOM-Ward the program now calculates a segmentation of the nodes themselves, so the total map is subdivided into a manageable number of segments
In terms of the SOM algorithm the biggest change is the parallel code I added in the C coded section using OpenMP, which took much longer to achieve than I had in mind…
Visualization
However, I was not at all satisfied with the plotting of the SOM; mini line charts, wind roses or circles in a grid ಥ_ಥ I couldn’t really work with this once the number of variables used to cluster was bigger than about 5.
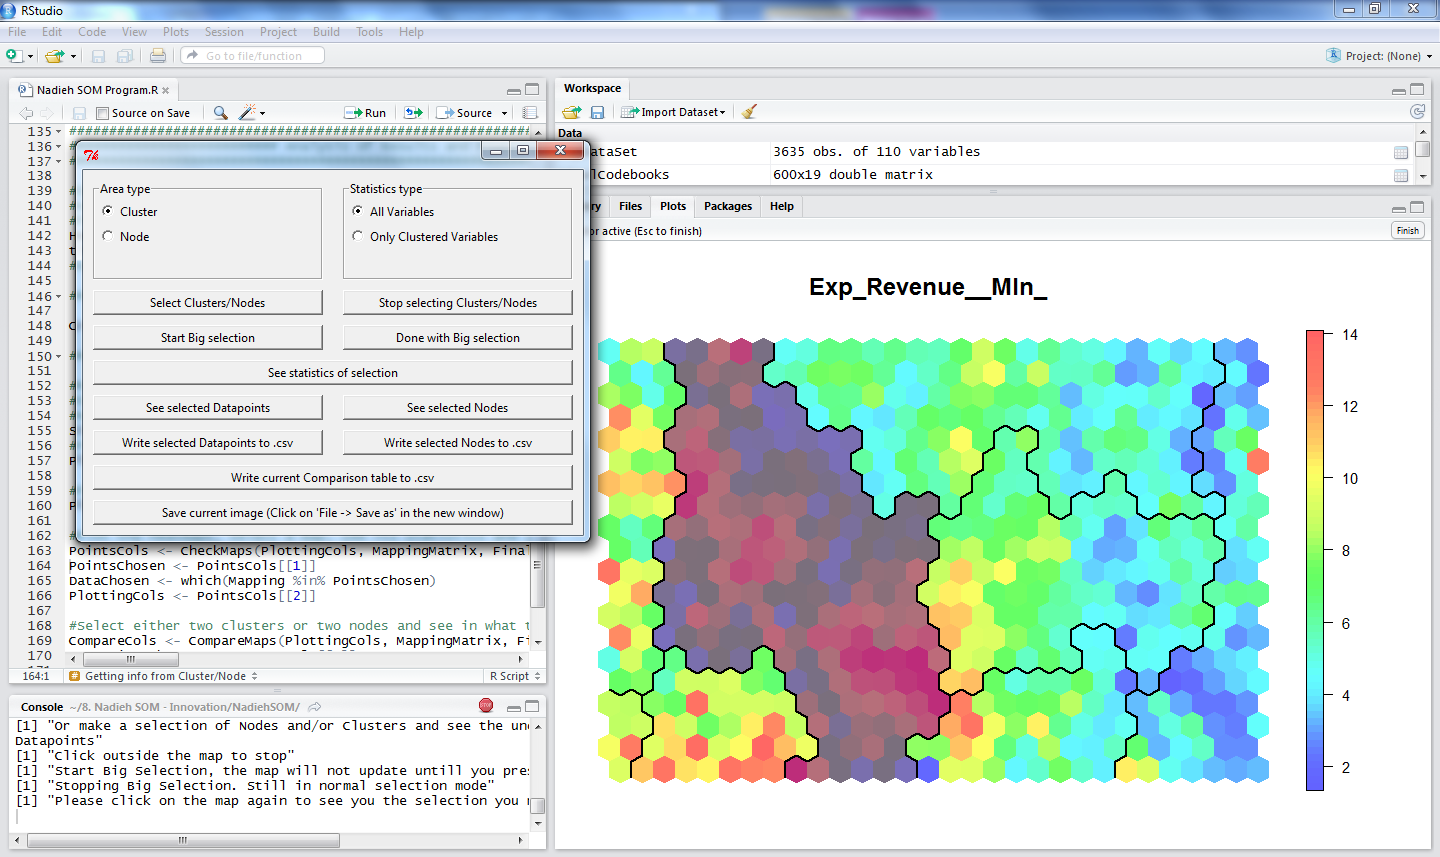
I therefore started making my own plotting functions, using hexagons. Each node is plotted as a separate hexagon (using polygons) and colored depending on its value between the minimum and maximum of that particular variable. It began small, but the visualization part kept on growing. I added functions to:
- Click inside the plot and select specific (groups of) nodes
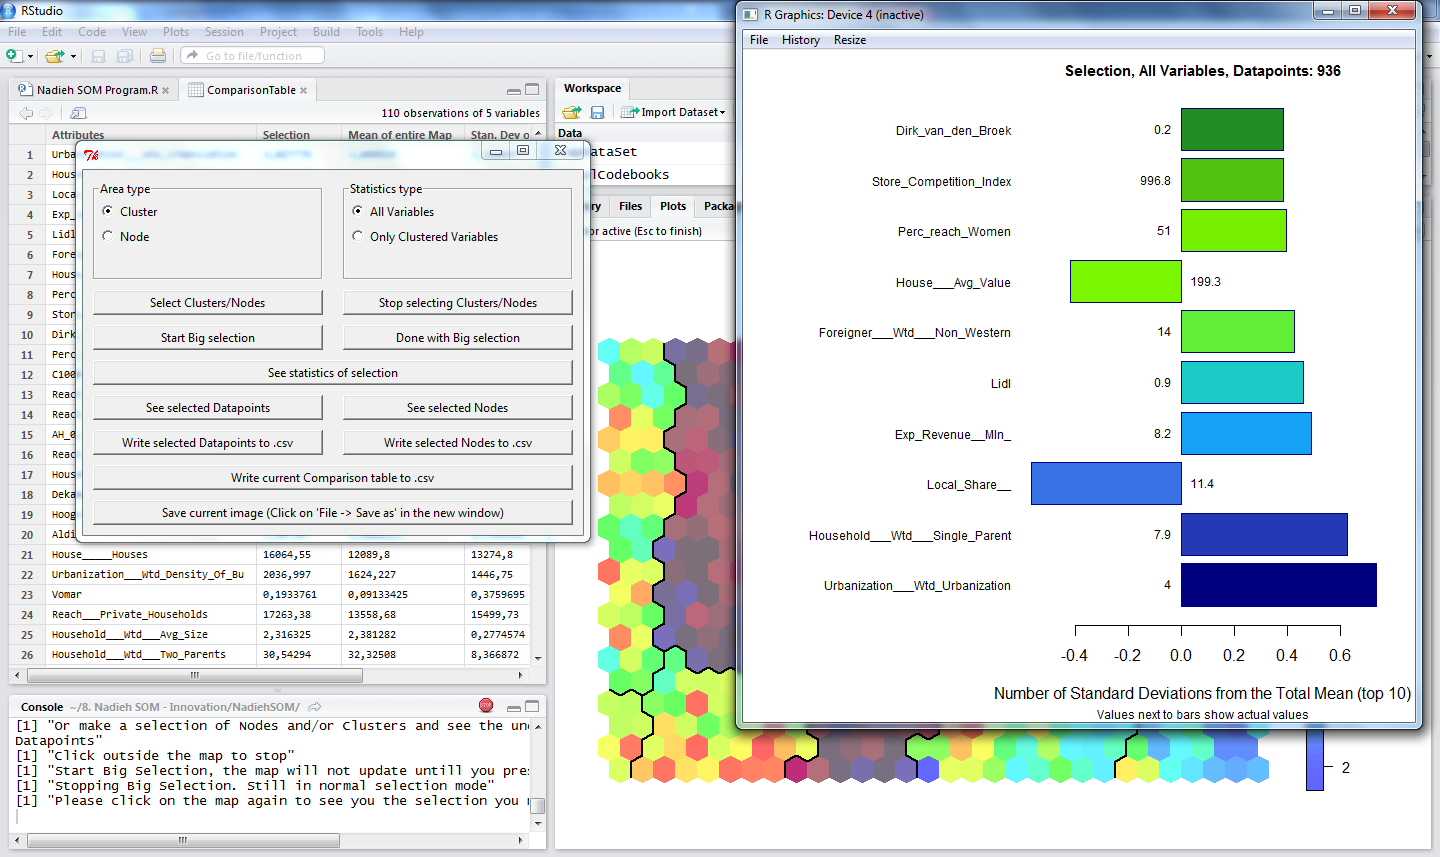
- See their statistics, compare them to the total map
- Automatically save all or a specific set of heatmaps with title and color legend
- I added pop-up windows so my colleagues, not familiar with R, could choose which maps to show, which map to focus on and analyse this heatmap as well
- And many many small settings, e.g. when are there too few datapoints behind a node that you want a warning when a mean is calculated, etc.
This enabled me to make it a lot easier to answer question such as What sets the chosen segment or group of nodes apart from the total map? Why are these nodes added into one segment, what connects them? They can now make a selection (multiple clusters to singular nodes) and see the underlying values of either the nodes or the data itself and write this to a csv.
Since the program was first functional about a year ago I’ve been able to use the R program on several client projects. It is now being used by several of my colleagues, both from my office and some offices abroad, which, I have to admit, I find pretty neat!
Using it during projects brought me tons of new ideas to make the program even more intuitive. A short selection of the things I still want to add are:
- I want to look into the use of Batch-SOM to make the SOM calculation faster
- Add a way to give the user insight into which variables to use for the SOM, something like correlation compensation
- Set the initialization of the SOM to the 2D plane spanned by the first two eigenvectors calculated through PCA instead of random values. But I have a lot of reading to do to get this working though.
But of course, I am usually working on other projects which severely limits any spare time I have to work on my R SOM program. Most of what I have done so far was done in my spare time. But Coursera has been taking up a lot of that time recently, haha, too many interesting courses. Perhaps I’ll get the chance on my next SOM related client project.
EDIT I created a new post which shares a small piece of code from the program. How to create hexagonal heatmaps in R. I hope you will find it useful.