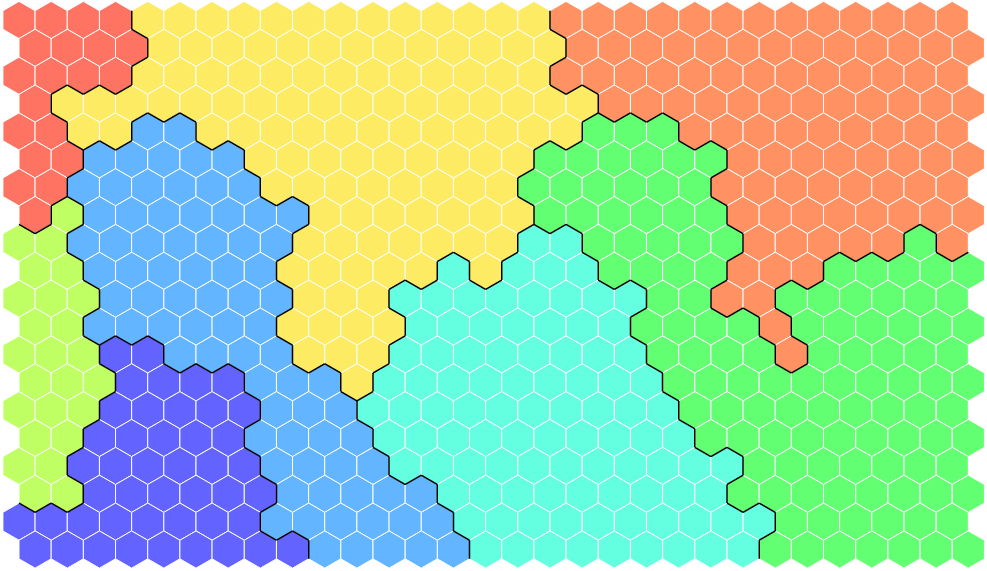
In the previous post I explained how to create a hexagonal heatmap. For example to use as output for a self organizing map. I like to create rather large maps with a lot of hexagons if I have enough data. It gives the idea of a high resolution. In that case it’s very useful to divide the entire map into a manageable number of higher level segments.
Finding the neighbours
I explain more about the R SOM program in this post
I use the SOM-Ward method to calculate the segments, which is all done in R with a SOM program I developed. I could create a post completely on this, but in essence:
- At the start every node is its own segment
- Next merge the two segments that have the smallest distance between them and that are neighbors
- Then update the distance of the new segment (that now consists of two nodes)- Iterate until you have the number of segments you wanted, e.g. 8
In the end each node will have a new property, namely the segment number it belongs to. When two neighboring nodes have a different segment number, a line should be plotted in the heatmap to section off each segment. I therefore loop over each hexagon and calculate if a side needs to get a line in between them. In the end I have a matrix looking like this, where node1 and node2 being neighbors of different segments:
node1     node2
5         6
1         31
...       ...
577       548
578       579
The calculation of the line coordinates
For large maps, there is never a single-node segment, or you did things wrong
As you can see in the image below, one hexagon (not in the edges of the map) has six neighbors. Therefore, there are six types of lines that could be drawn. It depends on the position of the neighbor around the node.
At first I wanted to use cases, where each case would be a different neighboring position around the node. In this set-up I would have six cases. Once I would know the case, I could draw the corresponding line segment based on the center coordinates of the node, using the angle information of the case.

But before I was going to write out six cases and add a lot of lines to my d3.js code, I wanted to see if I could find something smarter. Instead of six cases, couldn’t I see each possible neighbor as the same, only rotated? Was it possible to calculate the line segment coordinates by using only the center coordinates of the two neighbors? I already had this information anyway from creating the hexagonal grid in the first place.
And then it hit me! I could see the problem as calculating the two points of intersection between two circles, since the line would need to be drawn between two corner points
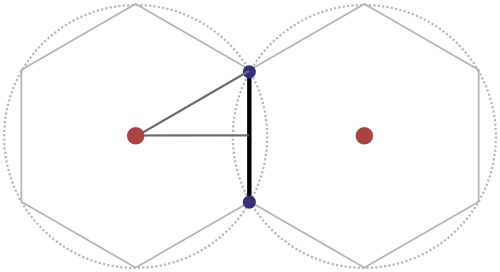
You can find several pages online that have calculated the formula needed to find the blue to dots in the image above, based on the red two center points.
Line segment calculation
The one I found most helpful was the following site about the intersection of two circles. Especially the plot included with the formula is a great help
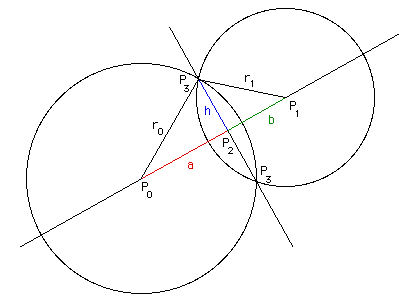
Taking the following mathematical points into account:
- We have two circles with the same radius
- The width of a hexagon,
2*aor2*bin the image above, is equal tosqrt(3) * radius - The height of a hexagon is equal to
2 * radius. And thereforehin the image above is0.25 * height = 0.5 * radius
This turns the formula on The intersection of two circles website into:
//Point one
x3 = x2 + (y1 - y2)/Math.sqrt(3)
y3 = y2 - (x1 - x2)/Math.sqrt(3)

//Point two
x3' = x2 - (y1 - y2)/Math.sqrt(3)
y3' = y2 + (x1 - x2)/Math.sqrt(3)
Where P1[x1,y1] is the center of one of the two nodes and P2[x2,y2] is the location in the middle of the two centers of the nodes (thus in the middle of the line segment).
Coding in d3.js
How to transport this all to d3? Like I said before, I only have to input an array (of arrays) where each subarray contains two entries, the two node id’s where a line should be drawn in between. I can use the points array that I already calculated to make the grid, take the centers of each node and apply the above formulas.
//Calculate the center positions of each hexagon
var points = []
for (var i = 0; i < MapRows; i++) {
    for (var j = 0; j < MapColumns; j++) {
        var x = hexRadius * j * Math.sqrt(3)
        //Offset each uneven row by half of a "hex-width" to the right
        if(i%2 === 1) x += (hexRadius * Math.sqrt(3))/2
        var y = hexRadius * i * 1.5
        points.push([x,y])
    }//for j
}//for i
The rest of the code, to actually calculate the coordinates of the line segment [x3,y3] to [x3',y3'] looks like this
///////////////////////////////////////////////////////////////////////////
///// Function to calculate the line segments between two node numbers ////
///////////////////////////////////////////////////////////////////////////
//Which nodes are neighbors
var neighbour =
[[577,548], [578,579], [578,548], [578,549],
//... other arrays in between ...,
[33,34], [33,4], [46,47], [46,17], [3,4], [16,17]];

//Initiate some variables
var Sqr3 = 1/Math.sqrt(3);
var lineData = [];
var Node1,
    Node2,
    Node1_xy,
    Node2_xy,
    P1,
    P2;

//Calculate the x1, y1, x2, y2 of each line segment between neighbors
for (var i = 0; i < neighbour.length; i++) {
    Node1 = neighbour[i][0];
    Node2 = neighbour[i][1];

    Node1_xy = [points[Node1][0],points[Node1][1]];
    Node2_xy = [points[Node2][0],points[Node2][1]];

    //P2 is the exact center location between two nodes
    P2 = [(Node1_xy[0] + Node2_xy[0])/2, (Node1_xy[1] + Node2_xy[1])/2]; //[x2,y2]
    P1 = Node1_xy; //[x1,x2]

    //A line segment will be drawn between the following two coordinates
    lineData.push([(P2[0] + Sqr3*(P1[1] - P2[1])),
                   (P2[1] + Sqr3*(P2[0] - P1[0]))]); //[x3_top, y3_top]
    lineData.push([(P2[0] + Sqr3*(P2[1] - P1[1])),
                   (P2[1] + Sqr3*(P1[0] - P2[0]))]); //[x3_bottom, y3_bottom]
}//for i
Drawing the lines
The final step: we initiate a d3.svg.line And loop over each [x3,y3], [x3',y3'] pair to draw the line
var lineFunction = d3.svg.line()
    .x(function(d) {return d[0];})
    .y(function(d) {return d[1];})
    .interpolate("linear");

var Counter = 0;
//Loop over the lineData and draw each line
for (var i = 0; i < (lineData.length/2); i++) {
    svg.append("path")
        .attr("d", lineFunction([lineData[Counter],lineData[Counter+1]]))
        .attr("stroke", "black")
        .attr("stroke-width", 1.25)
        .attr("fill", "none");

    Counter = Counter + 2;
} //for i
Because each line needs two pairs of subarrays, the loop only goes over half the length of lineData, and I use a Counter to jump two indices ahead in each loop. Adding all this to the end of the code of the previous post, should give you the following result:
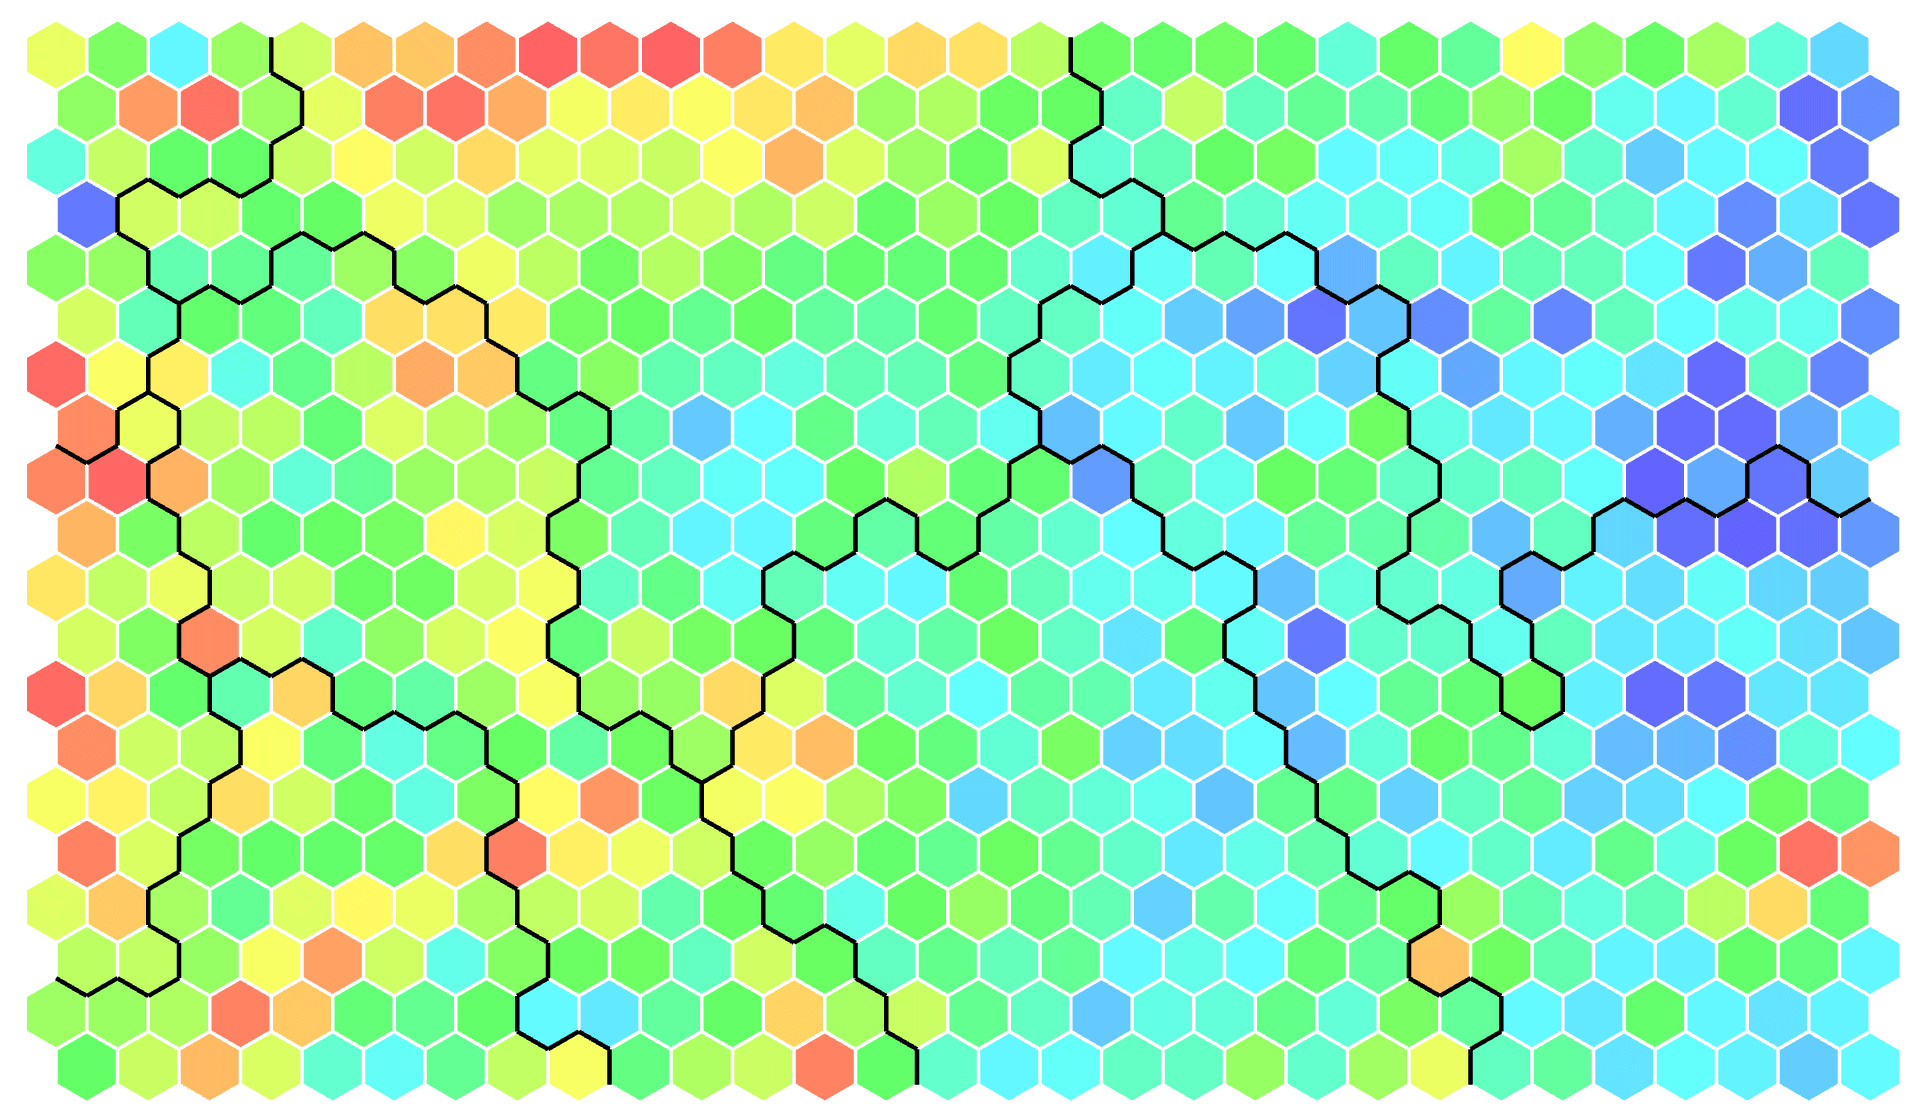
I am sure that all of this could also be done in other (faster/better) ways, but I’ve only been playing around with d3 and Javascript for about 3 weeks so I’m just happy that I got it working in the first place. You can find the code and example here.
I’ve now started to read one of the only books on learning D3.js called Interactive Data Visualization for the Web - An Introduction to designing with D3 by Scott Murray. Especially the first bit explaining about HTML, CSS and DOM really helped me get a better understanding of the logic behind d3. I think that I appreciate the book more now that I am reading it after I really tried making things with d3 and ran into a lot of frustrations. Especially when trying to access the data that was being read in, having never really worked with JSON (*≧▽≦)