While browsing online I came across several examples of Martin Krzywinski’s Pi art works and I was inspired to try and do a small project with the digits myself. I wanted to try and create something that wasn’t very informative per se, but hopefully pretty to look at, more like art.
I always like art that has its roots in nature, such as we see from many beautiful Hubble photos of the Universe, microscopic photographs of Vitamins or close-ups of the heart of a Sun Flower to name just a few.
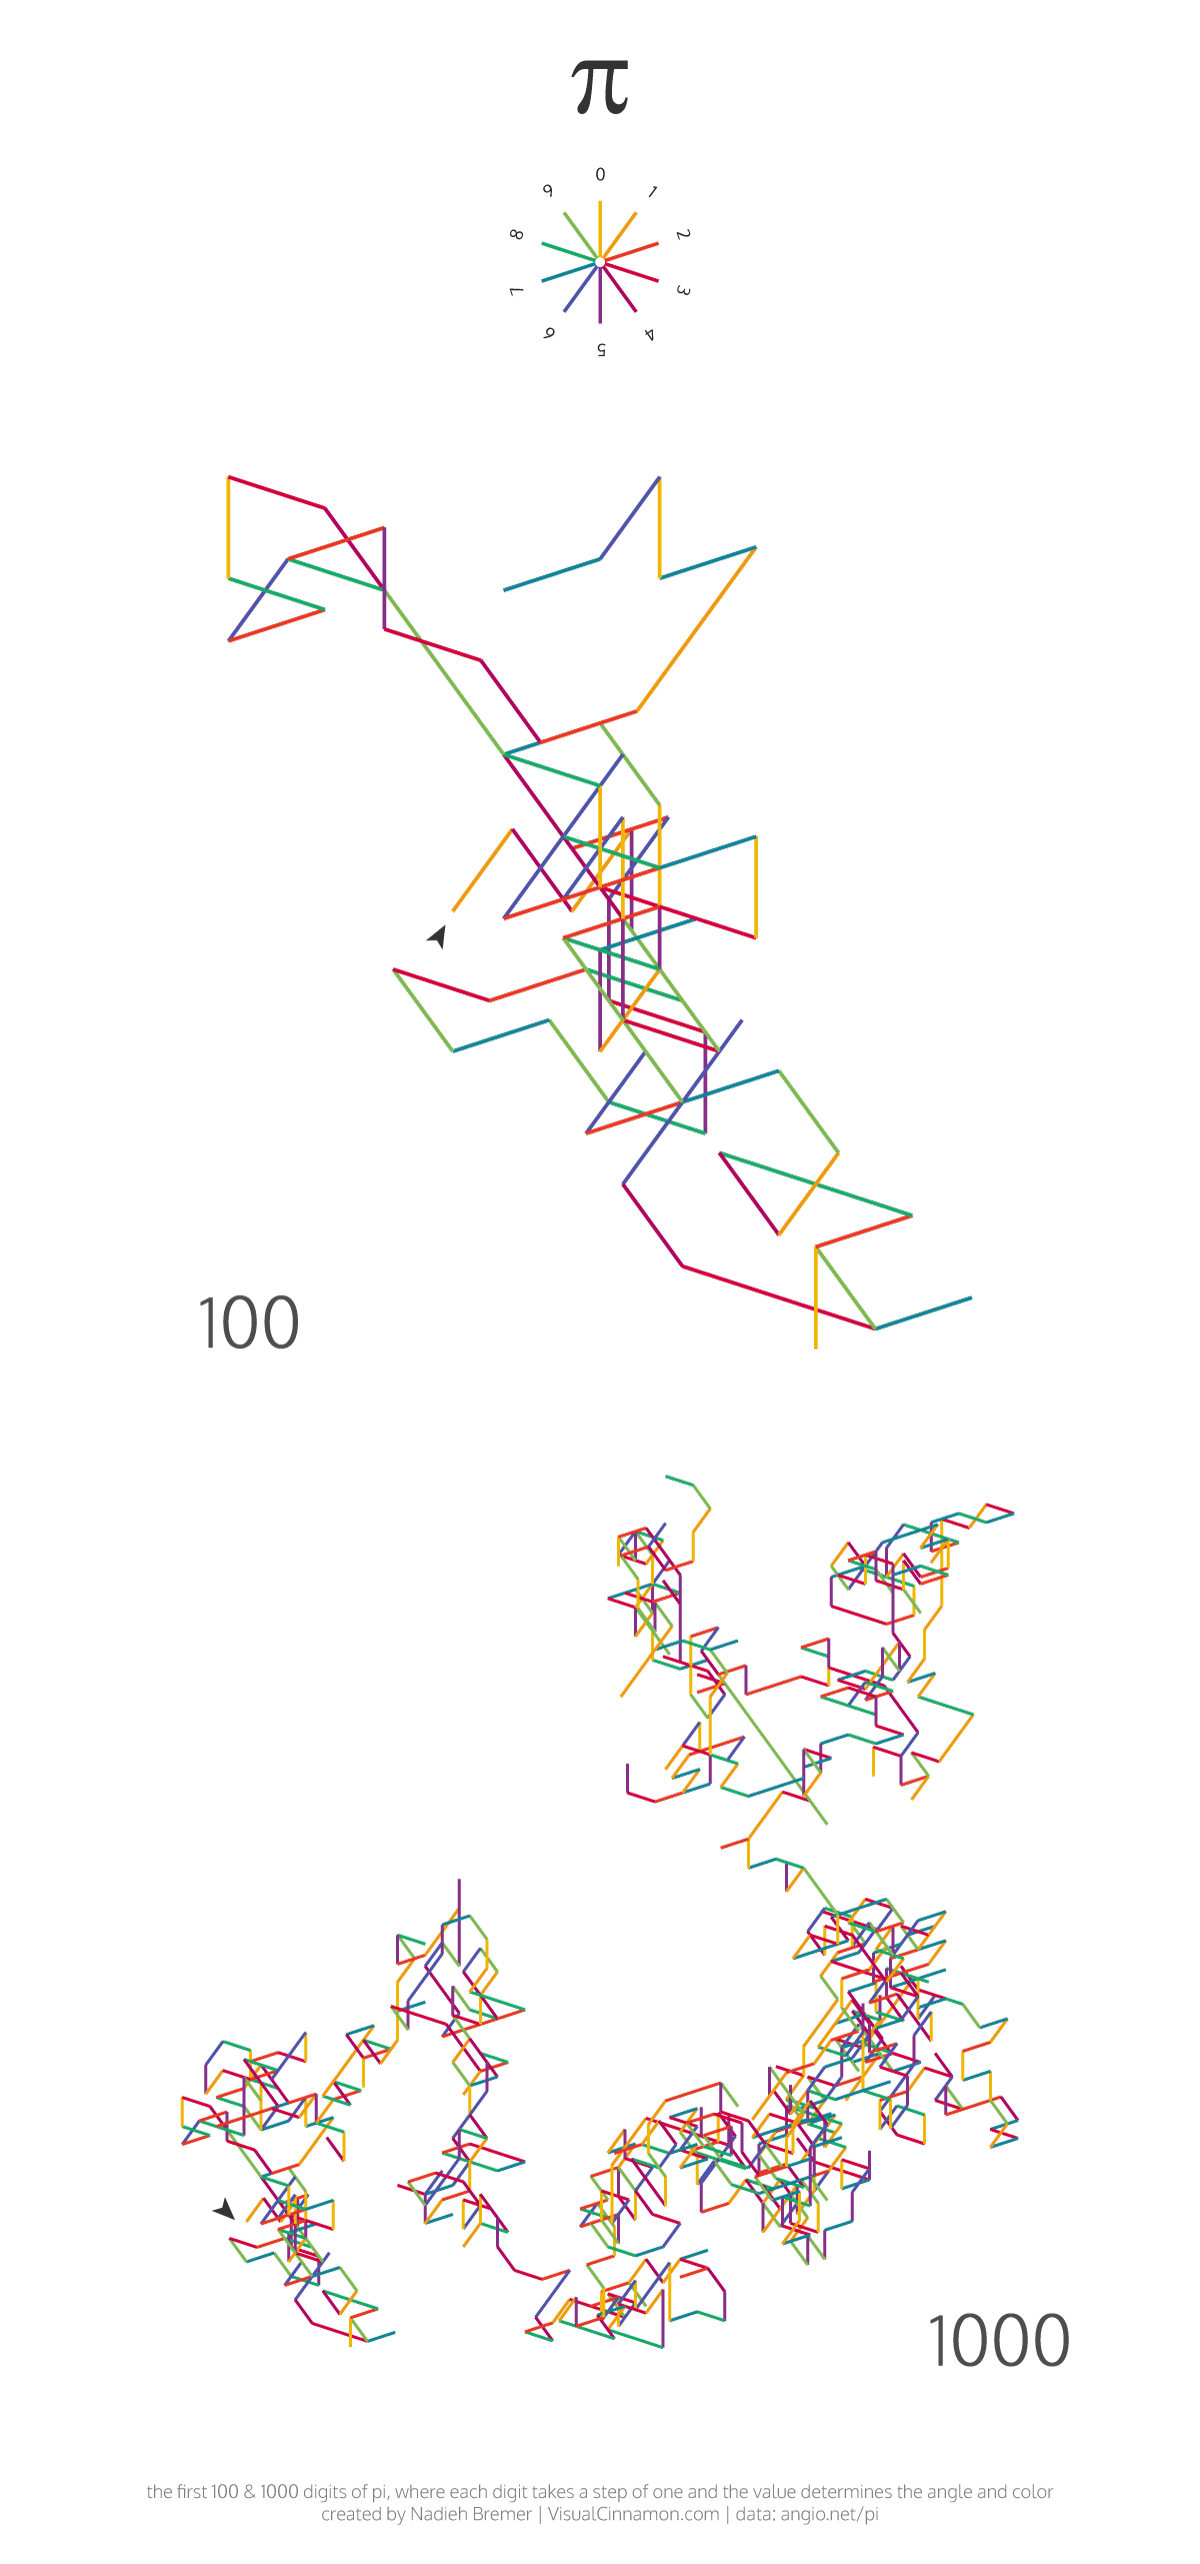
The first 1000 digits
Using the digits I could create steps in a 2D field where the direction is defined by the number. Starting from the 3 at (0,0), the first step would be 36 degrees from the zero, which I defined to be straight up. sSe the legend in the image below for a visual explanation.
In The Logic of Chance (1888), the mathematician John Venn suggested that the digits 0 to 7 represent eight compass directions, and he followed the path tracked by these digits in pi.
Although this idea has been around for quite some time, I just wanted to play around with it myself. I colored the lines according to the step direction, but experimented a lot with different color palettes and background colors. Most of the examples I saw used a black background which really gives the colors a pop. Eventually I decided to stick with a no-frills white background and a more classic rainbow color palette, since being able to tell all the colors apart exactly isn’t really the purpose. And besides you can use the angle to read of the value of the digit.
I used R to calculate all the positions, ggplot2 to visualize the resulting path and colors, exported this to a pdf and finished it in Illustrator with a legend and combining plots into one.
Beyond 1000 digits
For the orders of 10,000 and bigger the above approach wasn’t creating interesting results anymore because the walked path became so much bigger than the length of one step. Therefore the result for 10,000 digits looked like a colorful pixel explosion.
Also I became more interested in seeing how the numbers walked from start to finish than the digits themselves. Therefore I reused the color scale from the image above but now let it spread out over all the digits used.
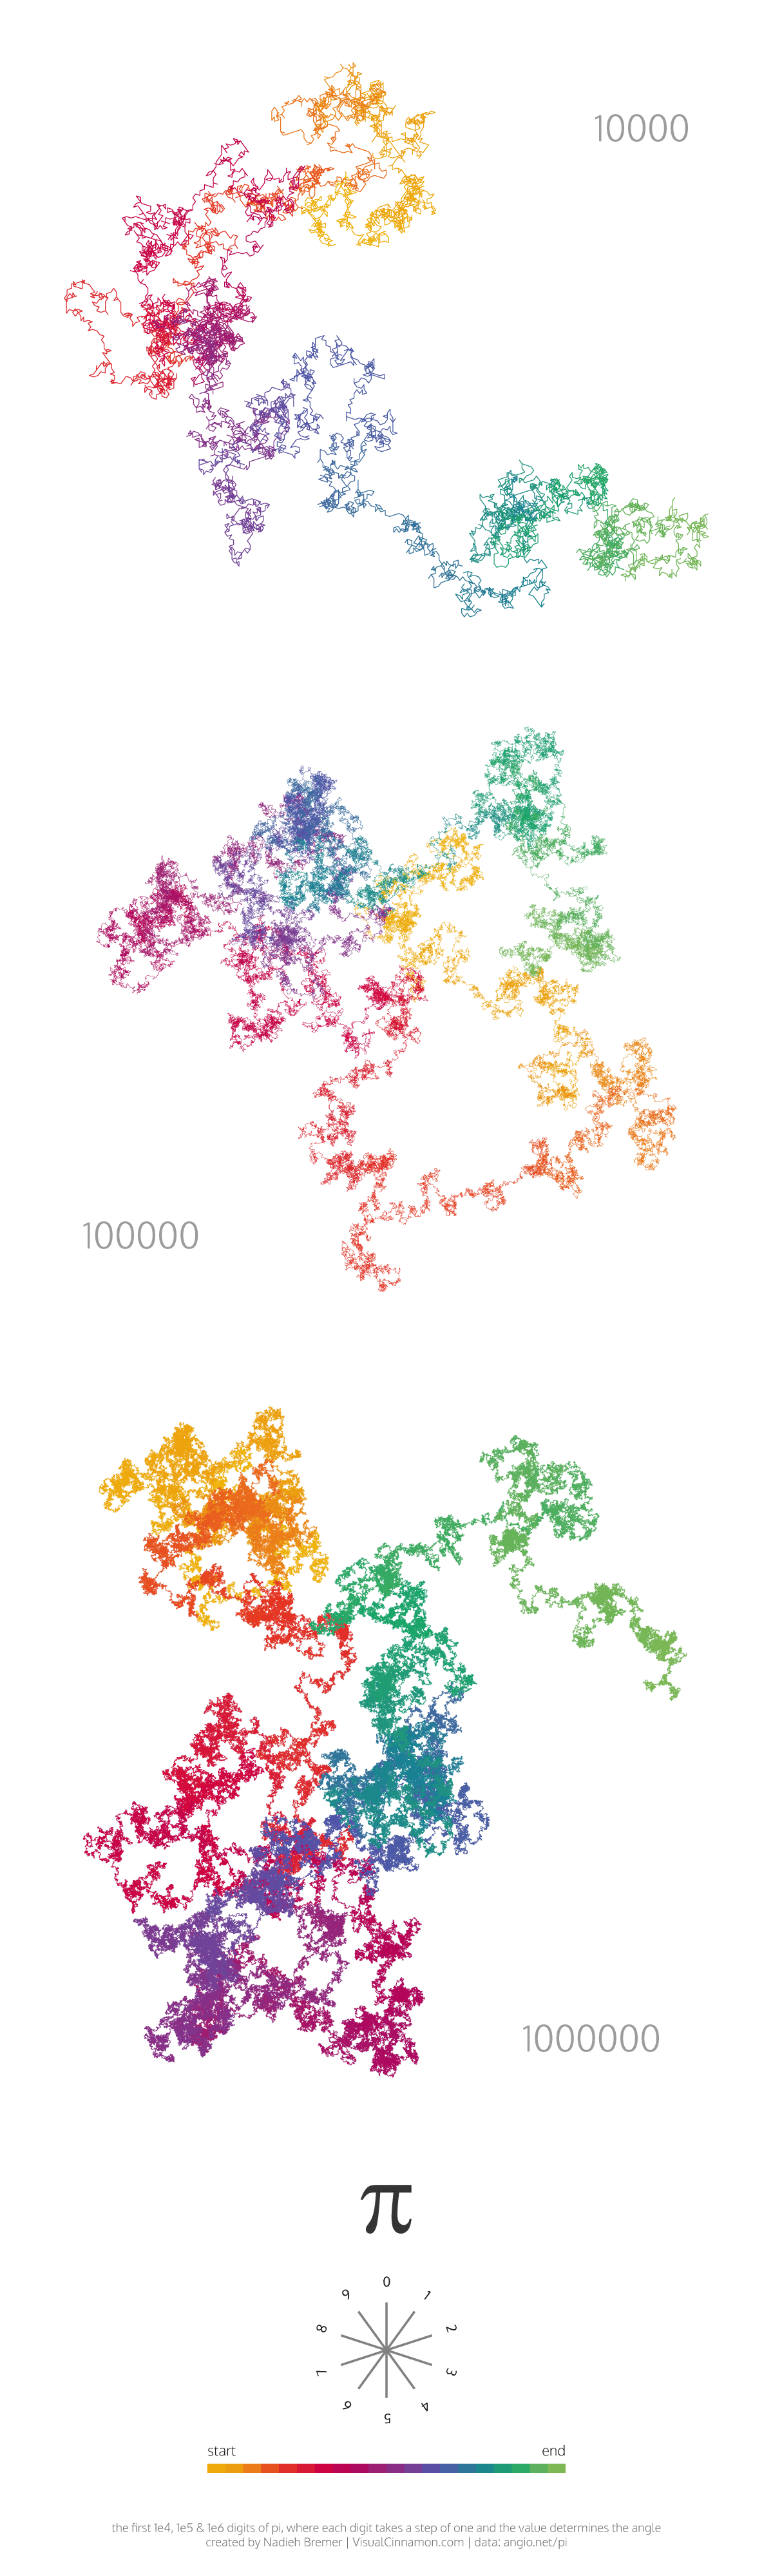
Although R and ggplot could still handle the million digits plot, Illustrator wasn’t able to read any of the vector based outputs I created in R, so I just had to be content with a rather big jpeg.
I find it very interesting to see how the shape of, say, 1000 digits gives you no clue how the shape of one order bigger is going to look, seeing the randomness of π visualized.
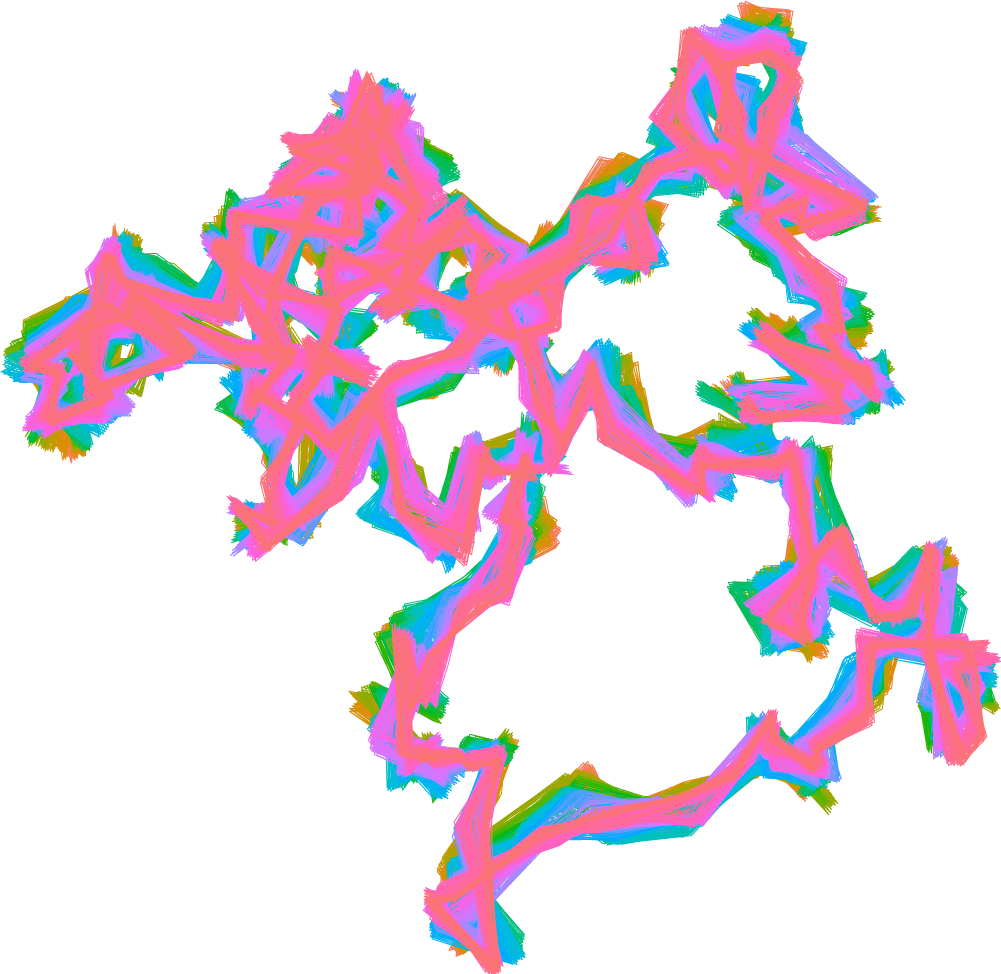
The Art in errors
Of course some of my first plots in ggplot weren’t doing what I thought they should. However, some of these resulted in nice looking images nonetheless, like the one below. Here I wanted to color the lines according to the digit number, but instead I ended up creating 10 different lines where each line connects the digit locations of one specific digit
More examples of art created with pi can be found on the Pi-day coverage of the Guardian and you can find the R script to create the path and some images here.
You can buy prints of the different digit version in my Society6 store (ノ◕ヮ◕)ノ*:・゚✧