At the end of the year there are several traditions, like presents and Christmas trees. For me, and quite a few other Dutch people, there are two radio related traditions. In the week before Christmas my radio is almost always on to listen to Serious Request (a charity event), and from Christmas day to 23:59 on New Year’s Eve the radio is still on 24/7, but now to listen to the Top 2000.
The Top 2000 is an annual radio show of the Dutch station NPO Radio 2. It was first aired in 1999. During the week before the new year the 2000 most popular songs ever are played. This top 2000 is determined by internet votes of the listeners in the weeks prior to Christmas. I think I remembered hearing that this year they had received 3.3 million votes for songs. However, each person can vote for multiple songs (maximum of 20). Therefore, the number of people who voted is more likely to be around 300.000, if I assume an average of 10 songs per person, which is still about 2% of the Dutch population.
The data
While listening to the top 2000 songs counting down, I started wondering several things about the data. Some high ranking songs were completely new to me the first time is listened to the Top 2000 a few years back. Therefore, I wondered how different the Top 2000 would be when only looking at voters from my age range?
This year I decided to try and find some data about the Top 2000 list. Although the Radio 2 site has a Facts and Figures section, this only contains some top 10 lists (and no visuals either). Luckily, they do have an Excel with artist, song title, the rankings of each year since 2014 and release year of the song.
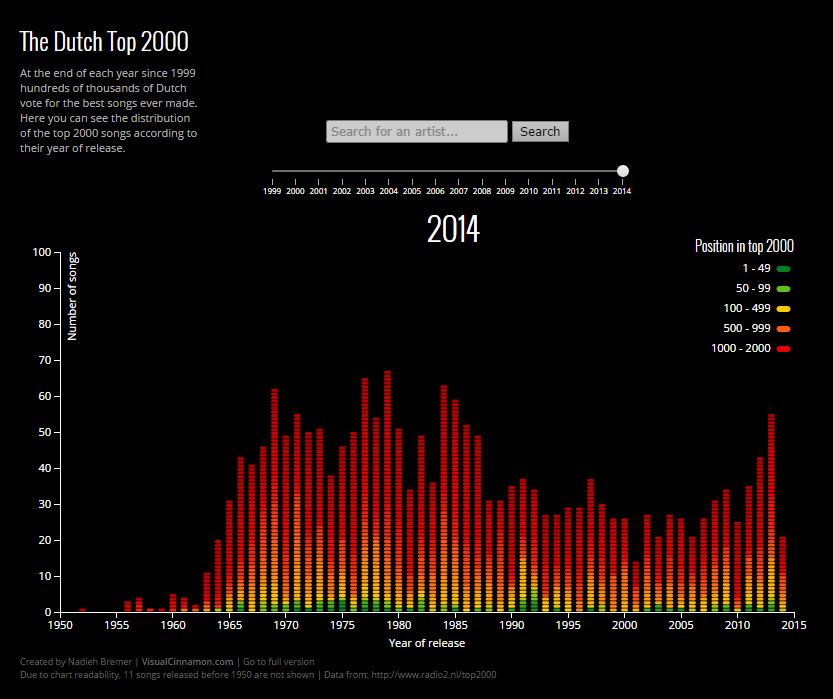
Without having to do any scraping of other databases to find more metadata about the songs, I could already start to answer one of my questions: How is the Top 2000 distributed across year of release?. Were there decades that produced an extremely high number of top 2000 songs? Decades that people would rather forget? (I had a hunch which those might be)
The equalizer style
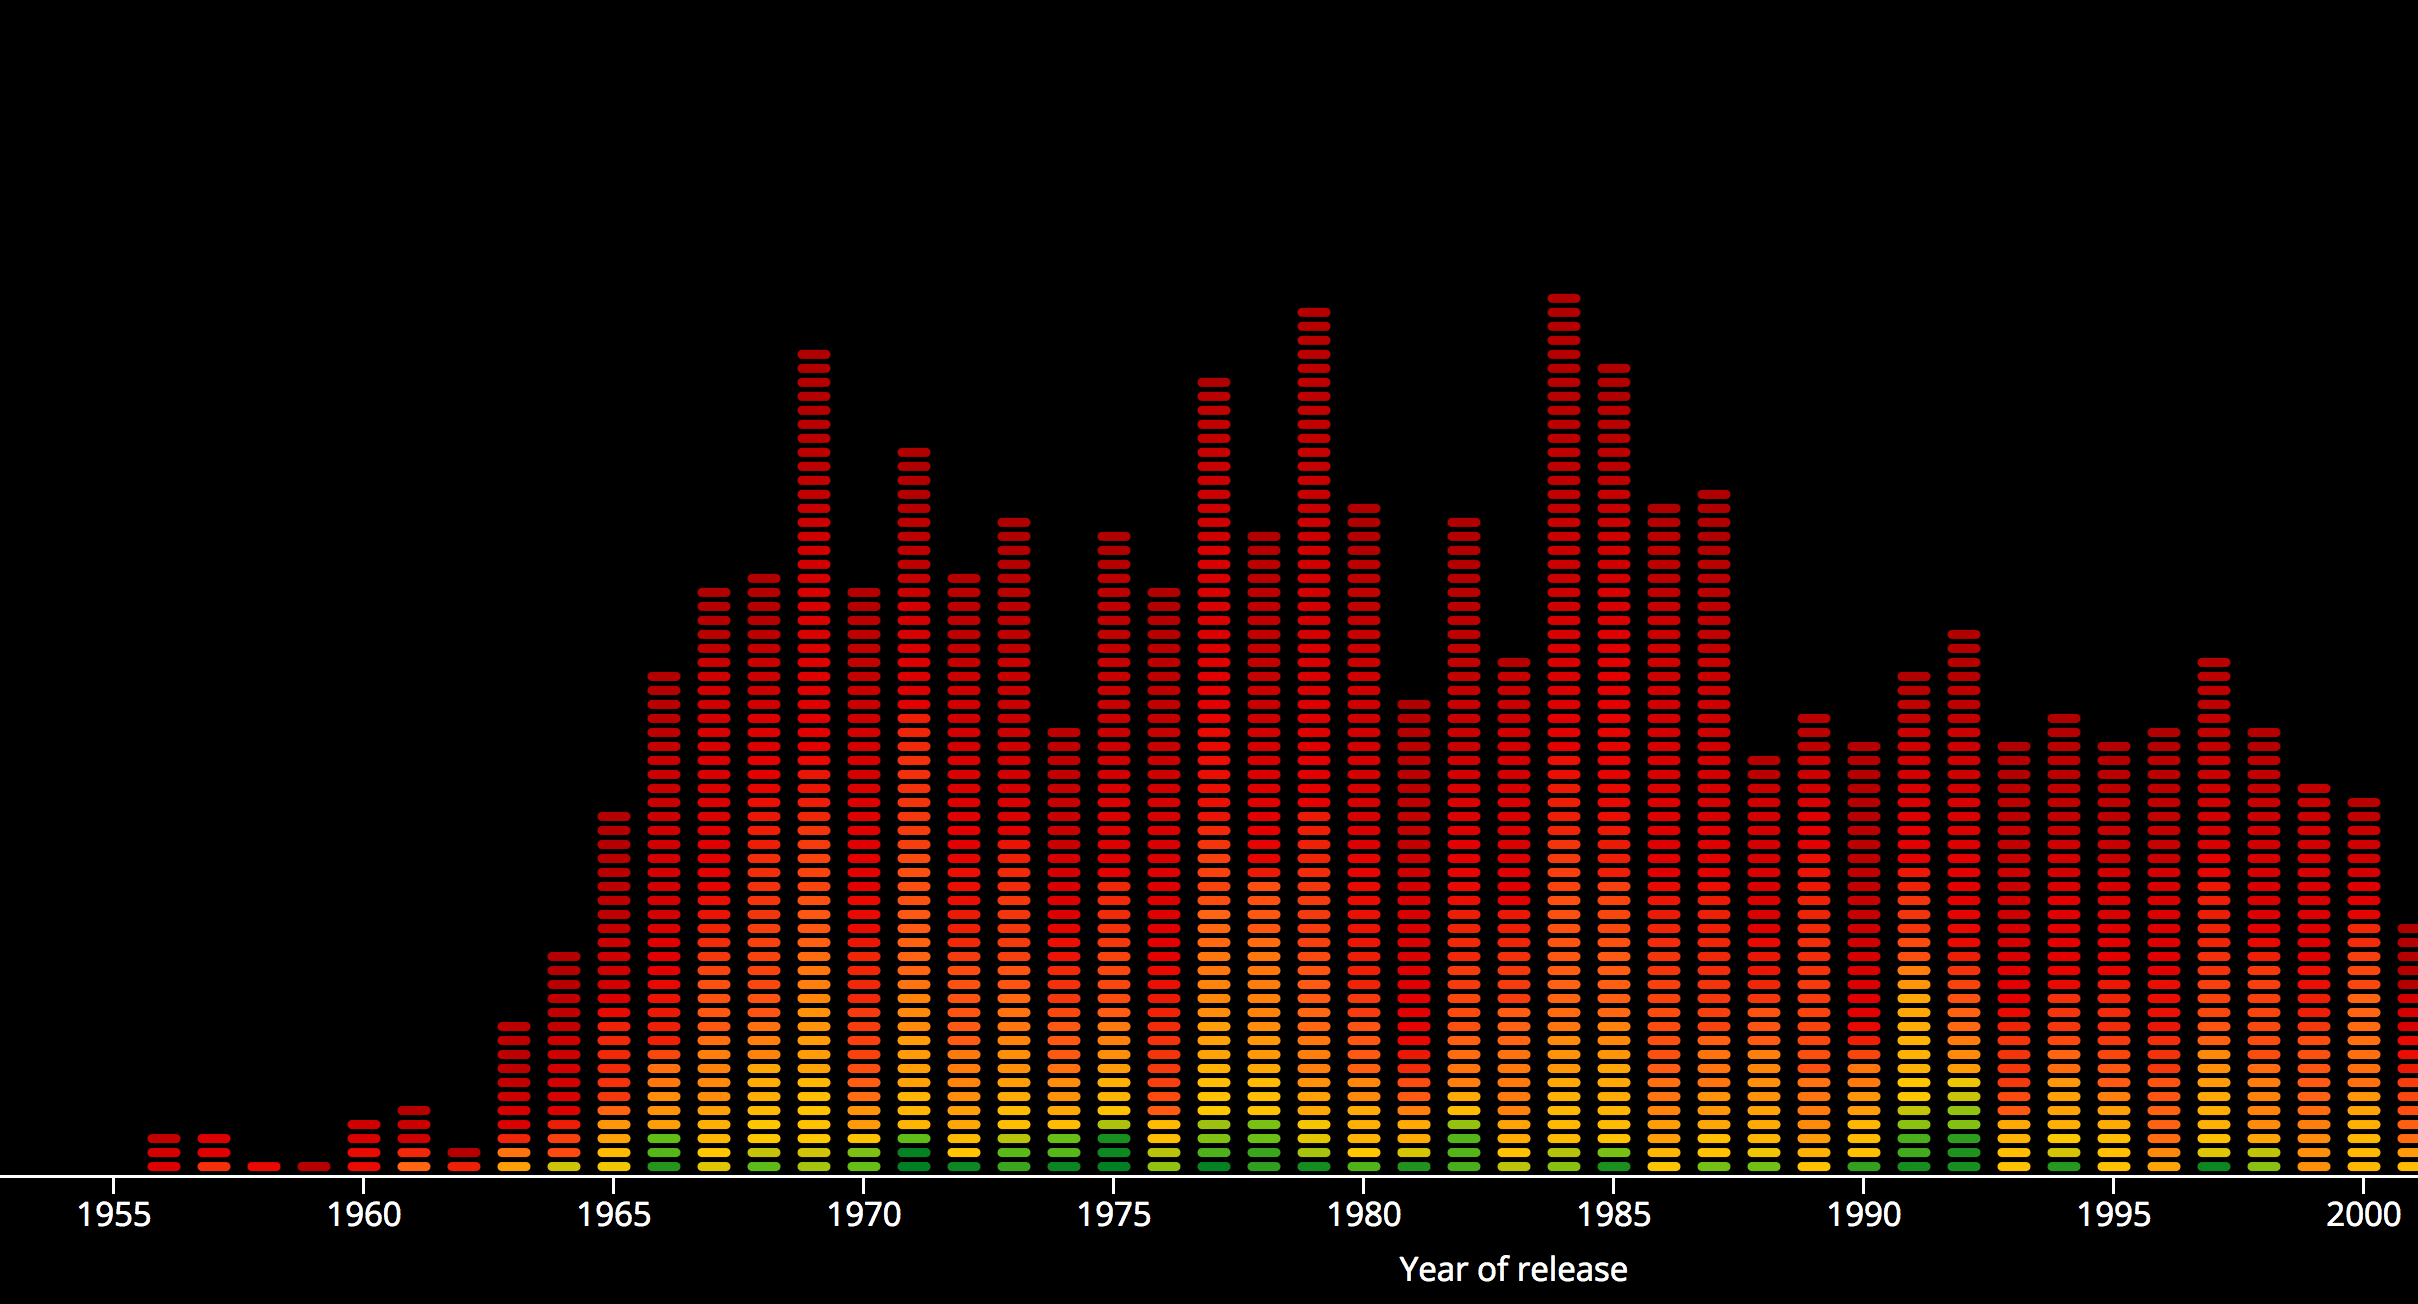
While thinking about creating the distribution bar chart, I thought it might be fun to try and create the bar chart as an equalizer, where each song would be one rectangle of a bar. After a quick online search I couldn’t find any d3.js example to start with, but then I realized that it wasn’t a bar chart at all, it should be seen as a scatter plot. I had to create an array to hold the height of each bar (release year) while d3 would loop through the data and plot them at the correct location.
//Keeps track of the height of each year
//startYear is the year of the oldest song while lastYear is 2014 in our case
//i.e. the min and max of the x axis
years = d3.range(startYear,lastYear).map(function(d,i) {
    return {
        year: d,
        number: 1    //Starting height of each bar
    };
});
Then another small function to calculate the height of each rectangle
//Calculate height of each rectangle
function locateY(d) {
    var yearLoc = d.release - startYear;
    var topping = years[yearLoc].number;
    years[yearLoc].number += 1;
    return y(topping);     //here y() is the d3 scale for the y-axis
}// function locateY
And finally create the rectangles (the snippet below is the essence)
//Initiate all rectangles
svg.selectAll("rect")
    .data(data)
    .enter().append("rect")
    .attr("width", rectWidth)
    .attr("height", rectHeight)
    //d.release is the release year
    .attr("x", function(d) { return (x(d.release) - rectWidth/2); })
    .attr("y", function(d) {return locateY(d);});
where I used two standard scales for a scatterplot template
var y = d3.scale.linear().range([height, 0]);
var x = d3.scale.linear().range([0, width]);
I have to admit that I was quite surprised that it actually worked (and within an hour or two!). What took me quite a few hours more was adding the interactivity, highlighting, tooltip, adding more years (and being able to slide through the years) and search functionality. But of course, I learned new things again
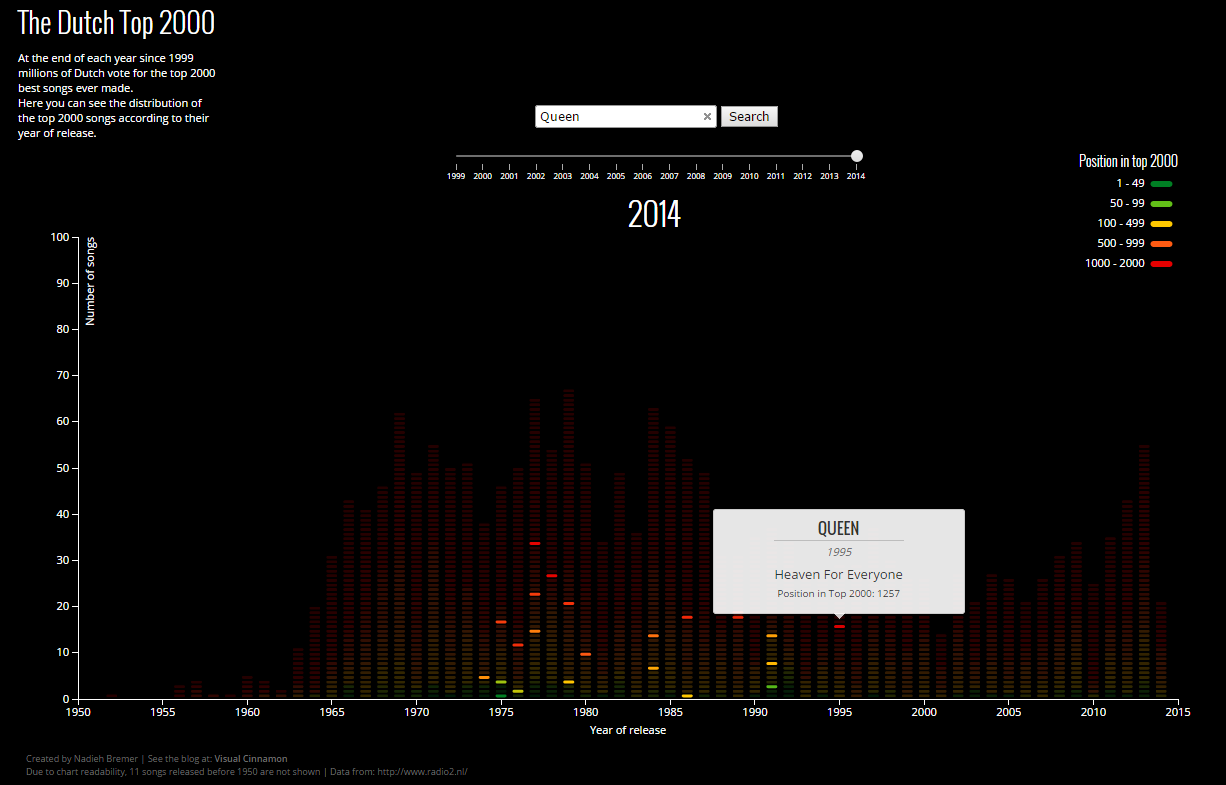
I think the transition between years should be faster. I put in a delay per element, so it feels similar to how an equalizer works, building the bars up, but at some point decreasing the duration of the transition or length of delay didn’t have any visually noticeable effect any more.
Mobile versus desktop
Because the slider didn’t really give a good UX on a mobile I made an adjustment so the visual only loads the latest dataset, when it is viewed on a handheld device. The slider is replaced by a note saying that you can view other years when visiting the webpage from a pc/laptop. I tried making the chart somewhat adjust to screen size. Not sure how well that works though (it is still not really meant for mobile screens).
The results
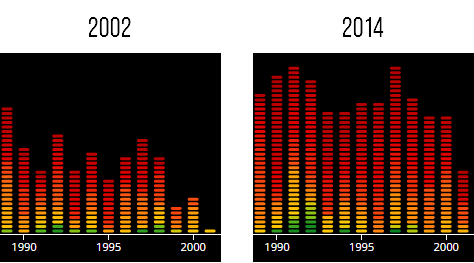
As I had suspected, the 90’s were not good for music. It doesn’t matter which year you pick, the 90’s show a dip. I had only just learned how to read during that decade and was into the Spice Girls, but I remember that the teenagers were into gabber music. According to the Urban Dictionary this is hardcore techno originating out of Rotterdam. All I will say is that I was happy that I started high school after the 90’s
Strangely enough, the closer you get to 2014, the higher the number of top 2000 songs from the 90’s. Maybe people are getting nostalgic, a new generation is voting? However, I do not remember seeing any “gabber” related songs in the 2014 list ¯\(°_o)/¯
Luckily there seems to be an upward trend since 2000 if you look at the results from the 10’s. Thanks to artists such as Coldplay and Adele. It appears that the years around 1970 had to pay the most for the songs made after 2000 in the 2014 list. Nonetheless, the 70’s do show the highest concentration of very high scoring songs (seen in green colors). The complete 2014 top 4 is from the 70’s actually.
Full version
As always, I advise you to check out the full version here. It just looks better on full screen 。◕‿◕。
I wish I could get my hands on the raw data of 3.3 million votes, because I have a lot more things I would want to know, haha (networks, correlations, etc.) Well, maybe I can first try to scrape and join another database to add more metadata (have a fun idea if I can get date of release instead of year), but I have my doubts if I can find a database that also includes all of the (obscure) Dutch songs…