Just over a year ago I posted a blog about the Gooey effect that makes it seem as if things (SVGs) start sticking together once they come close to each other. As if they are water droplets merging together. For my preparation for the “SVGs beyond mere shapes” talk I returned to the gooey effect and in this blog I’d like to teach you a few more techniques to take full use of the power of the gooey.
SVGs beyond mere shapes blog series
This blog is part of the SVGs beyond mere shapes tutorial series. It’s based on the similar named talk. My goal with the talk was to inspire people to experiment with the norm, to create new ways of making a visual more effective or fun. Even for a subject as narrow as SVG filters and gradients, there are more things possible than you might think. From SVG gradients that can be based on data, dynamic, animated gradients and more, to SVG filters for creating glow, gooey, and fuzzy effects. You can find links to all the other blogs in my kick-off article here.
Two different versions
In the original blog, I talked about the gooey filter code where in the last step you place the original SVG shape back on top of the blurred version. This makes sure that your shapes will always retain the size that they originally had, which can be very important in data visualizations. However, it does make the gooey filter slightly less beautiful when you are merging different colors.
It was Lucas Bebber who came up with this effect and some very cool demos in this blog. I’m just taking the code and seeing what I can do with it in data visualization.
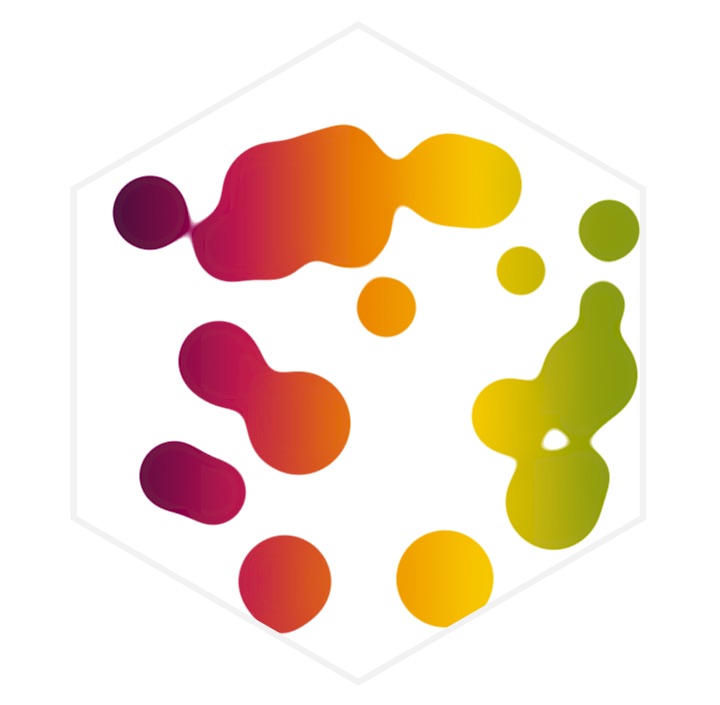
In the image above you can see the effect of applying the full gooey code below to the SVG circles. We still see perfect circles and, in between two circles that are close together, there is a gooey bridge that has a blended color.
//SVG filter for the gooey effect
//Based on http://tympanus.net/codrops/2015/03/10/creative-gooey-effects/
var filter = svg.append("defs")
    .append("filter")
    //use a unique id to reference again later on
    .attr("id","gooeyCodeFilter");

//Append multiple "pieces" to the filter
filter.append("feGaussianBlur")
    .attr("in","SourceGraphic")
    .attr("stdDeviation","10")
    .attr("color-interpolation-filters","sRGB")
    .attr("result","blur");
filter.append("feColorMatrix")
    //the class used later to transition the gooey effect
    .attr("class","blurValues")
    .attr("in","blur")
    .attr("mode","matrix")
    .attr("values","1 0 0 0 0  0 1 0 0 0  0 0 1 0 0  0 0 0 19 -9")
    .attr("result","gooey");

//If you want the end shapes to be exactly the same size as without
//the filter add the feBlend below. However this will result in a
//less beautiful gooey effect
filter.append("feBlend")
    .attr("in","SourceGraphic")
    .attr("in2","gooey");

//Instead of the feBlend, you can do feComposite. This will also
//place a sharp image on top. But it will result in smaller circles
filter.append("feComposite")
feBlend
    .attr("in","SourceGraphic")
    .attr("in2","gooey")
    .attr("operator","atop");

//Apply the filter to the group element of all the circles
var circleWrapper = svg.append("g")
    .style("filter", "url(#gooeyCodeFilter)");
You can see a moving version of here.
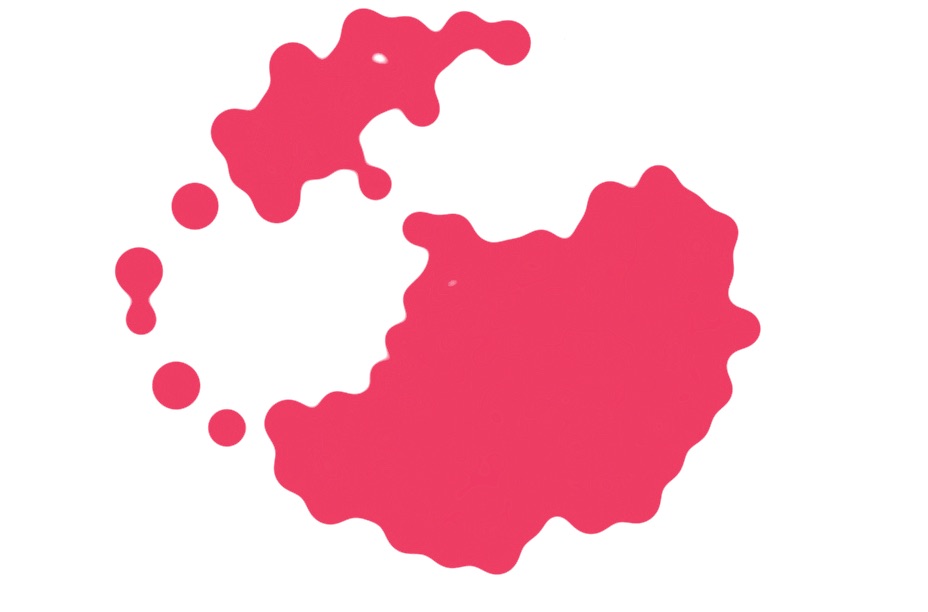
On the other hand, if you comment out the last filter step, the 3 lines about feBlend, then the original shape is not appended back on top of the blurred version and we see the colors blending together nicely.
Vanishing circles
Because it can be hard to see in the moving versions of the circles above, I’ve made two animated gifs to show the effect of shrinking circles when you do not apply the last feBlend step of the filter. In the two gifs below I am turning on and off the filter effect. If you look closely the change in shape is stronger the smaller the circle is.

And if the circles are getting too small, they get a strange aura around them or disappear entirely.
However, you can tweak at what size this happens by playing around with the last two numbers in the feColorMatrix step. The 19 -9 define how strong the gooey effect will be. The stronger the gooey merging, the greater the size difference if you do not apply the last feBlend step.
Gooey collision detection
Play around with the interactive version here. It is a bit heavy on the CPU though.
You might have cases where it’s not important that the circles remain at their exact sizes. For example, the wonderful collision detection example from Mike Bostock can be turned into a fun Gooey version. It suddenly feels as if you’re playing around with water droplets, or the green stuff from Robin Williams’ movie Flubber. The end result looks best if we do not apply the feBlend step and in this, mostly fun, case, that’s fine.
Gooey in data visualization
The examples above might have been fun to look at or play with, but they are not true data visualizations. The first time I used the gooey effect myself was for the Swing Analytics project. In this project golf swings are simulated and fly out from a center point with the gooey effect.
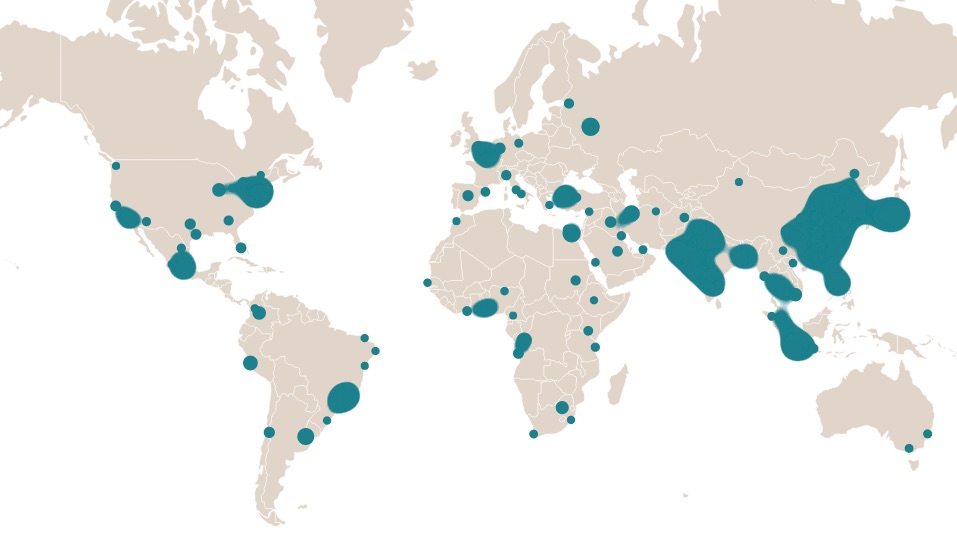
Below you can see a tiny version of 2 data visualization ideas that I showed during the “SVG Beyond mere Shapes” presentation. We start off with an empty map and a big blue center circle. Next 150 smaller circles will start to fly out of the center circle, with a gooey effect applied. The circles represent the 150 largest cities in the world and each circle is placed on its geographical location and sized to its population. When the transition of the circles, flying to their endpoint, is finished, the gooey effect is slowly turned down so that you cannot see its effects anymore. The opacity of the circles is turned down a bit for a nicer result.
Once the circles are all at their end position they move in together again using d3’s force layout. All the circles are clustered on their countries. Instead of showing the circles all separately, the gooey effect is slowly turned on again so that the circles mush together into 1 blob that represents the country. A few seconds later the circles move in towards the center location and it all starts over.
However, in this looping showcase, I have to turn off the gooey effect when the circles end up on their geographic locations. Otherwise, the circles will still blend together and you get the result below
Luckily, I can use the attrTween function to adjust the values of the matrix in the feColorMatrix section of the gooey filter. By bringing the before-last number down, the gooey effect becomes less and less visible.
While the circles are flying outward I reduce the effect of the gooey effect so that, once all of the circles are at their final locations, the circles are not blending together anymore. See my previous blog on the motion-blur effect for a longer explanation of what is happening in the code below.
//"Remove" or dim the gooey filter from cities during the transition
//So at the end, they do not appear to blend together anymore
//Don't forget to add a class of blurValues to the feColorMatrix code section
d3.selectAll(".blurValues")
    .transition().duration(4000)
    .attrTween("values", function() {
        return d3.interpolateString("1 0 0 0 0  0 1 0 0 0  0 0 1 0 0  0 0 0 18 -5",
                                    "1 0 0 0 0  0 1 0 0 0  0 0 1 0 0  0 0 0 6 -5");
    });
I do the reverse for the section where the circles group together into country blobs. During the movement, I turn the gooey effect back on again.
//Turn the gooey filter "back on" on the cities during the transition
//So at the end, they we have country blobs
d3.selectAll(".blurValues")
    .transition().duration(2000)
    .attrTween("values", function() {
        return d3.interpolateString("1 0 0 0 0  0 1 0 0 0  0 0 1 0 0  0 0 0 6 -5",
                                    "1 0 0 0 0  0 1 0 0 0  0 0 1 0 0  0 0 0 35 -6");
    });
The results would be even better if you could somehow attach a gooey filter to each element separately. But due to the nature of the filter, it has to be applied to the group element in which all of the circles lie. Nonetheless, you can get some interesting and fun results already
The Code & (even more) examples
Here are direct links to all of the examples above nicely gathered together
- The hexagon with gooey circles moving inside
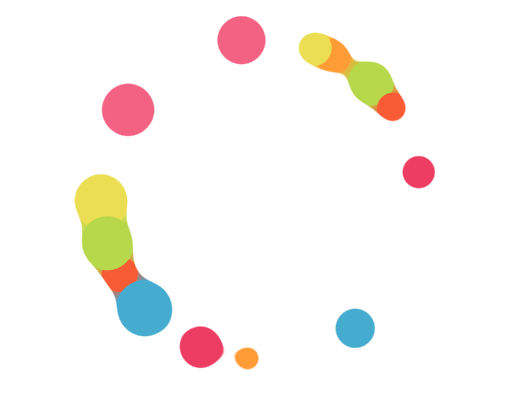
- Rotating circles without color blending but with true sizes
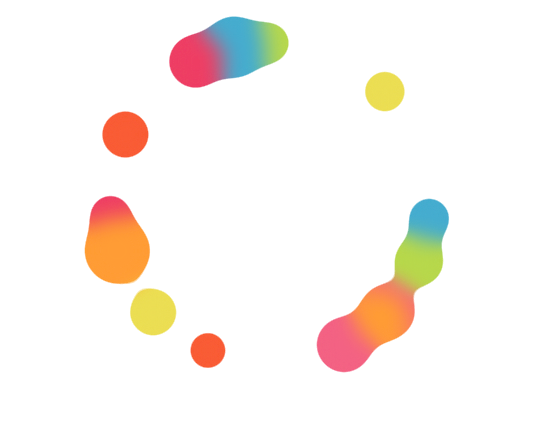
- Rotating circles with color blending but slightly smaller sizes due to filter
- Gooey collision detection
- Data Visualization Showcase with the 150 largest cities
Links to other gooey bl.ocks that I have
- Swing analytics - In the 3rd view the swings will be displayed using the gooey effect.
- Movement along a line
- Moving in and out of a circle
- Falling in and out of a rectangle
And I’m not the only one who’s been having fun with the Gooey effect. Here are more wonderful bl.ocks showcasing the Gooey
- Gooey circle effect with colors
- Gooey spinner trippy - Done with d3.js & react - especially fun once the spinners move out of sync
- Gooey Phyllotaxis Dance
I hope all of these new gooey examples will give you a better understanding of the effect itself and more inspiration on how to incorporate the effect into your data visualizations to make them even more fun to watch!
SVGs beyond mere shapes blog series
If you’re interested in seeing more examples of how SVG gradients or SVG filters can be used to make your data visualization more effective, engaging or fun, check out the other ±10 blogs that are available. You can find links to all of the blogs in my kick-off article here.