Today it’s time for a short blog about a very subtle effect that can add a bit more pizzazz to your visualization. It’s definitely not something that will suit a business/no-nonsense chart. But then again, if you only make those kinds of charts, I feel that doing data visualization is definitely less enjoyable than if you try to have some fun with your creations every now and then. So let’s start by adding a bit of glow to our shapes!
SVGs beyond mere shapes blog series
This blog is part of the SVGs beyond mere shapes tutorial series. It’s based on the similar named talk. My goal with the talk was to inspire people to experiment with the norm, to create new ways of making a visual more effective or fun. Even for a subject as narrow as SVG filters and gradients, there are more things possible than you might think. From SVG gradients that can be based on data, dynamic, animated gradients and more, to SVG filters for creating glow, gooey, and fuzzy effects. You can find links to all the other blogs in my kick-off article here.
Redesigning a radar chart
Some people love radar charts, others hate them. I have to admit that I really like circular shaped graphics for their aesthetics, but I also understand that is is difficult to compare datapoints in most cases.
Nevertheless, several months ago I made a redesign of a radar chart for d3. Although I was happy with it the result in the “normal” version of the image below, I remembered coming across the code for a glow filter and thought it might make this a bit more engaging. So I applied the glow to the background axis circles and to the colored blobs to get the result shown on the right side.
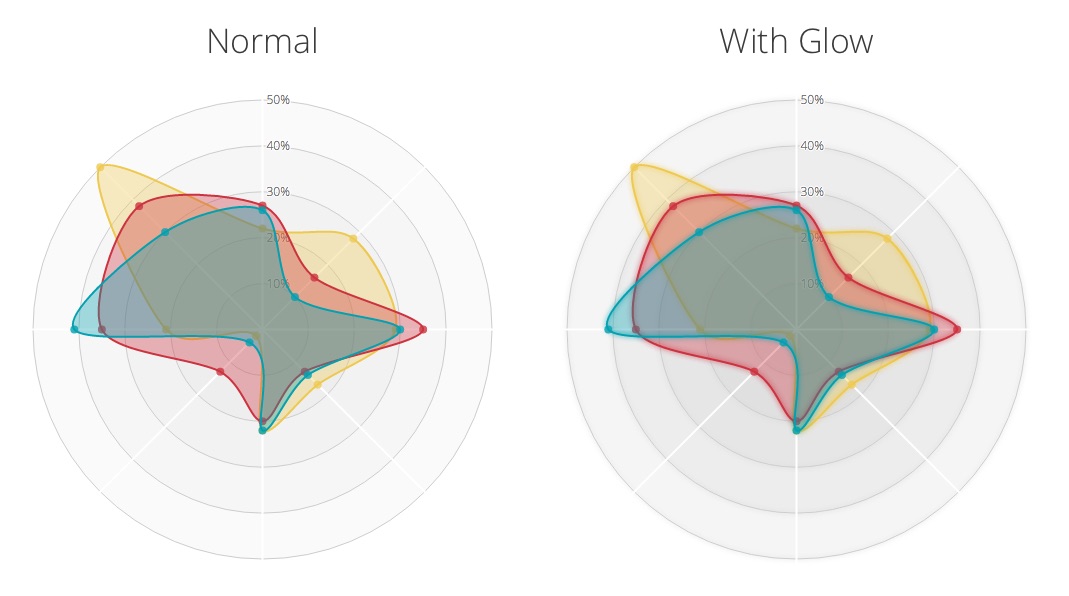
Not a major difference, you might not even like it. It really is a matter of personal tastes. But I felt it made the chart just a bit more engaging to look at.
Making it Glow
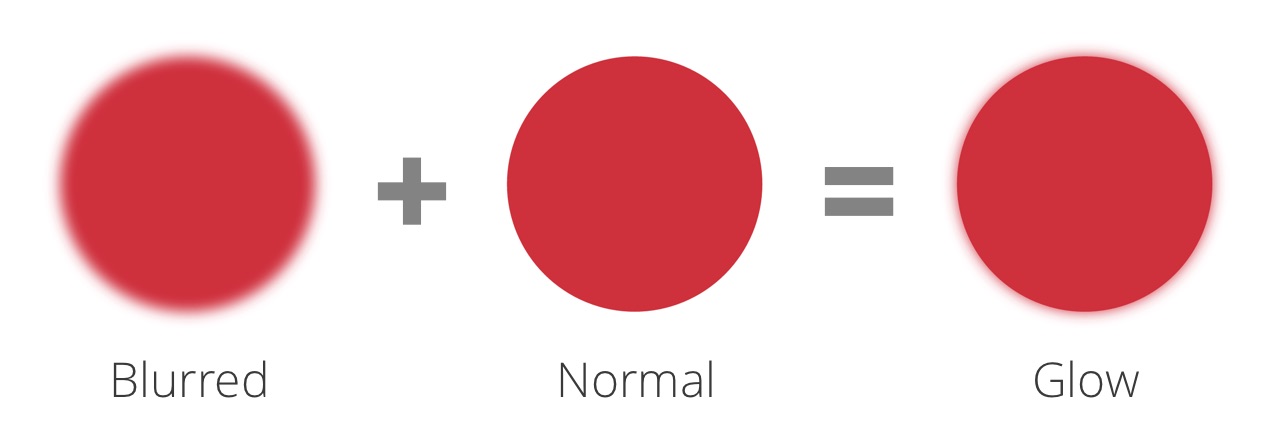
Adding some glow is exceptionally simple. If you want to, you can basically copy the code in the section below, paste it in your own code and refer to the filter’s id. You don’t have to change anything. But you can make the glow more spread out by increasing the value of the stdDeviation attribute, which stands for standard deviation.
//Container for the gradients
var defs = svg.append("defs");

//Filter for the outside glow
var filter = defs.append("filter")
    .attr("id","glow");
filter.append("feGaussianBlur")
    .attr("stdDeviation","3.5")
    .attr("result","coloredBlur");
var feMerge = filter.append("feMerge");
feMerge.append("feMergeNode")
    .attr("in","coloredBlur");
feMerge.append("feMergeNode")
    .attr("in","SourceGraphic");
To explain the code above. First, a defs element is appended to the SVG, which stands for definitions. It contains definitions of special elements such as gradients and filters. Next, append a filter element to the defs. Give it a unique id to reference it later when you want to set the glow to specific SVG elements.
If you want a bit more info on feMerge, look here.
And then comes the magic part of combining specific filters in a specific order to get something you never expected. Luckily this one is fairly simple to understand. You apply a blur to the element (on which you set the filter) with feGaussianBlur. The result of this blur is named coloredBlur using the result attribute. Next, an feMerge is used to place the (sharp) original element, called the SourceGraphic, on top of the slightly blurred coloredBlur version. This together creates the appearance of a glow around the element.
All that’s left to do is apply the filter to the element that should glow
//Apply to your element(s)
d3.selectAll(".class-of-elements")
    .style("filter", "url(#glow)");
I found the filter code on a stackOverflow answer by Drew Noakes. However, I can’t actually remember how I ended up there, except that I wasn’t looking directly for a glow. But nevertheless, I’m glad I came across it.
The glow works on rectangles, circles, paths. But as far as I can tell, it doesn’t seem to have an effect on lines, no matter how thick.
Below you can play around with the glow effect. Click anywhere around the three shapes to turn the glow filter on or off. Use the slider to adjust the spread of the glow (which adjusts the stdDeviation attribute of the feGaussianBlur).
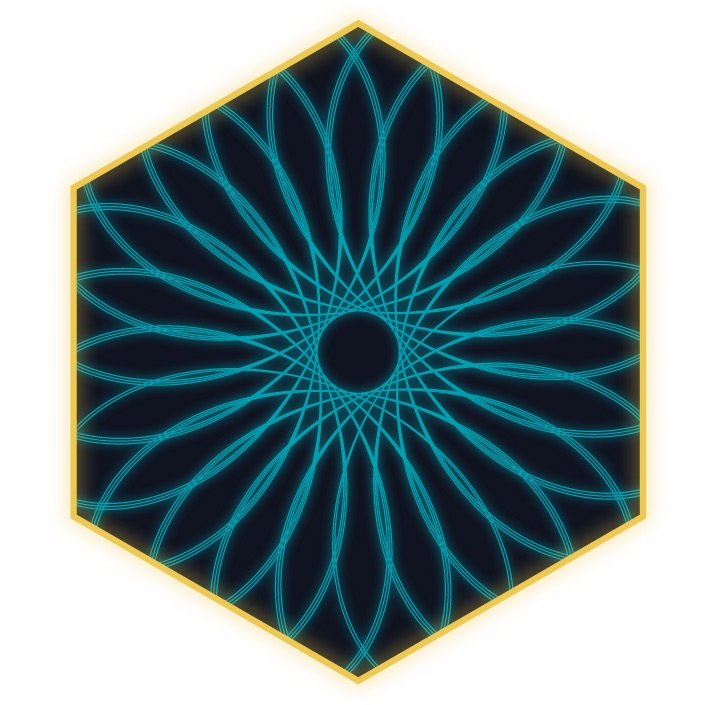
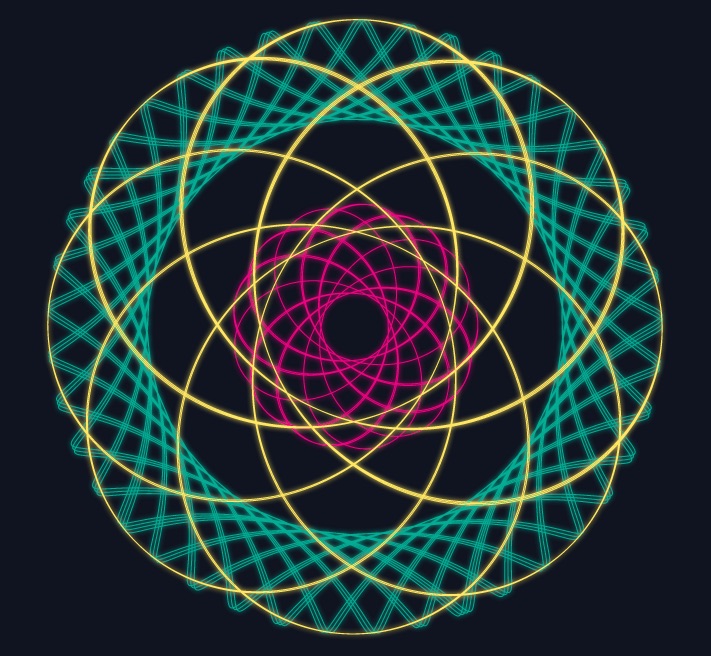
One of the examples that I found to look more fun, more neon, when a glow is added was a Spirograph project I created recently.
The Code
The code to the examples that have been used in the blog can be found here:
And that was it already! There really is nothing more to the glow effect. You just have to create the filter and apply it. Try it on some of your charts, you might be amazed to see which ones turn out to become a bit more interesting (ノ◕ヮ◕)ノ*:・゚✧
SVGs beyond mere shapes blog series
If you’re interested in seeing more examples of how SVG gradients or SVG filters can be used to make your data visualization more effective, engaging or fun, check out the other ±10 blogs that are available. You can find links to all of the blogs in my kick-off article here.