In this blog, I’ll show you how to add a color gradient to the chords of a d3.js Chord Diagram. This comes in handy when there is no net difference in the chords. But you can apply the technique to any gradient that you want to orient based on data. We’re going to look at the collaborations between Avengers. With all those cameo’s happening in the MCU, I wanted to know how often two Avengers had appeared in a movie together. This results in a symmetrical dataset since, if Thor appeared in a movie together with Hawkeye, the reverse is true as well.
Another example can be found in a tutorial I wrote several months ago on how to use it as a circular flow diagram.
Chord Diagrams are meant to show flows, where the flow from category A to B is usually not the same as the flow from B to A. In the default setting, all chords are given the color of the category that had a bigger net flow. However, Chord Diagrams can be used to visualize other datasets besides asymmetrical flows. In the case of symmetrical flows/connections, it would be more fair if the chord is colored to represent both categories.
SVGs beyond mere shapes blog series
This blog is part of the SVGs beyond mere shapes tutorial series. It’s based on the similar named talk. My goal with the talk was to inspire people to experiment with the norm, to create new ways of making a visual more effective or fun. Even for a subject as narrow as SVG filters and gradients, there are more things possible than you might think. From SVG gradients that can be based on data, dynamic, animated gradients and more, to SVG filters for creating glow, gooey, and fuzzy effects. You can find links to all the other blogs in my kick-off article here.
Chord diagrams for symmetric data
Some time ago somebody asked me to help them visualize a small dataset about collaborations. I can’t say more about the specific dataset, other than you could represent it as a symmetric matrix.
Long story short, I was first playing around with a Sankey, where each of the categories would be present on the left and the right and each line between the left and right side would represent the connection. But a symmetric matrix would result in each line being represented twice: the line from A (on the left) to B (on the right) would be the same as the line from B (on the left) to A (on the right).
So I tried to sketch a result where I eliminated the duplicate lines. To make that work I placed the categories in a circle, so each category would only be represented once. After the sketch was done, I found myself staring at a Chord Diagram layout.
Because of the symmetric nature of the dataset, none of the chords had a net difference. They were all the same thickness at the start as at the end. Therefore, coloring the entire chord to represent either the source or target category seemed wrong to me. Giving all the chords one color that was different to any of the categories (such as grey) seemed a bit boring. So I figured, why not place a gradient inside the chords to change from the source category to the target category color?
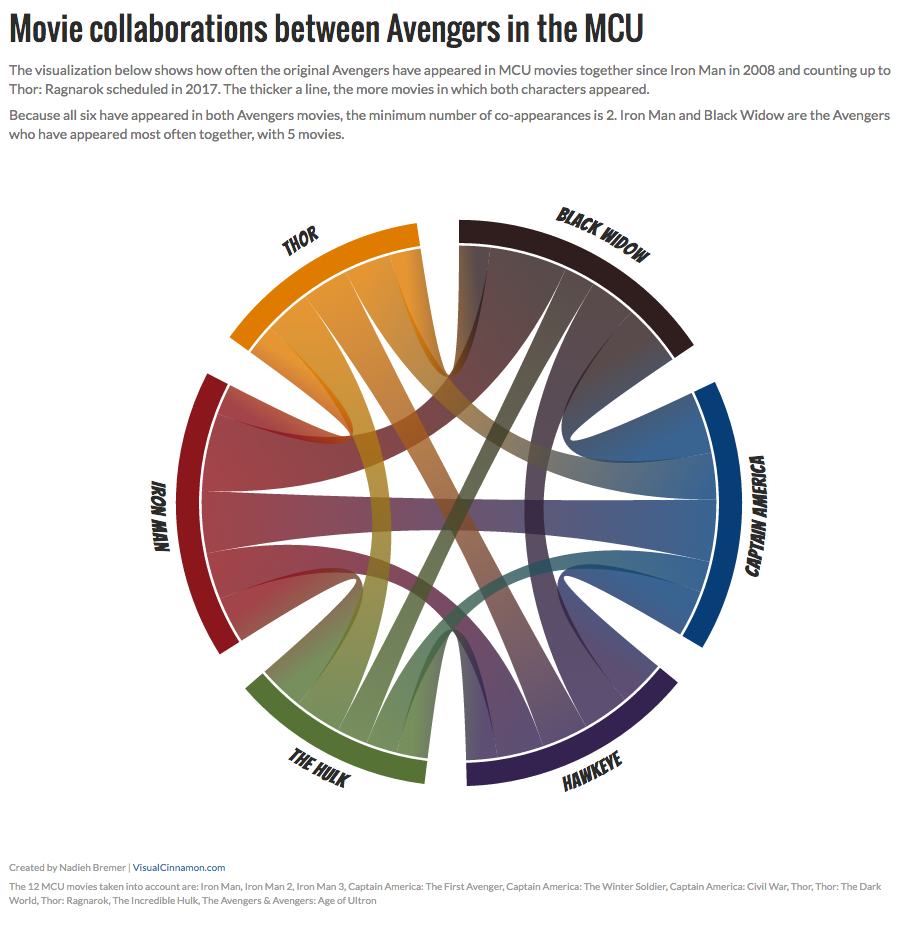
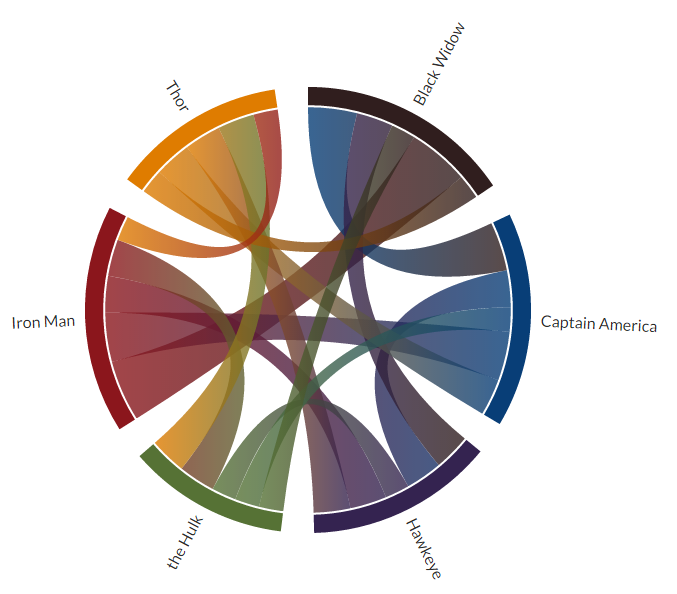
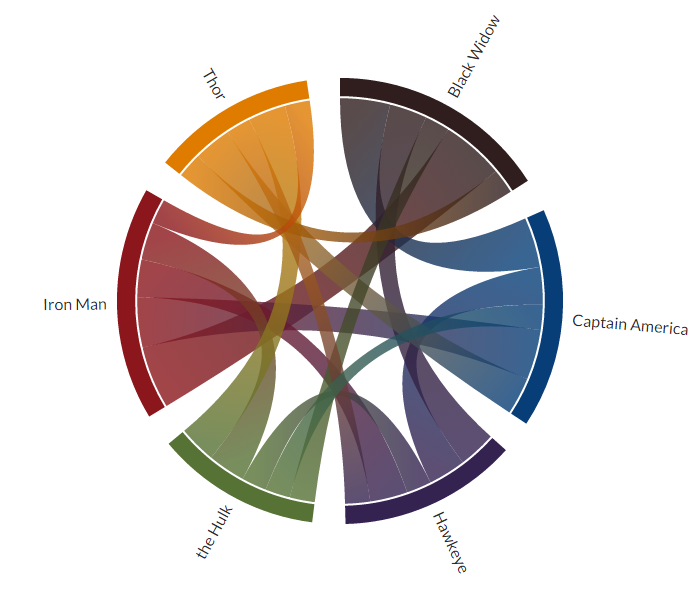
For the purpose of the tutorial I created a new dataset about movie collaborations between the original Avengers. How often have two characters appeared together in the same movie? Apparently, Iron Man and Black Widow have been in 5 movies together, whereas Iron Man and Thor have only appeared together in the 2 Avenger movies. (I apologize in advance if I’ve made a mistake in the data). The resulting visual below shows the idea that we’re going for in the tutorial.
Tutorial
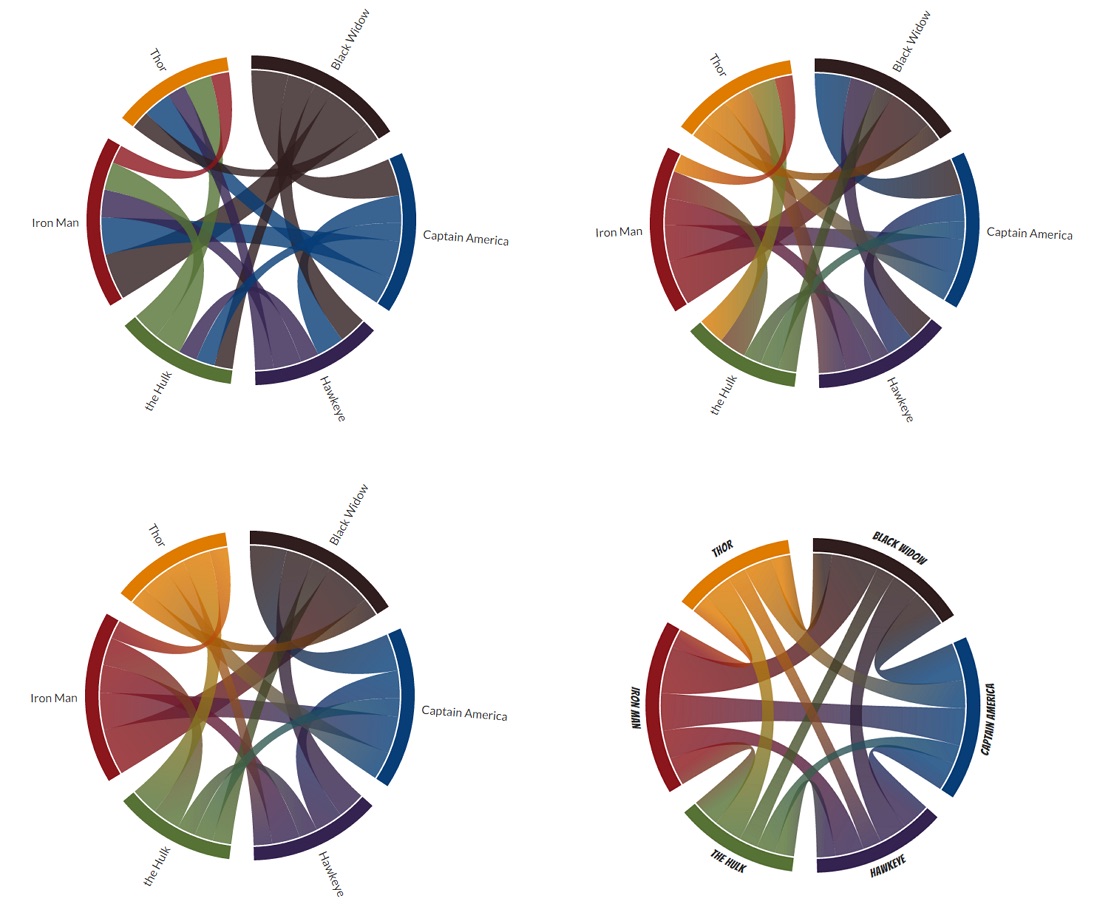
Let’s start with the tutorial. It’s only a few steps and the code that needs to be added is very straightforward and versatile; you can use it with a completely new dataset without changing anything (besides the color scale). The image below gives a quick overview of the result that we have after each step.
Starting from a normal Chord Diagram
Alright, let’s begin from the basic idea of a Chord Diagram. Below you can see the data that I created about the number of movie collaborations between the Avengers.
//The symmetric matrix about movie collaborations between the Avengers
var matrix = [
    [0,4,3,2,5,2], //Black Widow
    [4,0,3,2,4,3], //Captain America
    [3,3,0,2,3,3], //Hawkeye
    [2,2,2,0,3,3], //The Hulk
    [5,4,3,3,0,2], //Iron Man
    [2,3,3,3,2,0], //Thor
];
As you can see, the diagonal is zero. No real use in looking at the number of movies in which “Iron Man appeared together with Iron Man”. You can find the resulting Chord Diagram below.
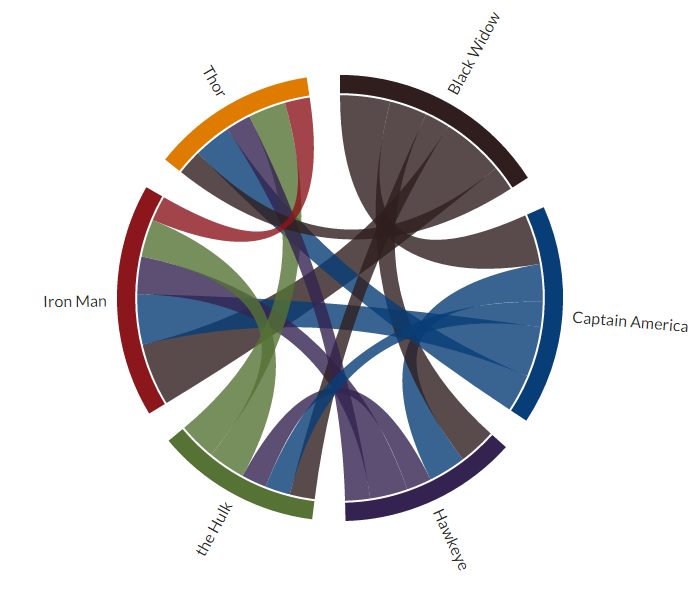
I tried to color each Avenger to some base color of their appearance. Since Iron Man is already red, Captain America blue and grey is a bit boring I made Thor a golden color (the hair) and I made Hawkeye purple because he’s exceptionally purple in the comics even though he isn’t in the movie, but Black Widow already claimed black(ish).
I feel the image above really shows there is still a lot to improve with the current chord coloring scheme (and the chord ordering as well).
Adding color gradients to the chords
I first started looking online to see if anybody had done it already. I came across an excellent answer on StackOverflow by AmeliaBR (I can almost say, “who else”) about adding a color gradient to a Sankey Diagram. The Guardian had a nice article using many gradient colored Sankey diagrams. However, in a Chord Diagram, most chords don’t run nicely from left to right. They can run in all angles and the source does not always lie to the left of the target.
Directly applying the idea of the StackOverflow answer to a Chord Diagram results in the image below. It is a start, but the colors are definitely not always running along the chord correctly.
I’ll explain later why the gradient still isn’t 100% perfect, but for most cases you won’t really notice that it isn’t perfect.
I managed to adjust the code to make it much more suited for chords running in any direction. The idea remains the same. To make the fill of each chord change colors between its source and target arc/category, we need to fill it with a gradient, an SVG linear gradient to be exact. In a previous post on linear SVG gradients, you can find more about the details, so I’ll only focus on the parts in which our new gradients will differ from a default one.
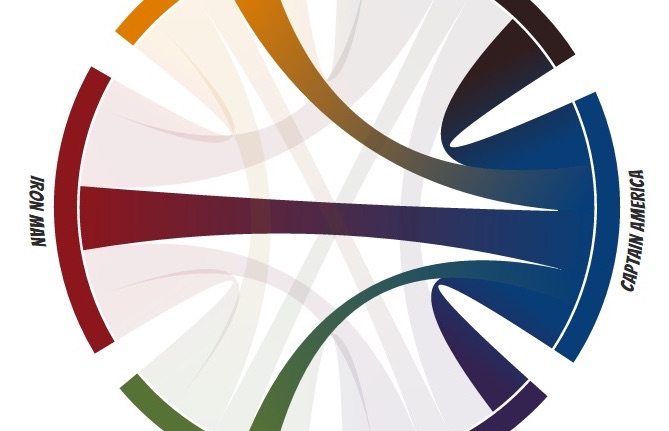
In the image below, I’ve made the chords of Black Widow more apparent and I’ve already applied a sorting of the chords to reduce the overlap (which is discussed at the end of this blog). This creates a cleaner image to explain.
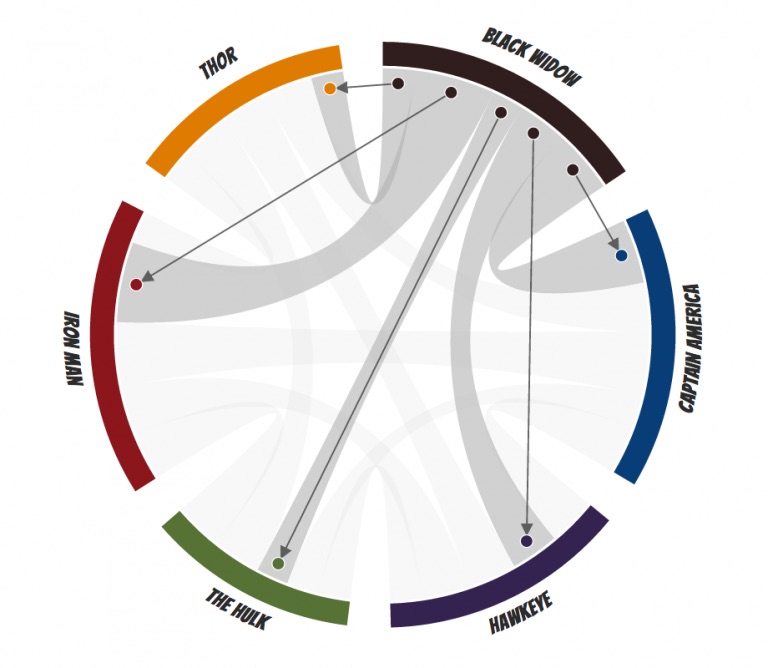
These five chords each need to get their own gradient. They have to run along the direction given by the arrows and should change color from Black Widow’s purplish-black to the color of the Avenger at the other end.
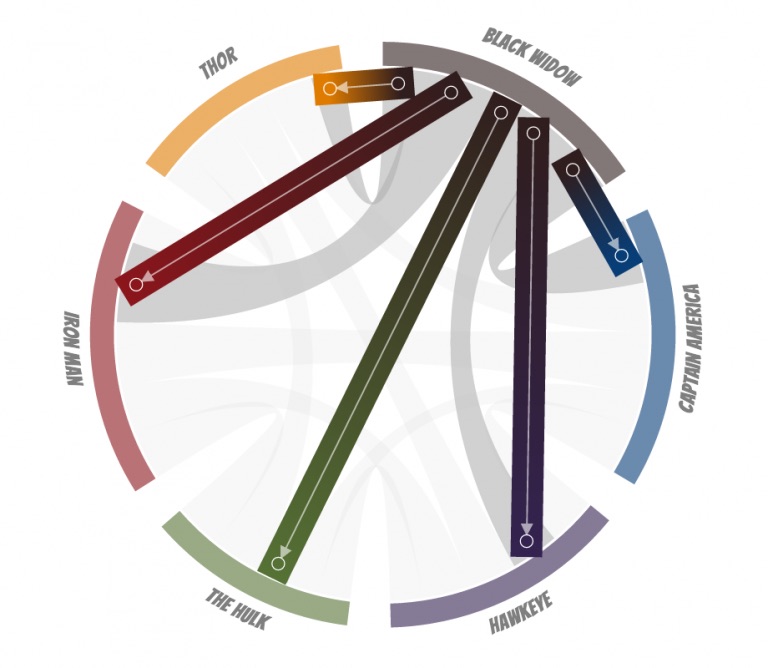
In essence, if I were to apply simple rectangles between the starting point and ending point and fill it with the desired gradient you would get something like the image below. It’s these gradients that we’re going to create with the help of a bit of trigonometry. But now you can also see why these gradients aren’t perfect. They do not follow the arc of the chord but run in a straight line from the start to end. But thankfully you don’t really notice it all that much in the end result.
Let’s start with the code that has to be added. First, we need to initialize a gradient for each chord. For this, we need the chord dataset that is created by d3 when you supply the data matrix (from the code section above) to d3.layout.chord. The variable that you get back (often called chord) contains some very useful extra information; the start and end angle of each chord end. Also good to know that one chord end is called the source and the other is called target.
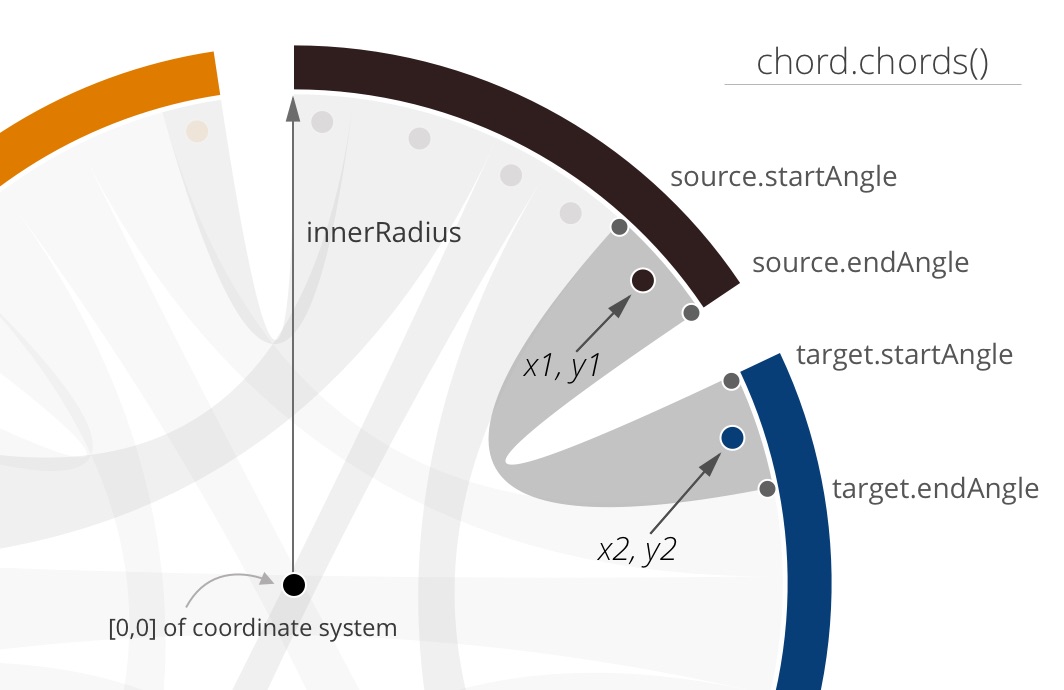
In a typical Chord Diagram, a g element is added to the SVG that is translated so the [0,0] location lies in the center of the circle. This actually makes it relatively easy to calculate the exact x and y locations of the start and end of each gradient using sine and cosine functions. From the basics of the Chord Diagram, I also already know the radius, it’s fixed at the start of the script in the variable innerRadius.
In the image below I’ve tried to make the information more clear for one particular chord. Eventually, we want to set the [x1,y1] to the location halfway in between the source.startAngle and source.endAngle (which is available in the chord.chords() variable). The gradient should run to [x2,y2] which lies halfway in between target.startAngle and target.endAngle.
These are all the ingredients we need to create gradients where we use exact pixel locations to define the directional arrow with the x1, y1, x2 and y2 attributes (the invisible arrow between these two locations) instead of percentages.
The blue dot lies in the center of the startAngle and endAngle of the target side of a chord. The angle of the blue dot, which I’ll call centerAngle, is therefore
//Center angle of the target
var t = chords.target;
t.centerAngle = (t.endAngle - t.startAngle)/2 + t.startAngle;
The x and y location (seen from the center 0,0 location) of the blue dot can then be found by using the sine and cosine laws and the centerAngle
//Getting the exact locations of blue dot
t.x = innerRadius * Math.cos( t.centerAngle );
t.y = innerRadius * Math.sin( t.centerAngle );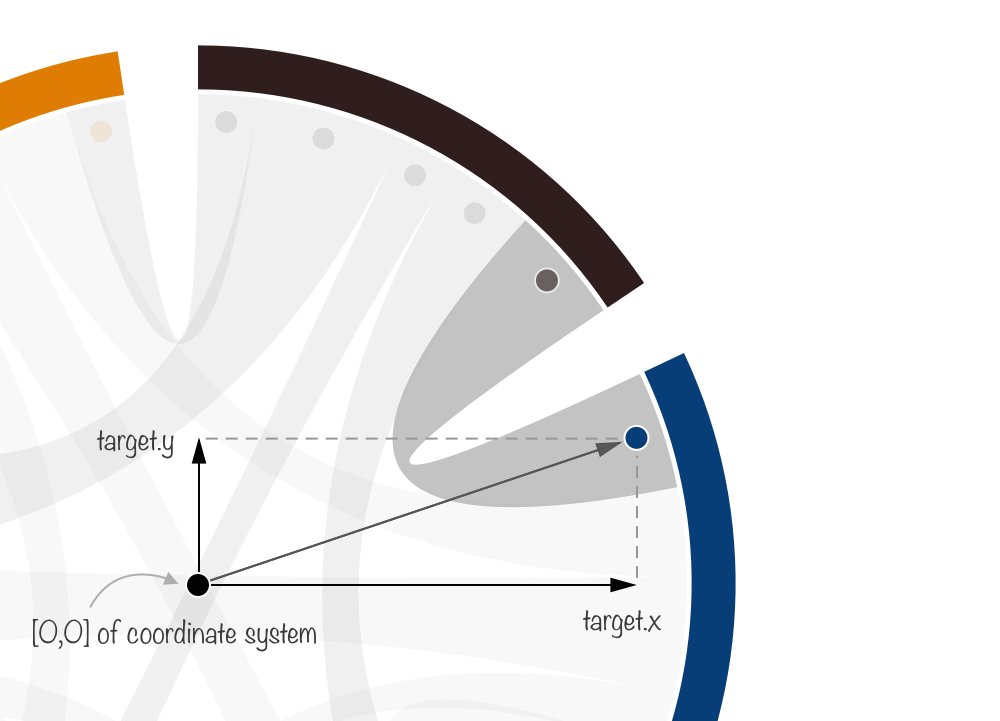
That was the essence of what should be done. However, because d3 angles start at the top we also need to subtract a quarter of a circle, or Math.PI/2 to make it work the way we want to. I hope that was a somewhat clear explanation of why you end up with the following calculation for the x2 attribute (the other location attributes follow the same idea).
x2 = innerRadius * Math.cos((d.target.endAngle-d.target.startAngle)/2 +
     d.target.startAngle - Math.PI/2)
Below you can see the actual code that you need to add to the script to initialize a unique gradient for each chord.
//Create a gradient definition for each chord
var grads = svg.append("defs").selectAll("linearGradient")
    .data(chord.chords())
    .enter().append("linearGradient")
    //Create a unique gradient id per chord: e.g. "chordGradient-0-4"
    .attr("id", function(d) {
        return "chordGradient-" + d.source.index + "-" + d.target.index;
    })
    //Instead of the object bounding box, use the entire SVG for setting locations
    //in pixel locations instead of percentages (which is more typical)
    .attr("gradientUnits", "userSpaceOnUse")
    //The full mathematical formula to find the x and y locations
    //of the Avenger's source chord
    .attr("x1", function(d,i) {
        return innerRadius*Math.cos((d.source.endAngle-d.source.startAngle)/2 +
        d.source.startAngle-Math.PI/2);
    })
    .attr("y1", function(d,i) {
        return innerRadius*Math.sin((d.source.endAngle-d.source.startAngle)/2 +
        d.source.startAngle-Math.PI/2);
    })
    //Find the location of the target Avenger's chord
    .attr("x2", function(d,i) {
        return innerRadius*Math.cos((d.target.endAngle-d.target.startAngle)/2 +
        d.target.startAngle-Math.PI/2);
    })
    .attr("y2", function(d,i) {
        return innerRadius*Math.sin((d.target.endAngle-d.target.startAngle)/2 +
        d.target.startAngle-Math.PI/2);
    })
As always, it’s very important to create a unique id for each gradient so it can be referenced later while you set the fill of the chords. The thing that makes each chord unique is its combination of the source.index and target.index (each Avenger has its own index), thus we’ve set the gradient id to be a combination of these two variables.
For a more complete explanation of gradientUnits, please look here.
One other line that I skipped is also very important. The attribute gradientUnits has to be set to userSpaceOnUse. This makes sure that the x and y locations refer to the coordinate system of the g element (since our x and y attributes were calculated in this general coordinate system) and not the bounding box of the SVG element to which the gradient will be applied.
Now that the directions of the gradients are set, we still need to add a color stop for the start and end of each gradient (at 0% and 100% location). This is fairly easy. Create a variable that holds the colors for each of the arcs/Avengers and use source.index for the 0% color and target.index for the 100% color
var Names = ["Black Widow","Captain America","Hawkeye","the Hulk","Iron Man","Thor"],
    colors = ["#301E1E", "#083E77", "#342350", "#567235", "#8B161C", "#DF7C00"];

//Set the starting color (at 0%)
grads.append("stop")
    .attr("offset", "0%")
    .attr("stop-color", function(d){ return colors[d.source.index]; });

//Set the ending color (at 100%)
grads.append("stop")
    .attr("offset", "100%")
    .attr("stop-color", function(d){ return colors[d.target.index]; });
Finally, in the original Chord Diagram code, only 1 line needs to be adjusted. The fill of each chord has to reference the unique id that belongs to the SVG gradient with the same source and target numbers
svg.selectAll("path.chord")
    .data(chord.chords)
    .enter().append("path")
    .attr("class", "chord")
    //Change the fill to reference the unique gradient ID
    //of the source-target combination
    .style("fill", function(d){
        return "url(#chordGradient-" + d.source.index + "-" + d.target.index + ")";
    })
    .style("opacity", 0.8)
    .attr("d", path);
Making these additions and adjustments to the code will lead to the result below (the link to a full working example is available in the last section).
Creating a better chord ordering
The result from above is the end of the tutorial on creating a color gradient in a Chord Diagram, but I felt it could use one more improvement: better ordering. Right now the chord between Thor and Iron Man runs over all the other chords from Thor. It would’ve been better of this chord was at the other side of Thor so it would actually not cross any other chords.
I want the chords to be ordered based on their index. However, you can only sort the chords based on their value (with sortSubgroups). And so, just like with my Circular Flow chart blog I had to go into the D3 source code and make some really minor adjustments and put it into a new function. You can find the d3.layout.chord.sort.js file here. All you have to do is add this file to your page and replace d3.layout.chord() with customChordLayout()
//Original way to call the chord layout
var chord = d3.layout.chord()
.padding(.15)
.sortChords(d3.descending)
.matrix(matrix);
//If you want a different chord ordering
//use the following script instead
var chord = customChordLayout()
.padding(.15)
.sortChords(d3.descending)
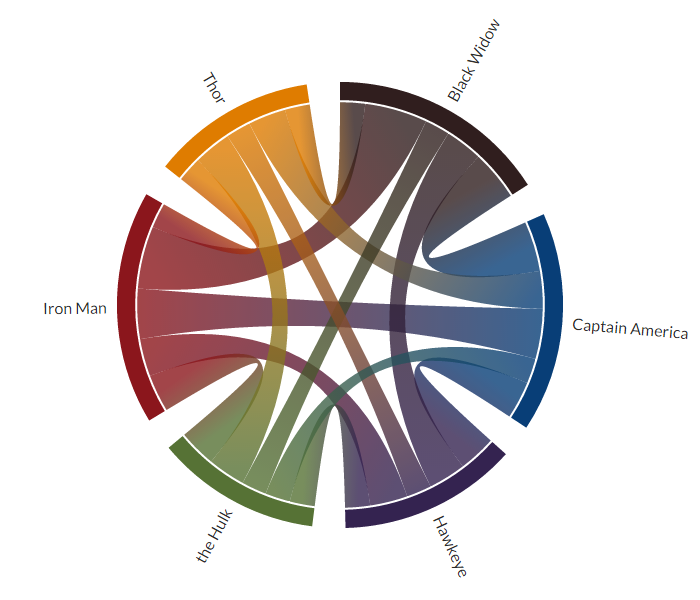
.matrix(matrix);Using the custom sort function will result in the following diagram.
The Code
The code for all the intermediate steps and the final result, which also uses chord labels that are placed on arcs that I talked about in a previous blog, can be found at these links:
- Step 1: A normal chord diagram
- Step 2: The chords are filled with gradients
- Step 3: Applying a custom chord sorting to reduce overlap
- Final example with a bit more styling and tooltip
As always, I hoped you enjoyed reading this tutorial!
SVGs beyond mere shapes blog series
If you’re interested in seeing more examples of how SVG gradients or SVG filters can be used to make your data visualization more effective, engaging or fun, check out the other ±10 blogs that are available. You can find links to all of the blogs in my kick-off article here.