I wanted to share something I recently build with d3.js which might be useful for other people as well; a bar chart in which you can “brush”. Handy for when you have a lot of categories/bars to show with limited space, but you don’t want to only show the top X. By using the brush technique, you give the choice to the user. They can decide which portion of the bars to see, only the top 5, bottom 10, 20 in the middle, or all at once.
If you’re looking at this example on a wide enough screen (at least 600px wide) you can try it out in the example below. Otherwise, you’ll see a static image with a few different selections made. The rainbow gradient is only there because it made the chart more fun to look at while I was developing (⌐■_■)
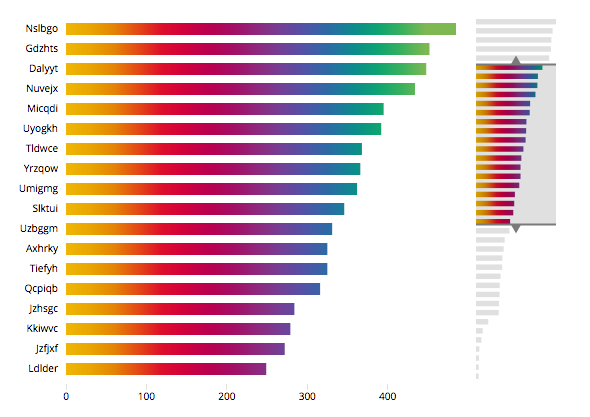
Brushable horizontal bar chart
You can choose to view more bars or less bars of the total bar chart (on the left) by either dragging the box in the mini chart (on the right) or by scrolling your mouse. You can also click anywhere in the mini chart to center the box on that region. And you can increase and decrease the size of the box by dragging the top or bottom handle up or down.

In the example I’ve generated 40 random values and label names. On the right of the two charts, you can see all these 40 bars in a small version with a box on top of it. In the left (larger) bar chart we only see the bars that are present within that small window of the smaller chart on the right. You can move the box up and down and if you’re on a desktop you can increase its size by dragging the handles, or move its position by clicking anywhere else in the mini chart or scrolling up and down.
If you haven’t heard the term brushing in relation to data visualization before, no worries. It generally refers to selecting part of the data by using your mouse to make a selection in the chart. For example, selecting several points in a scatterplot by dragging a (possibly) invisible rectangle over the area containing the points. This and more nice and/or simple examples are already out there that showcase the brushing technique
- Focus+Context via Brushing - The first and simplest example
- Brush & Zoom - A d3v4 updated example that also uses zoom
- Brush & Zoom II - A d3v4 example of selecting in a scatterplot
- Scatterplot Matrix Brushing - My personal favorite, selecting a region in one plot will highlight the selected points in all other plots as well
- I’ve also used it before on my Baby names project to select a specific time frame
However, I couldn’t find a straightforward example that applies brushing on a bar chart. The reason, I think, has to do with the fact that for line charts and scatterplots you have continuous scales. Even if you see only a small portion of your total time axis, for example, you can extrapolate and predict what lies outside of your axis. A bar chart, on the other hand, is discrete. Even if I am now seeing 3 bars, say for the US, Germany, and France, I cannot predict what other values lie “outside” of that. And because of that, I had to think of another way to tackle a critical piece of code that is used in the brush functionality.
At first, I made 3 versions that work by the brush supplying a new subset of data to the bigger chart to draw. However, this didn’t make for very intuitive transitions. When I shared it on twitter I then got the recommendation from Robert Monfera to think about clipping.
Which was exactly the technique I needed! With the help of this answer on stackOverflow by AmeliaBR I managed to implement a much smoother version. In the new case, the bigger bar chart is also plotted with all of the data, but only the part chosen by the brush is visible (the rest is clipped away).
The code
The new version
- Version IV - The bars of the main chart are now smoothly appearing and disappearing. The x-axis is not updated
- Version V - Same as version IV but with an updating x-axis
The old versions that work with less intuitive transitions between the mini and main bar chart (and require way more code in the brush section)
- Version I - The x-axis does not change on a brush and the bars shrink on exit
- Version II - Same as version I but the bars not fade and shrink upward on exit and the update & exit steps happen simultaneously to speed things up
- Version III - Same as version II but now the x-axis also updates to always fill the chart area with the largest value
Happy brushing!