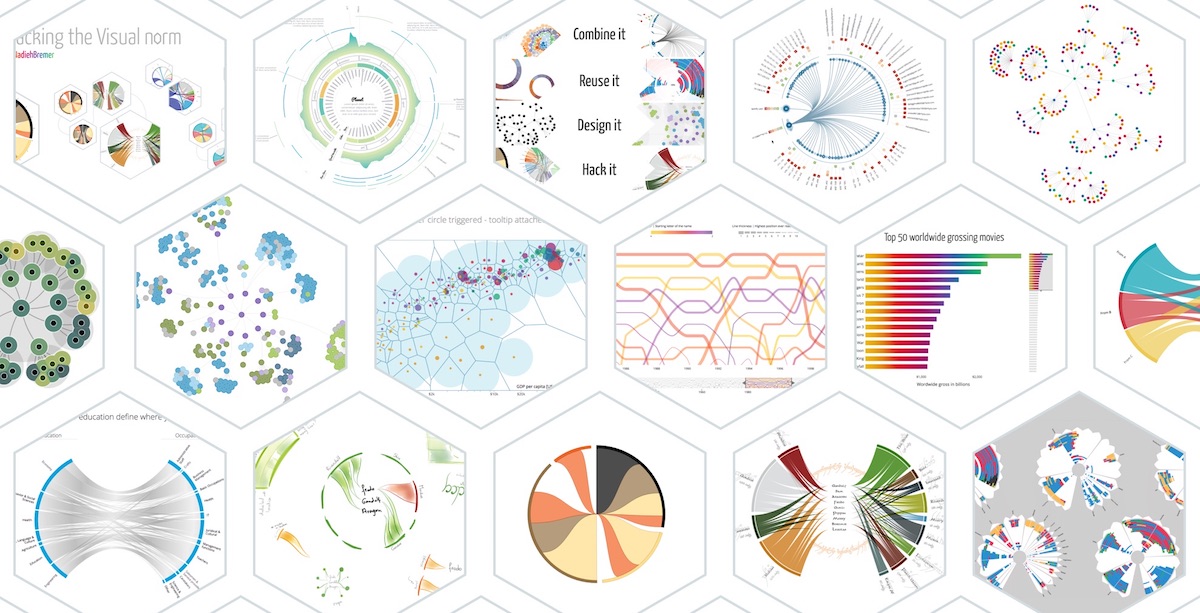
I created the Hacking the Visual Norm talk for the Fronteers Conference, held in Amsterdam on October 6 & 7th 2016. During the talk I try to show several ways that you can go beyond the norm in the visualization of data. I use examples from both a business environment (things I made for Adyen or Deloitte) and personal projects. It revolves around Combining, Re-using, Designing & Hacking your visuals into something more effective and engaging.
I’ve been meaning to share this quick post for months now. But most of my time these days goes into the year-long collaboration that I’m doing with Shirley Wu, called data sketches. So that explains the lack of blogs and tutorials (although I’m keeping a list of ideas to tackle once data sketches is finished).
The video of the talk
I first had a “try-out” at the Amsterdam UX camp weeks before the Fronteers conference. I truly had to wing it since I only finished the slides 2 days before. I didn’t even know if it would take me 30 or 50 minutes to go through them all. But the video below is the first time I did the presentation the way I had intended it to go (minus the issue with the microphone several minutes in (*≧▽≦) ). A thank you to the people from Fronteers for making the video and posting it online!
The more technical stuff
It might take ±10 seconds to load the presentation since everything is loaded at the start.
You can find the interactive slides to the talk here. Here is the corresponding Github repo with the code and where I explain a bit about the animations and bonus events that might not be apparent if you go through the slides. Please look at the slides in Chrome, preferably at a resolution of 1920×1080. At very different resolutions the text sometimes seems to “twitch” when you go to a different step-fragment within a slide. And although everything should work in Firefox and Safari as well, it just looks best in Chrome.
I’ve created the presentation using RevealJS in which each slide can sort-of be seen as its own webpage. I’ve written about my reasons for using it (and tips) in a previous post.
Designing and creating the slides
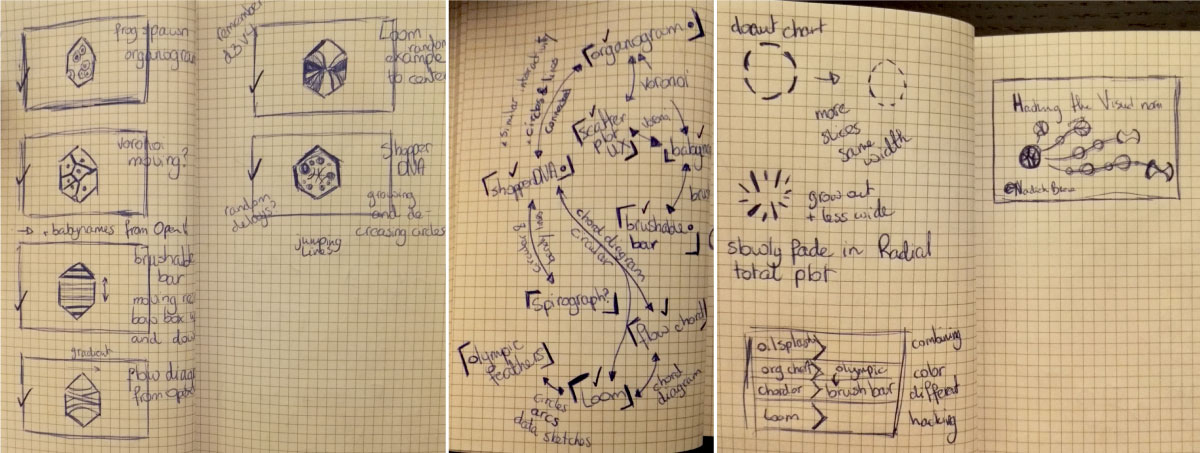
Unlike last time (my SVGs beyond mere shapes presentation), for this presentation I actually didn’t draw out that many slides beforehand. Mainly because this presentation was really about the design journey of a several existing projects. Therefore, I relied heavily on screenshots that I’d made during development. Instead I created an extremely rough Keynote presentation where I’d place the screenshots together with the message of that slide. A storyboard of sorts.
Only for the new slides did I take to my notebook to sketch out ideas. As in my previous presentation, I again used hexagons to switch between the chapters/subjects that I was talking about. It’s always quite fun to think of somewhat funky and interesting looking visuals to place within the hexagons that still relate to the subject to come.
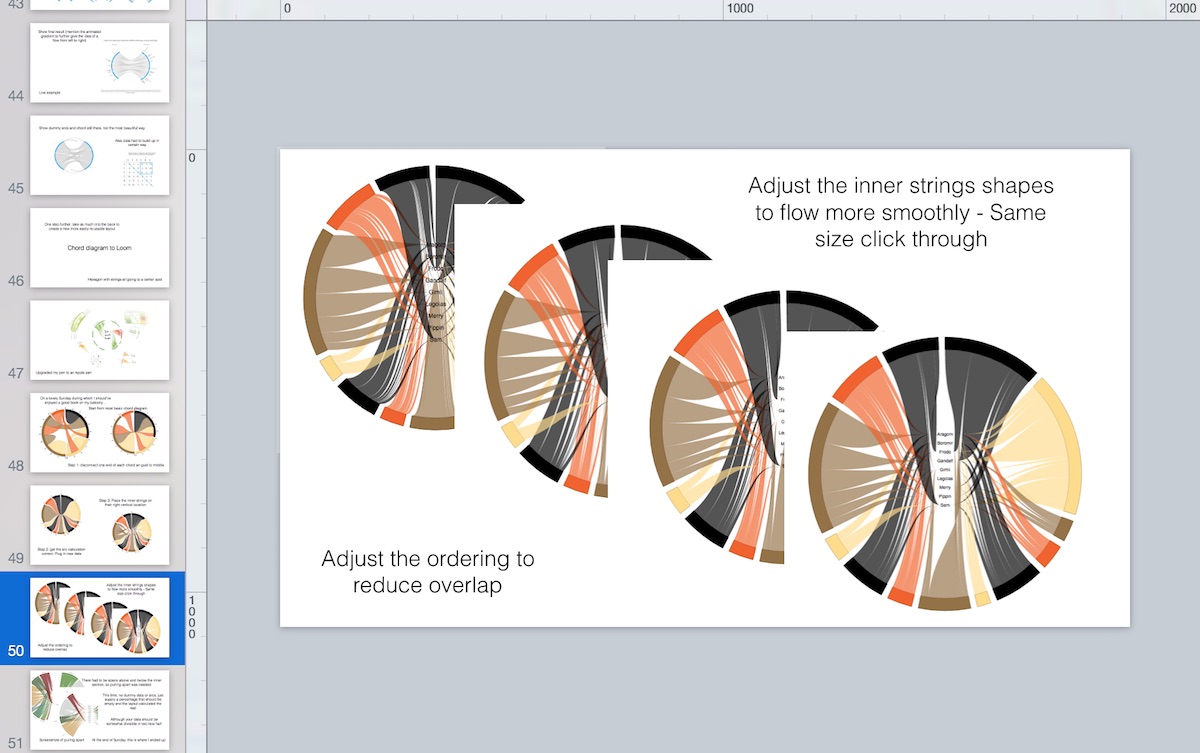
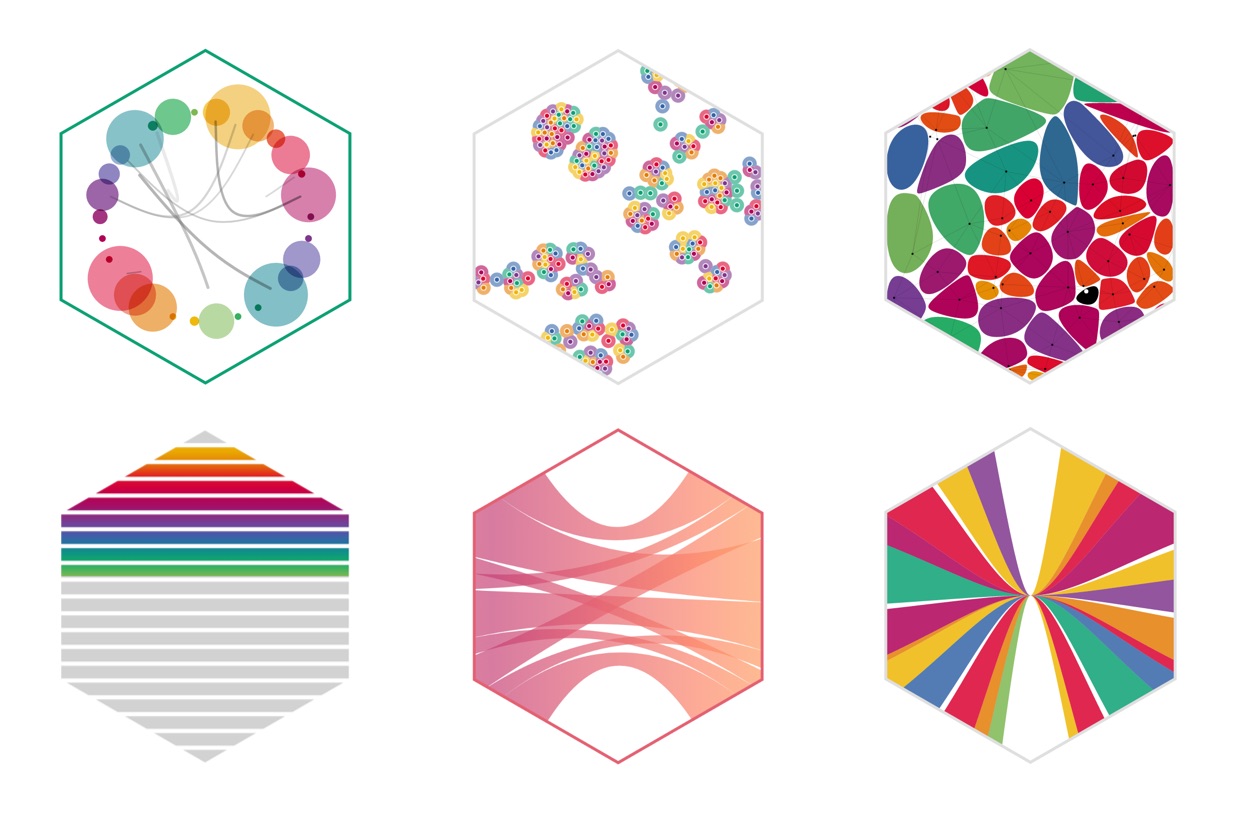
Below you can see the result of the title hexagon slides. I re-used one (the pink stretched chord diagram), but the others are all new and the first 4 even move!
Bloopers
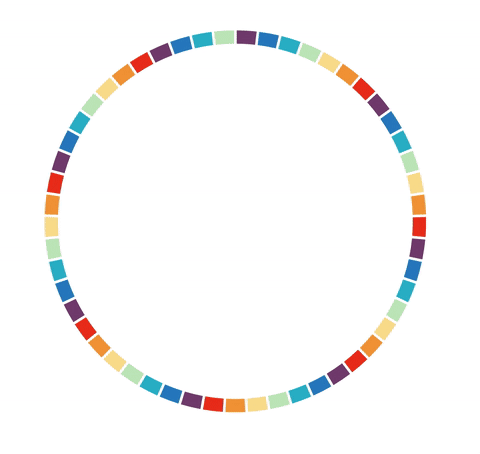
Sadly, I don’t have that many bloopers to share of my coding errors during development. However, I did manage to take a video of something silly. I still don’t know what’s happening really. In one of the first slides I change a donut chart into a radial bar chart. Originally the donut chart would start out as a rainbow, and below is where I’m trying to turn the donut slices into radial bars. But as I said, not quite going as I’d hoped here (●__●)
I hope you’ll like the talk and message I’m trying to convey in the presentation. I have a few upcoming meetups/conferences where I’m giving the talk, with real-life demos (I couldn’t put all in the online version). So if you don’t want to look at the video, or don’t have the time now, maybe you can catch me at a conference near you, which also gives you the opportunity to ask questions face-to-face (•‿•)