In this blog I’d like to “formally” introduce and explain a new (and my first) d3 plugin to create a chart that I’ve started calling the loom. Although I was very much inclined to also call it the butterfly or labrys. However, I actually needed two words for this plugin, so loom + strings made more sense overall (thanks to Mike Bostock who provided the name).
Originally I create this chart form for the very first month of Data Sketches in which I dove into understanding the words spoken by the characters of the Fellowship in the movies of the Lord of the Rings.
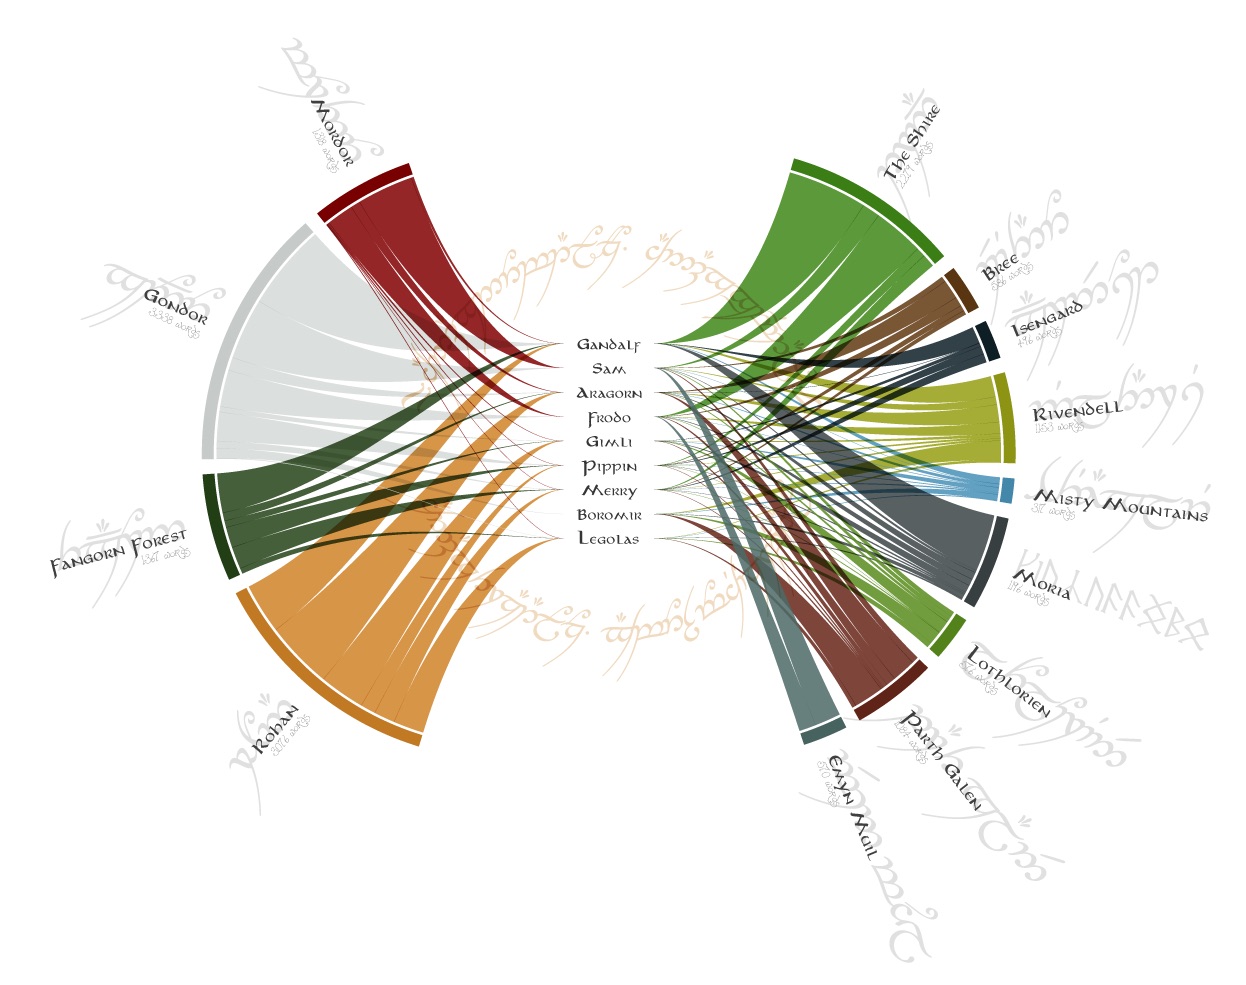
What is visualized in this chart form is a numeric value that forms a connection between two groups of entities. I’ll use the Lord of the Rings version as an example to make the explanation easier for the rest of the blog.
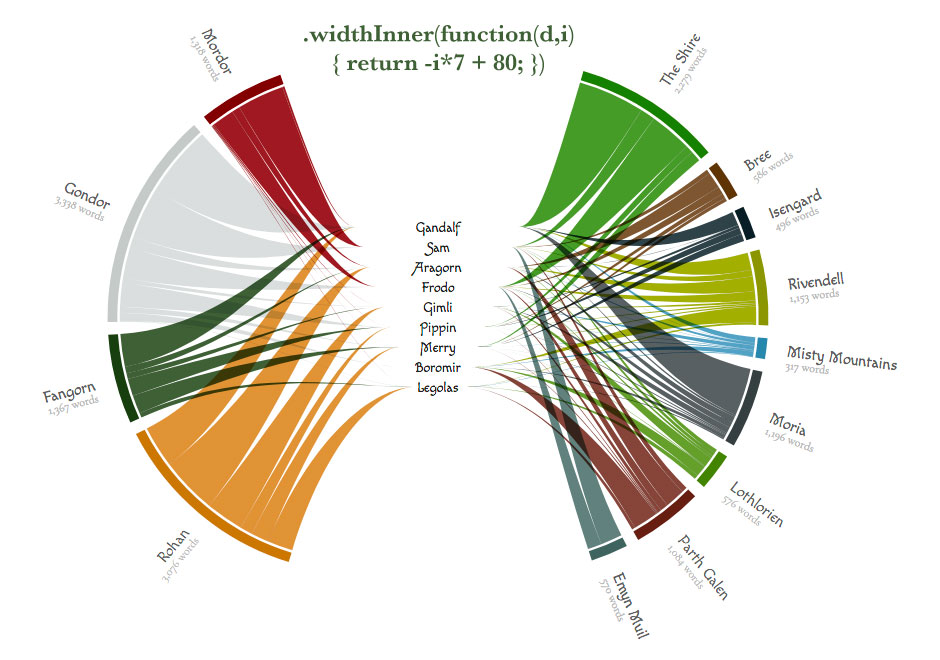
One group of (out of the two groups of) entities, which I’ll often refer to as the inner, are the characters of the Fellowship. These nine I’ve placed in the center. The second group of entities, the outer, are the rough locations in Middle Earth where the scenes in the movie play out. These locations are spread around in a circle surrounding the nine characters in the center. Finally, the two groups are connected by strings, where the width of a string on the outside determines the value, which in this case is the number of words spoken. Thus the width of a string between Gandalf and The Shire represents the number of words spoken by Gandalf in The Shire.
Plugin
The code for the plugin can be found and downloaded from this GitHub repo. There you can find more explanations about the different options and settings of the chart in the typical wiki style of d3. However, in this blog I’ll take your through the useful settings, accompanied by visual examples.
The loom.js file contains both the loom and string functions that are needed to calculate all the SVG paths to get the double bladed axe design. One thing to note is that you need to call the loom function only after you’ve loaded d3.js itself.
<!-- Call the loom plugin only after loading d3.js itself -->
<script src="https://d3js.org/d3.v4.min.js"></script>
<script src="loom.js"></script>
Data
Instead of the JSON example, a CSV with these 3 variables in 3 different columns would work just as well.
Typically a dataset for the loom contains 3 values; the outer entity, the inner entity and the value that connects these two (e.g. outer = location, inner = person, value = words spoken by person at location). For example, for the LotR example, the json dataset looks as follows
[
  {
    "location": "The Shire", //the outer
    "character": "Frodo",    //the inner
    "words": 679             //the value
  },
  {
    "location": "The Shire",
    "character": "Pippin",
    "words": 124
  },
  {
    "location": "The Shire",
    "character": "Sam",
    "words": 239
  },{
  //...more data...
  }
]
Loom
Let’s first look at the properties of the loom function and what the impact is of each. We can initiate the loom function by calling d3.loom() and then providing all of the settings to go with it. Since we already know how our data looks, I’ll start by making sure the loom function knows what variables to use for the inner, outer and value, since I didn’t explicitly give any of the properties in the data above those names:
//Let's first set the data assessors to handle our specific dataset
var loom = d3.loom()
    //The default .value expects a property called "value"
    //the function below updates that to "words" as in the JSON above
    .value(function(d) { return d.words; })
    //The default .inner expects a property called "inner"
    .inner(function(d) { return d.character; })
    //The default .outer expects a property called "outer"
    .outer(function(d) { return d.location; })
Next we have a few more settings that define the appearance. Let me walk you through each of these.
//Set the more "appearance" related values
loom
    .padAngle(0.05)  //Default is 0 - given as radians in between each group
    .widthInner(30)  //Default is 30px
    .heightInner(20) //Default is 20px
    .emptyPerc(0.2)  //Default is 0.2 (i.e. 20%)
	/* + more options for visual sorting discussed in the next section */
First up is the padAngle, which sets the amount of white space that goes between the different outer arcs; a bigger value means more whitespace.
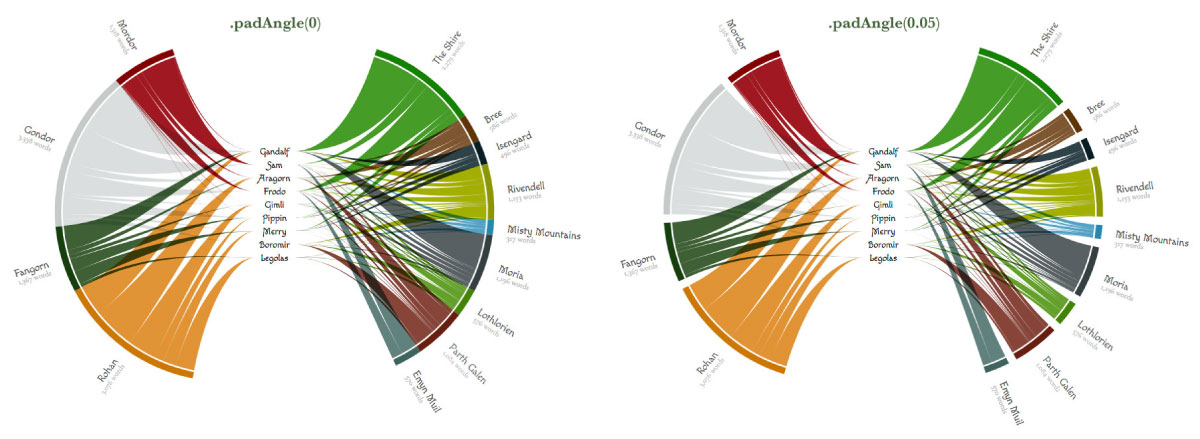
Next you can set the widthInner, this width gives the horizontal distance between the inner endpoints of the strings in the center. It’s the value that determines the width of the gap that is created so the text of the inner entities doesn’t overlap the strings. You can either supply a value, such as 30, to make it constant for all entities in the center. But you can also supply a function in case you want the width to change per entity in the center. This function receives a d value that contains the string of the entity in the center. You can therefore make the width depend on the length of the character’s name like such
//Scale to convert from string length to pixels
var wordScale = d3.scaleLinear()
    .domain([3, 7])
    .range([25, 60]);

//Set the widthInner according to the number of letters
//in the string of the "inner" entity
loom.widthInner(function(d) { return wordScale(d.length); })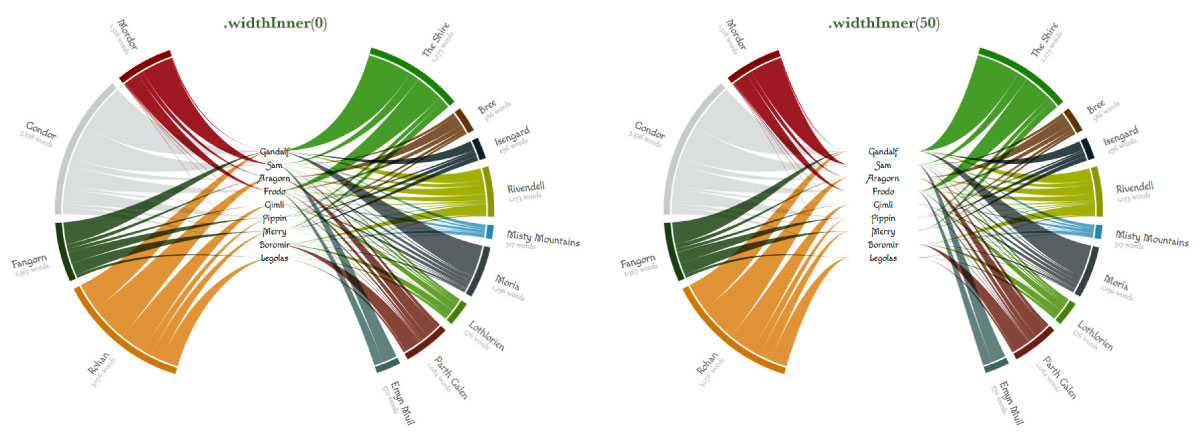
Or you can do something as silly as making the width depend on the order of the entities in the center like below.
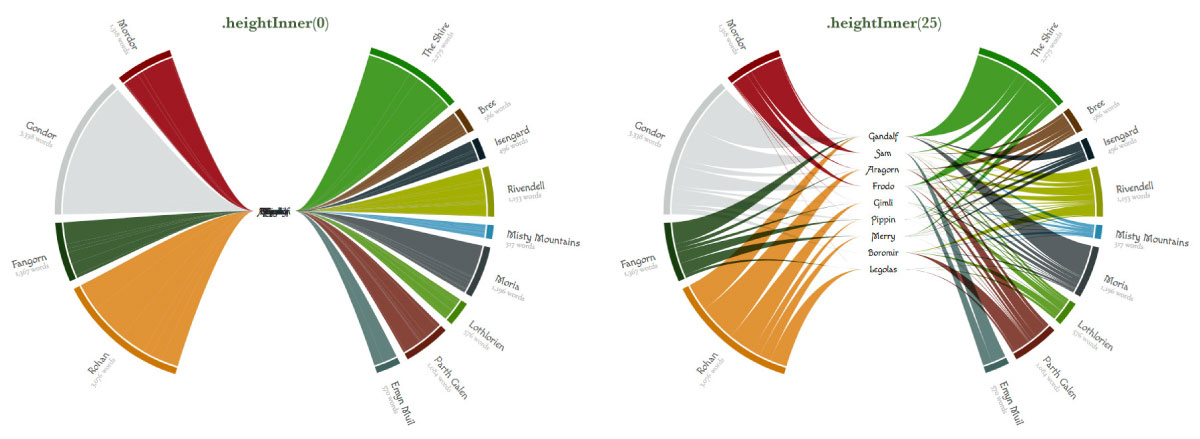
There is also a heightInner, which does the same as widthInner but then for the vertical placement. This height gives the vertical distance between the inner entities in the center; a bigger value means more space in between the inner entities. You can only supply a constant value to this assessor, not a function (what would you base it one anyway…)
Moving on to the last of the 4 “appearance” setting, emptyPerc. I took this idea from an earlier chart I build (also based on d3’s chord diagram, just like this one) where I had an empty section between the left and right half; the stretched chord diagram, or in better words, the batplot. The emptyPerc thus gives the percentage of the circle that will be empty to create space in the top and bottom. You supply it as a ratio between 0 and 1, 0.2 would be the same as 20% of the circle being empty.
This note is only relevant when you specify an empty percentage of course.
One thing that I have not (yet) figured out is how to sort the outer groups/entities in such a way to automatically make a visually appealing split in 2 separate halves. For now you will have to manually order the outer entities in such a way that when split into two groups, the total value of those two groups separately lies close to 50%.
However, you don’t need to have the same number of entities on the left half as on the right. The program will try and find a split that separates all the entities in two groups to make them both as close to 50% as possible, but it will not reorder the outer entities to do so (except if you use the sortGroups assessor, which I talk about further below).
Sorting the loom
Next up are 3 sorting options. There are 3 because you can sort the entire visual in 3 different ways. However, typically I only have to use the sortSubGroup and not sort on the other two options. Nevertheless, let’s take a look at the effects of all three.
//Finally, let's focus on the different sorting options
loom
.sortSubgroups(sortCharacter) //The default is null, i.e. no sorting
.sortGroups(null)
.sortLooms(null)
//Manually sorted the characters based on the total number of words spoken
//From most at the top to least at the bottom
var characterOrder = ["Gandalf", "Sam", "Aragorn", "Frodo", "Gimli",
"Pippin", "Merry", "Boromir", "Legolas"];
function sortCharacter(a, b) {
return characterOrder.indexOf(a) - characterOrder.indexOf(b);
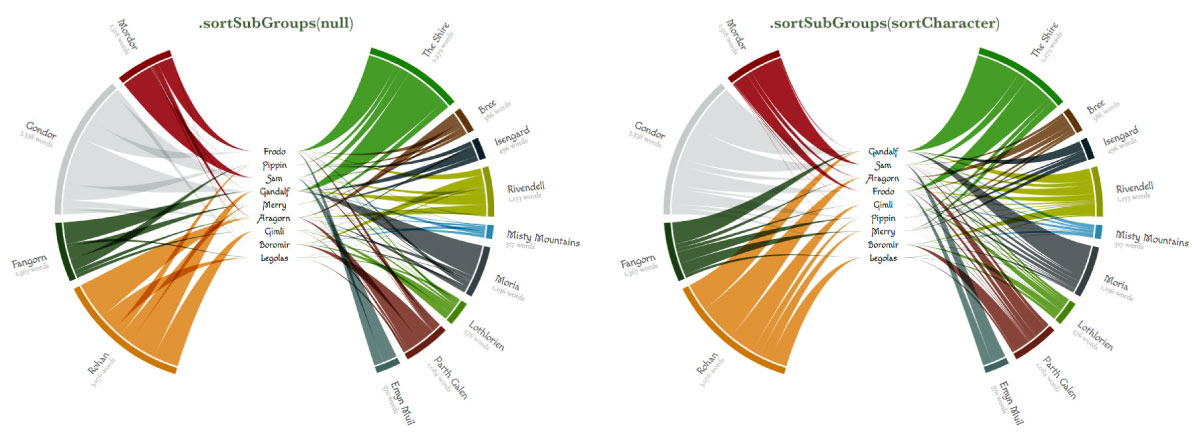
}Let’s start with the one that makes most sense and I believe is always good to sort: the sortSubGroups. This sorting applies to the order of the strings within each outer entity; in what order will they be placed on the outside along each arc of the outer entity. It also applies to the vertical order of the inner entities. I think it’s always best to sort this in some manner, otherwise the layout will assume the exact order as given by the data, which typically results in a lot of overlap (see the below left image).
For the LotR example, I wrote a small custom sorting function called sortCharacters that sorts the strings from the person that speaks the most, Gandalf, to the one that speaks the least, Legolas (not even Boromir, strange right?!). This gives the result in the image below right.
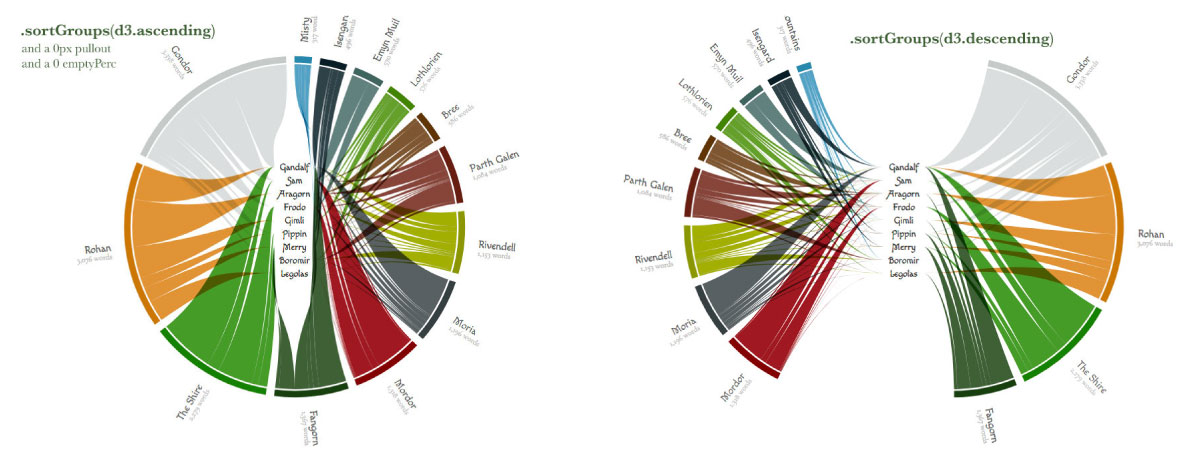
We can also sort the order in which the outer entities are drawn. This is done with sortGroups; it is used to sort the outer entities by their total value (i.e. the sum of all the inner strings). It works well when supplying either d3.ascending or d3.descending. However, for my default LotR visual I had already sorted the data itself in exactly the order that I wanted for the outer entities, namely the order in which they first appear in the movie. Therefore, I didn’t supply any additional sorting with sortGroups.
Also, as you can see from the images below, this sorting can suffer from the fact that not all combinations result in a nice, ±50-50 split of the data. In the image below right I’ve done a descending sort of the outer entities (based on the total sum of the values of the strings for each location). However, this is imbalanced on the right side, with 4 large groups. Therefore, if you have this issue, try to fiddle around with the right sortGroup settings, padAngle and emptyPerc to get a visually nice split (or prepare your data in a way that gives a good 50-50-ish split).
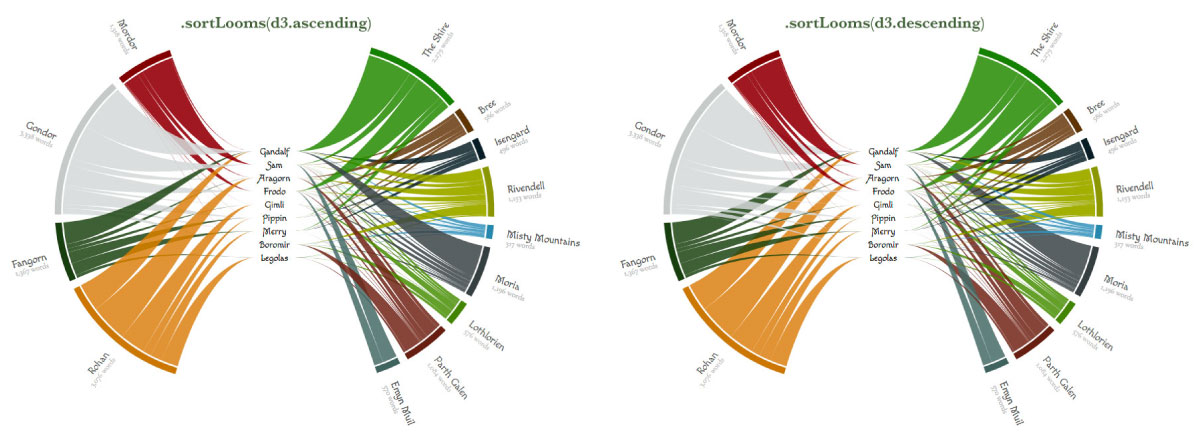
And finally there is the sortLooms. This is perhaps a bit of a misleading name, because what is actually sorted are the inner strings themselves. You are sorting the order in which these are drawn (similar to the z-index for those familiar with the CSS property). This can be very useful to make sure that the thickest strings are drawn first and then the smaller strings are plotted on top (use d3.descending as in the example below right).
In the default LotR version that I’m using I have no use for this sorting, because I apply a mix-blend-mode of multiply to the strings. Therefore, any kind of sorting would produce the same visual result. For the two examples below I’ve deactivated the blend mode so you can actually see the difference between sorting in an ascending manner in the left image (smallest strings are at the bottom), or descending in the right image (smallest strings are at the top).
And those are all of the options you can set for the d3.loom() function. I know that already feels like a lot, and we haven’t even started with the options of the d3.string() function. Luckily that one comes down to only 3 settings, pfew (*^▽^*)ゞ
Strings
After the loom function has “done its thing” with the data, the string function takes that output to draw the inner strings. The string function is initiated by calling d3.string() after which you can provide a few different settings, although there are only 3 that are truly useful to set
//Initiate the inner string function that belongs to the loom
var string = d3.string()
//Radius should always be set manually
//and often the same as the innerRadius value
//which I typically declared at the start of the code
.radius(innerRadius)
.pullout(pullOutSize) //Defaults to 50px
.thicknessInner(0) //Defaults to 0px
//Initiate an arc drawing function that is also needed
var arc = d3.arc()
.innerRadius(innerRadius*1.01)
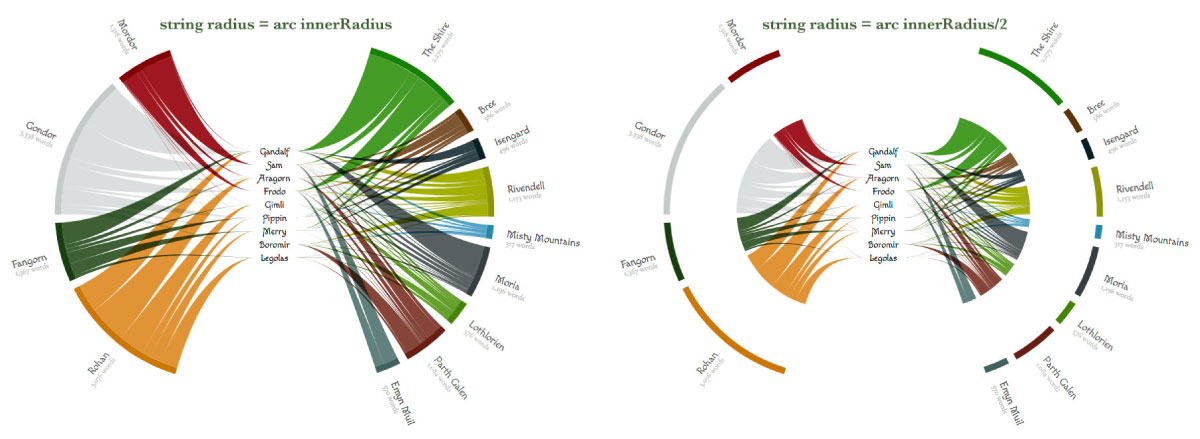
.outerRadius(outerRadius);There is one accessor that should always be adjusted manually, and that is the radius. It defines the radius (in pixels) out to which the strings are drawn. It is often set (almost) the same as the innerRadius assessor that you set on the d3.arc function to create the outer arcs.
I personally always create a variable called innerRadius at the start of my code that I provide to both the d3.string and d3.arc function.
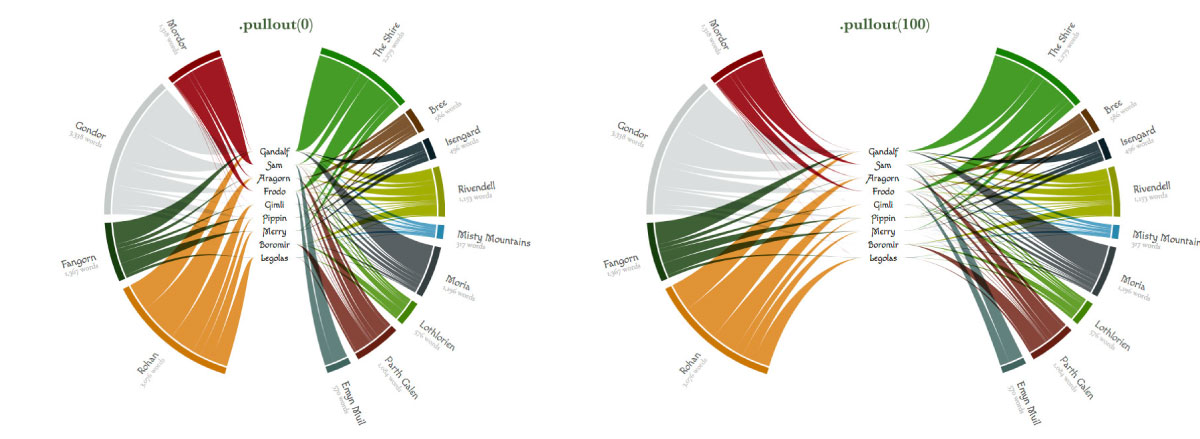
After that we have the pullout, which sets the amount of pixels that the two halves should be pulled away horizontally from the center. This is often used in combination with the emptyPerc assessor of the loom function. You might have to try a few different values for both of these values to see which combination gives the most visually appealing result.
I typically also create a variable called pullOutSize at the start of my code, because this value is needed more often than just in this assessor function (it’s also needed to move the arcs and outer labels outward once you actually start drawing all the elements on the page).
And the final one that “should” be set is the thicknessInner. It defines the thickness, in pixels, of the strings at the inner entity side. It defaults to 0px so the strings taper nicely to a point. But if you wanted to you could make the strings end with a visible thickness, as the examples below show
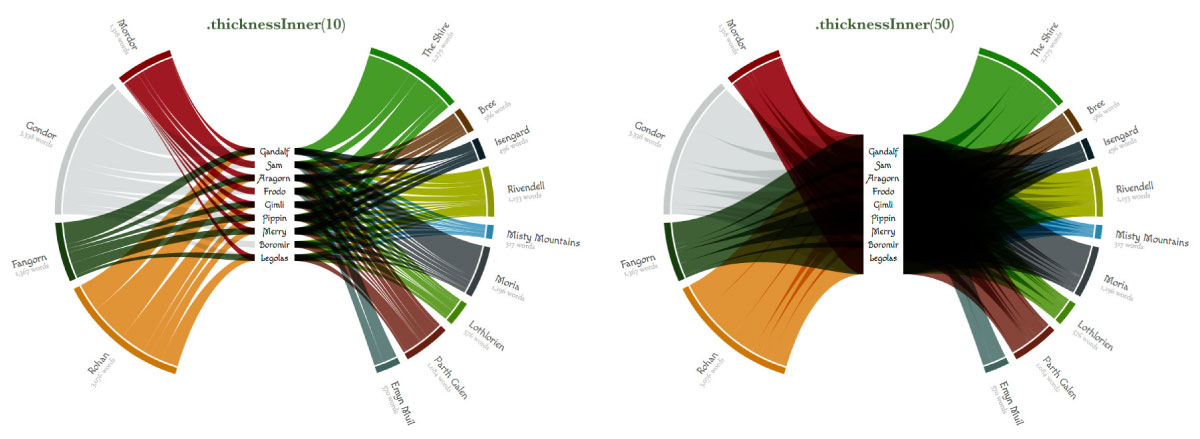
And although there are several other assessors that could theoretically be set on the d3.string function, these can all be kept at their defaults. This is because the d3.string function is made specifically to handle the result of the d3.loom function. Wherever possible, the input of the d3.string assessor expects something that is called the same as a specific part of the output of the d3.loom function. I’ve only made these other assessors changeable for the really serious loom fanatic that wants to create something truly… odd… I guess (◍•﹏•)
Code
Now we’ve seen all the settings that will change the appearance of the loom and the inner strings. The remainder of the code, meant to actually draw all the SVG paths that came from these two functions, is very similar to the default chord diagram, or even the batplot (which is where I refer you to if you’d like to understand more about the rest of the code below).
The code uses solely variables that have been calculated by the d3.loom and d3.string function (such as d.outername or d.name), and a few generic variables, such as width, the pullOutSize and innerRadius, which I already discussed above. It should therefore be rather straightforward to copy+paste the section below into your own code
////////////////////////////////////////////////////////////
///////////////////// Read in data /////////////////////////
////////////////////////////////////////////////////////////

d3.json("lotr_words_location.json", function (error, data) {

    //Create a group that already holds the data
    var g = svg.append("g")
        .attr("transform", "translate(" + (width / 2 + margin.left) + "," +
                                          (height / 2 + margin.top) + ")")
        .datum(loom(data));

    ////////////////////////////////////////////////////////////
    ////////////////////// Draw outer arcs /////////////////////
    ////////////////////////////////////////////////////////////

    var arcGroup = g.append("g").attr("class", "arc-outer-wrapper");

    //Create a group per outer arc, which will contain the arc path &
    //the location name & number of words text
    var arcs = arcGroup.selectAll(".arc-wrapper")
        .data(function (s) { return s.groups; })
        .enter().append("g")
        .attr("class", "arc-wrapper")
        .each(function (d) {
            d.pullOutSize = ( pullOutSize *
                (d.startAngle > Math.PI + 1e-2 ? -1 : 1) )
        });

    //Create the actual arc paths
    var outerArcs = arcs.append("path")
        .attr("class", "arc")
        .style("fill", function (d) { return color(d.outername); })
        .attr("d", arc)
        .attr("transform", function (d, i) {
            //Pull the two slices apart
            return "translate(" + d.pullOutSize + ',' + 0 + ")";
        });

    ////////////////////////////////////////////////////////////
    //////////////////// Draw outer labels /////////////////////
    ////////////////////////////////////////////////////////////

    //The text needs to be rotated with the offset in the clockwise direction
    var outerLabels = arcs.append("g")
        .each(function (d) { d.angle = ((d.startAngle + d.endAngle) / 2); })
        .attr("class", "outer-labels")
        .attr("text-anchor", function (d) {
            return d.angle > Math.PI ? "end" : null;
        })
        .attr("transform", function (d, i) {
            var c = arc.centroid(d);
            return "translate(" + (c[0] + d.pullOutSize) + "," + c[1] + ")"
                + "rotate(" + (d.angle * 180 / Math.PI - 90) + ")"
                + "translate(" + 26 + ",0)"
                + (d.angle > Math.PI ? "rotate(180)" : "")
        })

    //The outer name
    outerLabels.append("text")
        .attr("class", "outer-label")
        .attr("dy", ".35em")
        .text(function (d, i) { return d.outername; });

    //The value below it
    outerLabels.append("text")
        .attr("class", "outer-label-value")
        .attr("dy", "1.5em")
        .text(function (d, i) { return numFormat(d.value) + " words"; });

    ////////////////////////////////////////////////////////////
    //////////////////// Draw inner strings ////////////////////
    ////////////////////////////////////////////////////////////

    var stringGroup = g.append("g").attr("class", "string-wrapper");

    //Draw the paths of the inner strings
    var strings = stringGroup.selectAll("path")
        .data(function (strings) { return strings; })
        .enter().append("path")
        .attr("class", "string")
        .style("fill", function (d) {
            return d3.rgb(color(d.outer.outername)).brighter(0.2);
        })
        .style("opacity", 0.85)
        .attr("d", string);

    ////////////////////////////////////////////////////////////
    //////////////////// Draw inner labels /////////////////////
    ////////////////////////////////////////////////////////////

    var innerLabelGroup = g.append("g").attr("class", "inner-label-wrapper");

    //Place the inner text labels in the middle
    var innerLabels = innerLabelGroup.selectAll("text")
        .data(function (s) { return s.innergroups; })
        .enter().append("text")
        .attr("class", "inner-label")
        .attr("x", function (d, i) { return d.x; })
        .attr("y", function (d, i) { return d.y; })
        .attr("dy", ".35em")
        .text(function (d, i) { return d.name; });

});/* d3.json */
And that is how the loom chart is created!
- The repo of the loom chart: https://github.com/nbremer/d3-loom
- Basic loom without any interactivity
- Including hover interactivity
- The final Lord of the Rings visual with Elvish & Middle Earth fonts
This is my first attempt at a plugin and it has definitely not been tested well enough (*^▽^*)ゞ I would therefore appreciate to hear from you about any bugs or errors that you run into while trying to use the plugin. Or please share your own examples made with the loom plugin, I’d love to see more besides the Lord of the Rings version!