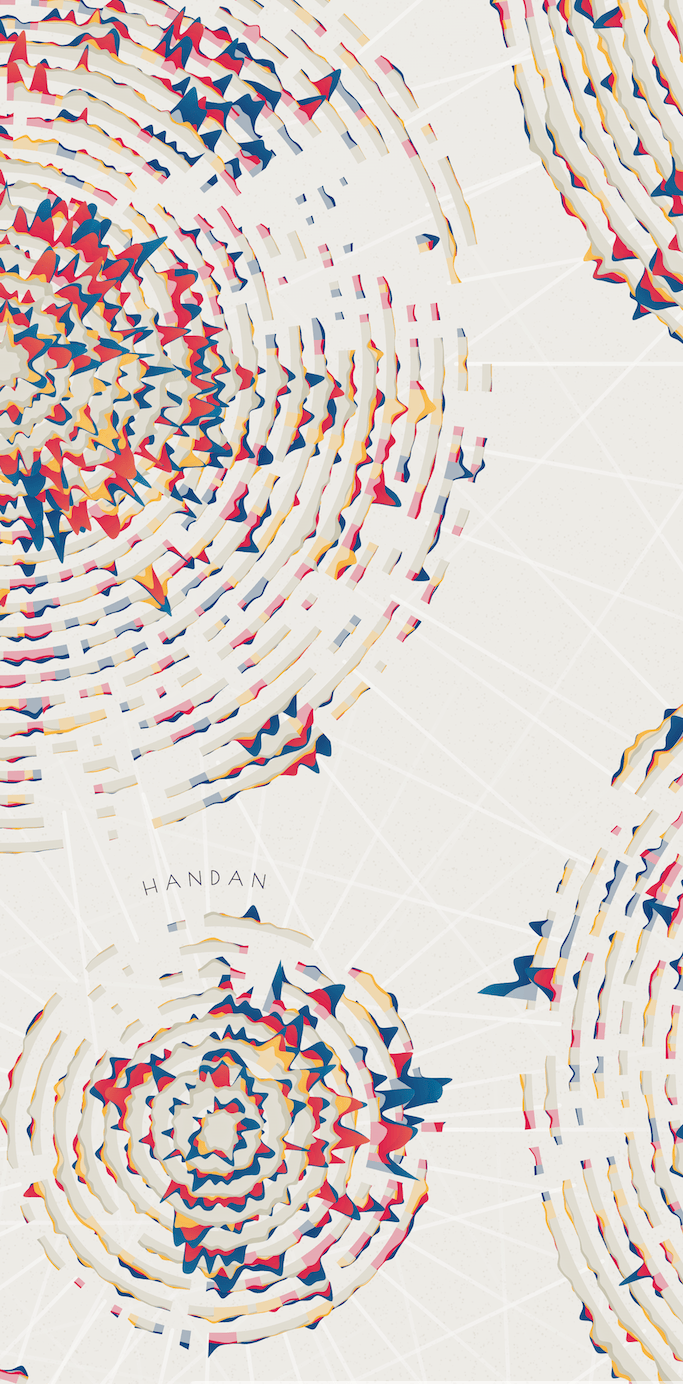
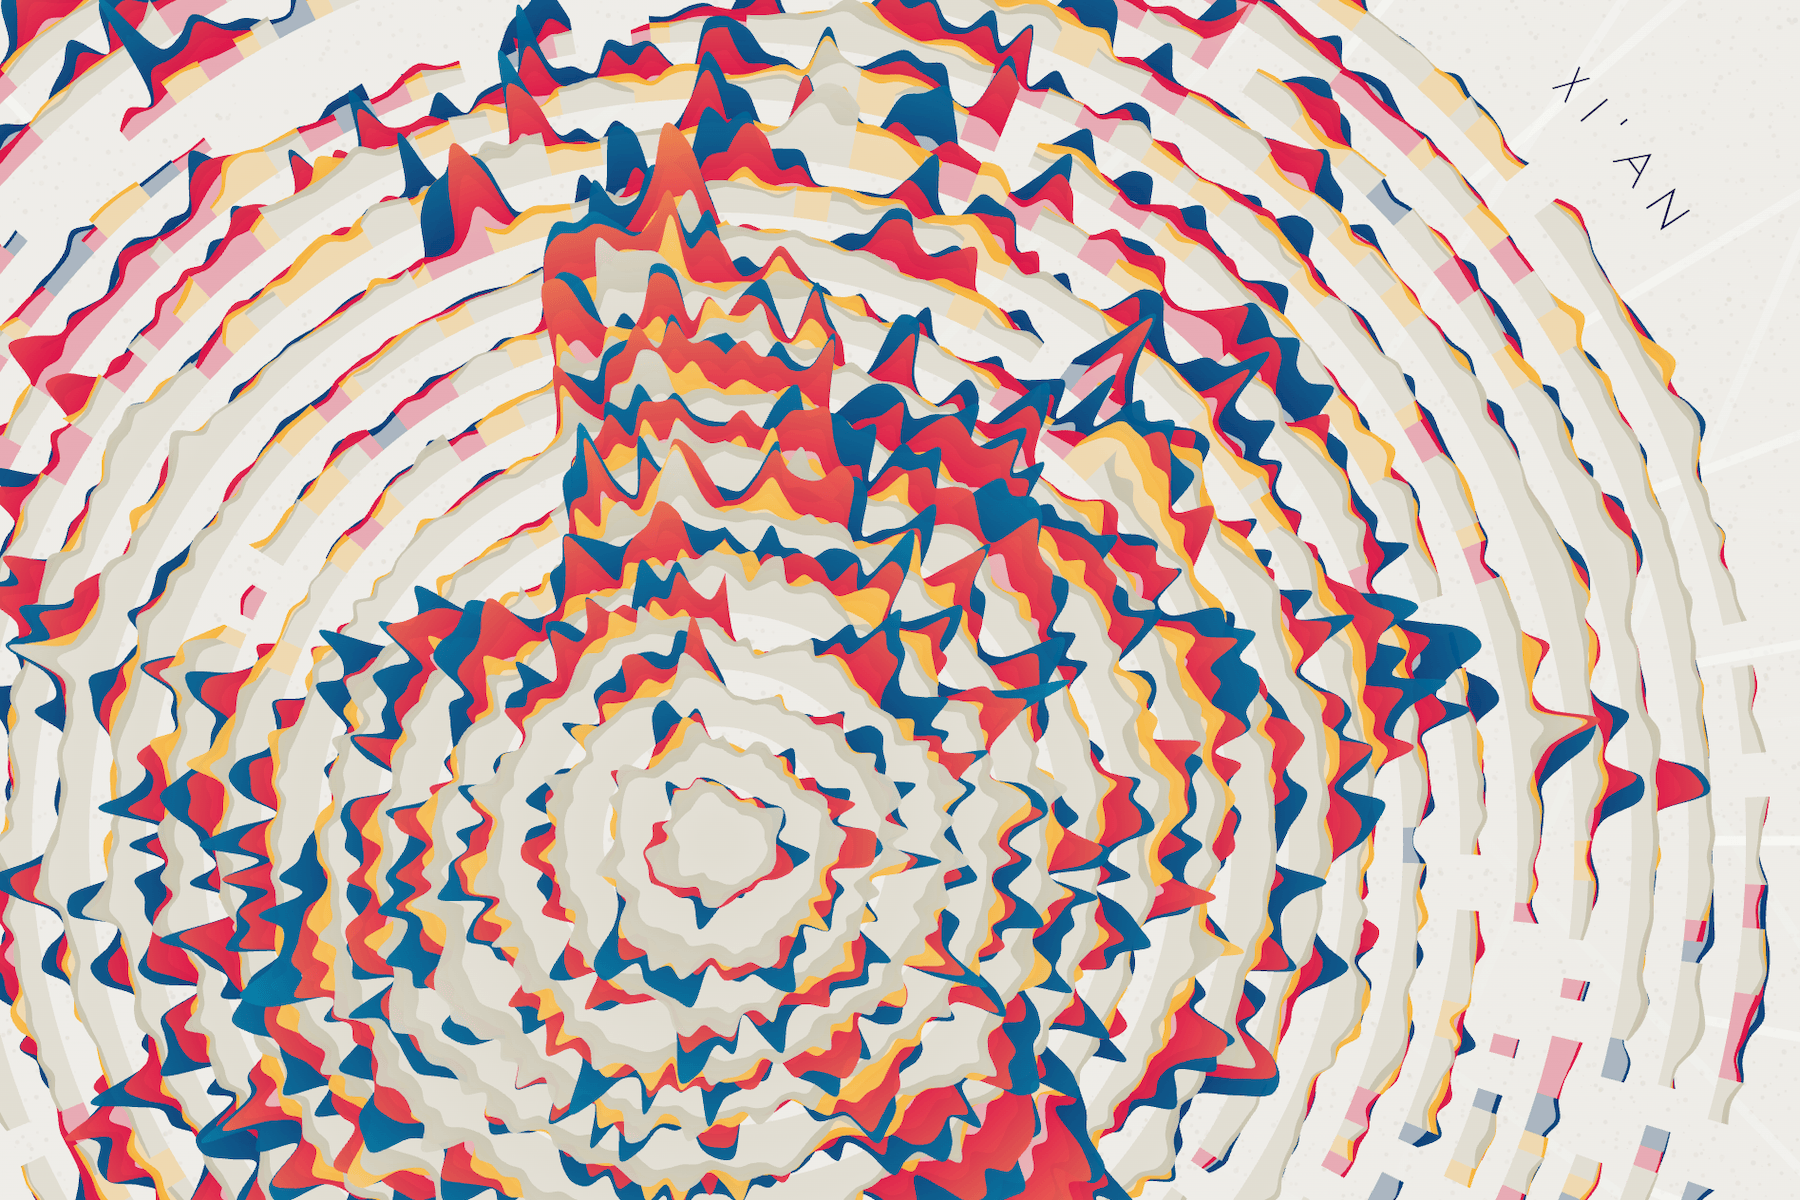
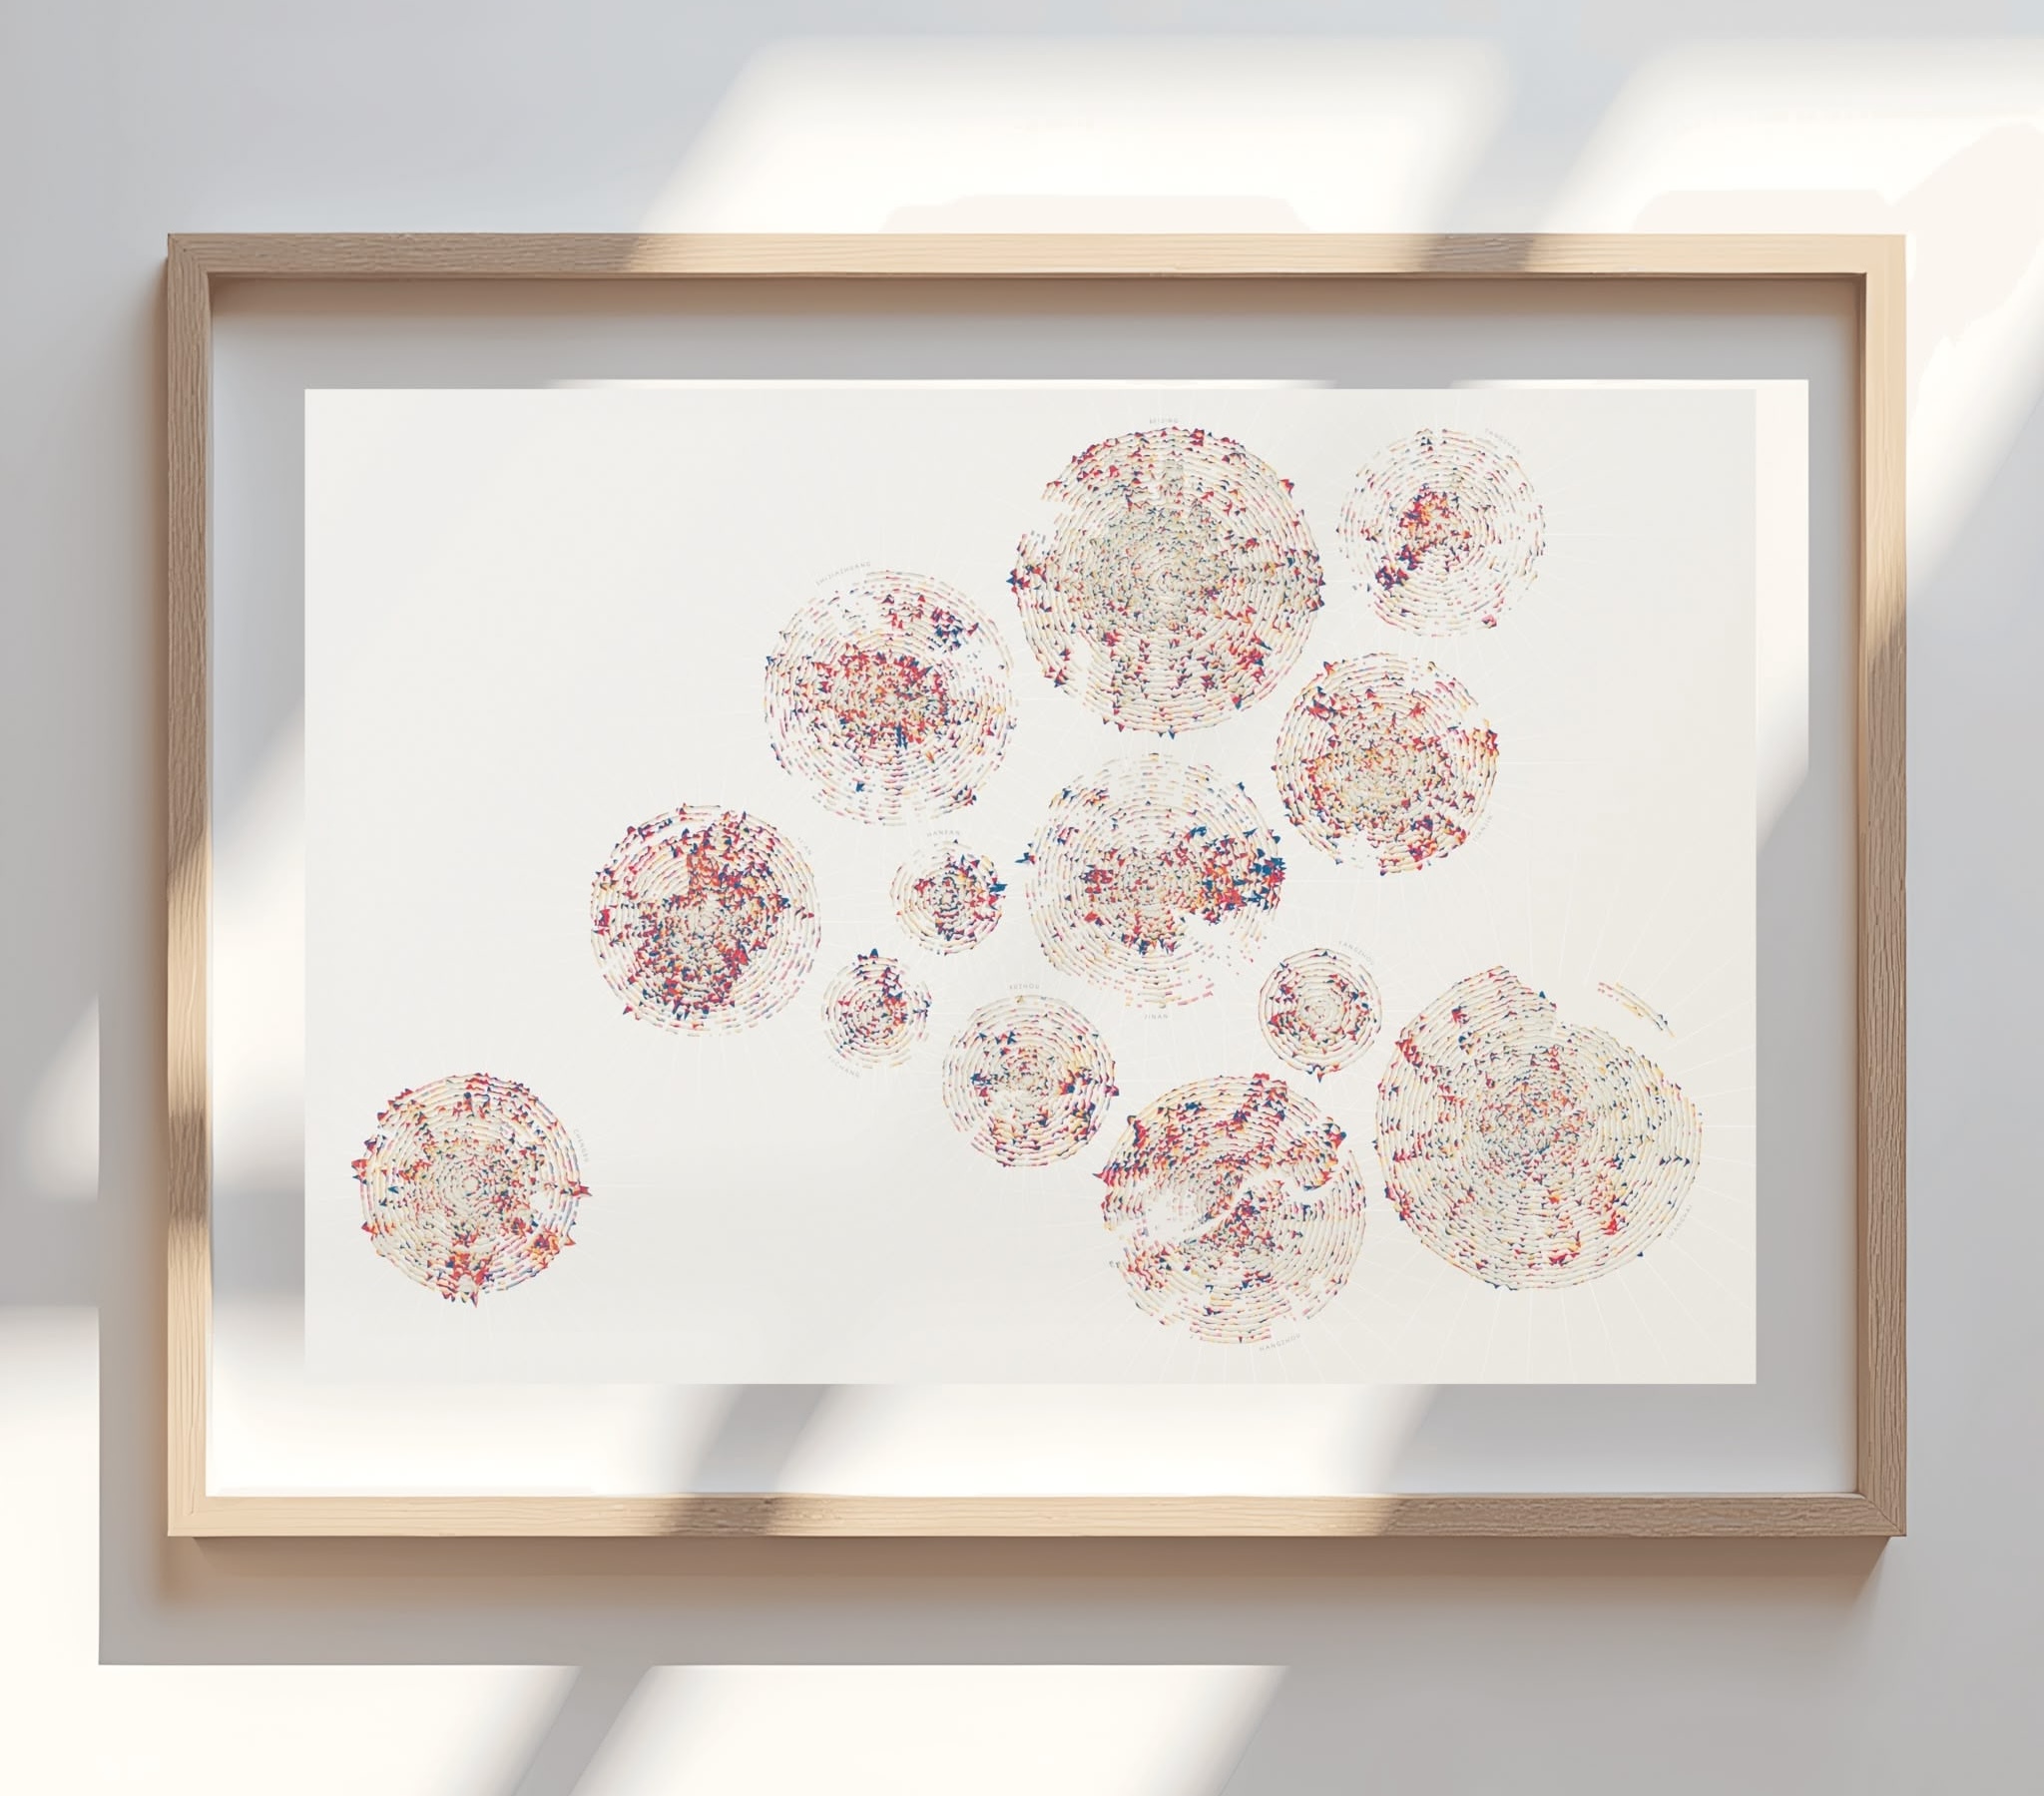
In collaboration with the EPFL Laboratory of Urban and Environmental Systems, I transformed their scientific research on global urban growth into an aesthetic data artwork. By visualizing how cities like Shanghai and Beijing have evolved over two decades, I created an A0-sized piece that brings their findings to a wider audience in a beautiful, art-oriented way. The team aimed to move beyond traditional scientific charts to showcase their research through a more engaging lens. The design ensures that while the end result looks like abstract art at first glance, upon closer inspection, the viewer can clearly discern the underlying urban growth trends and individual city morphology.
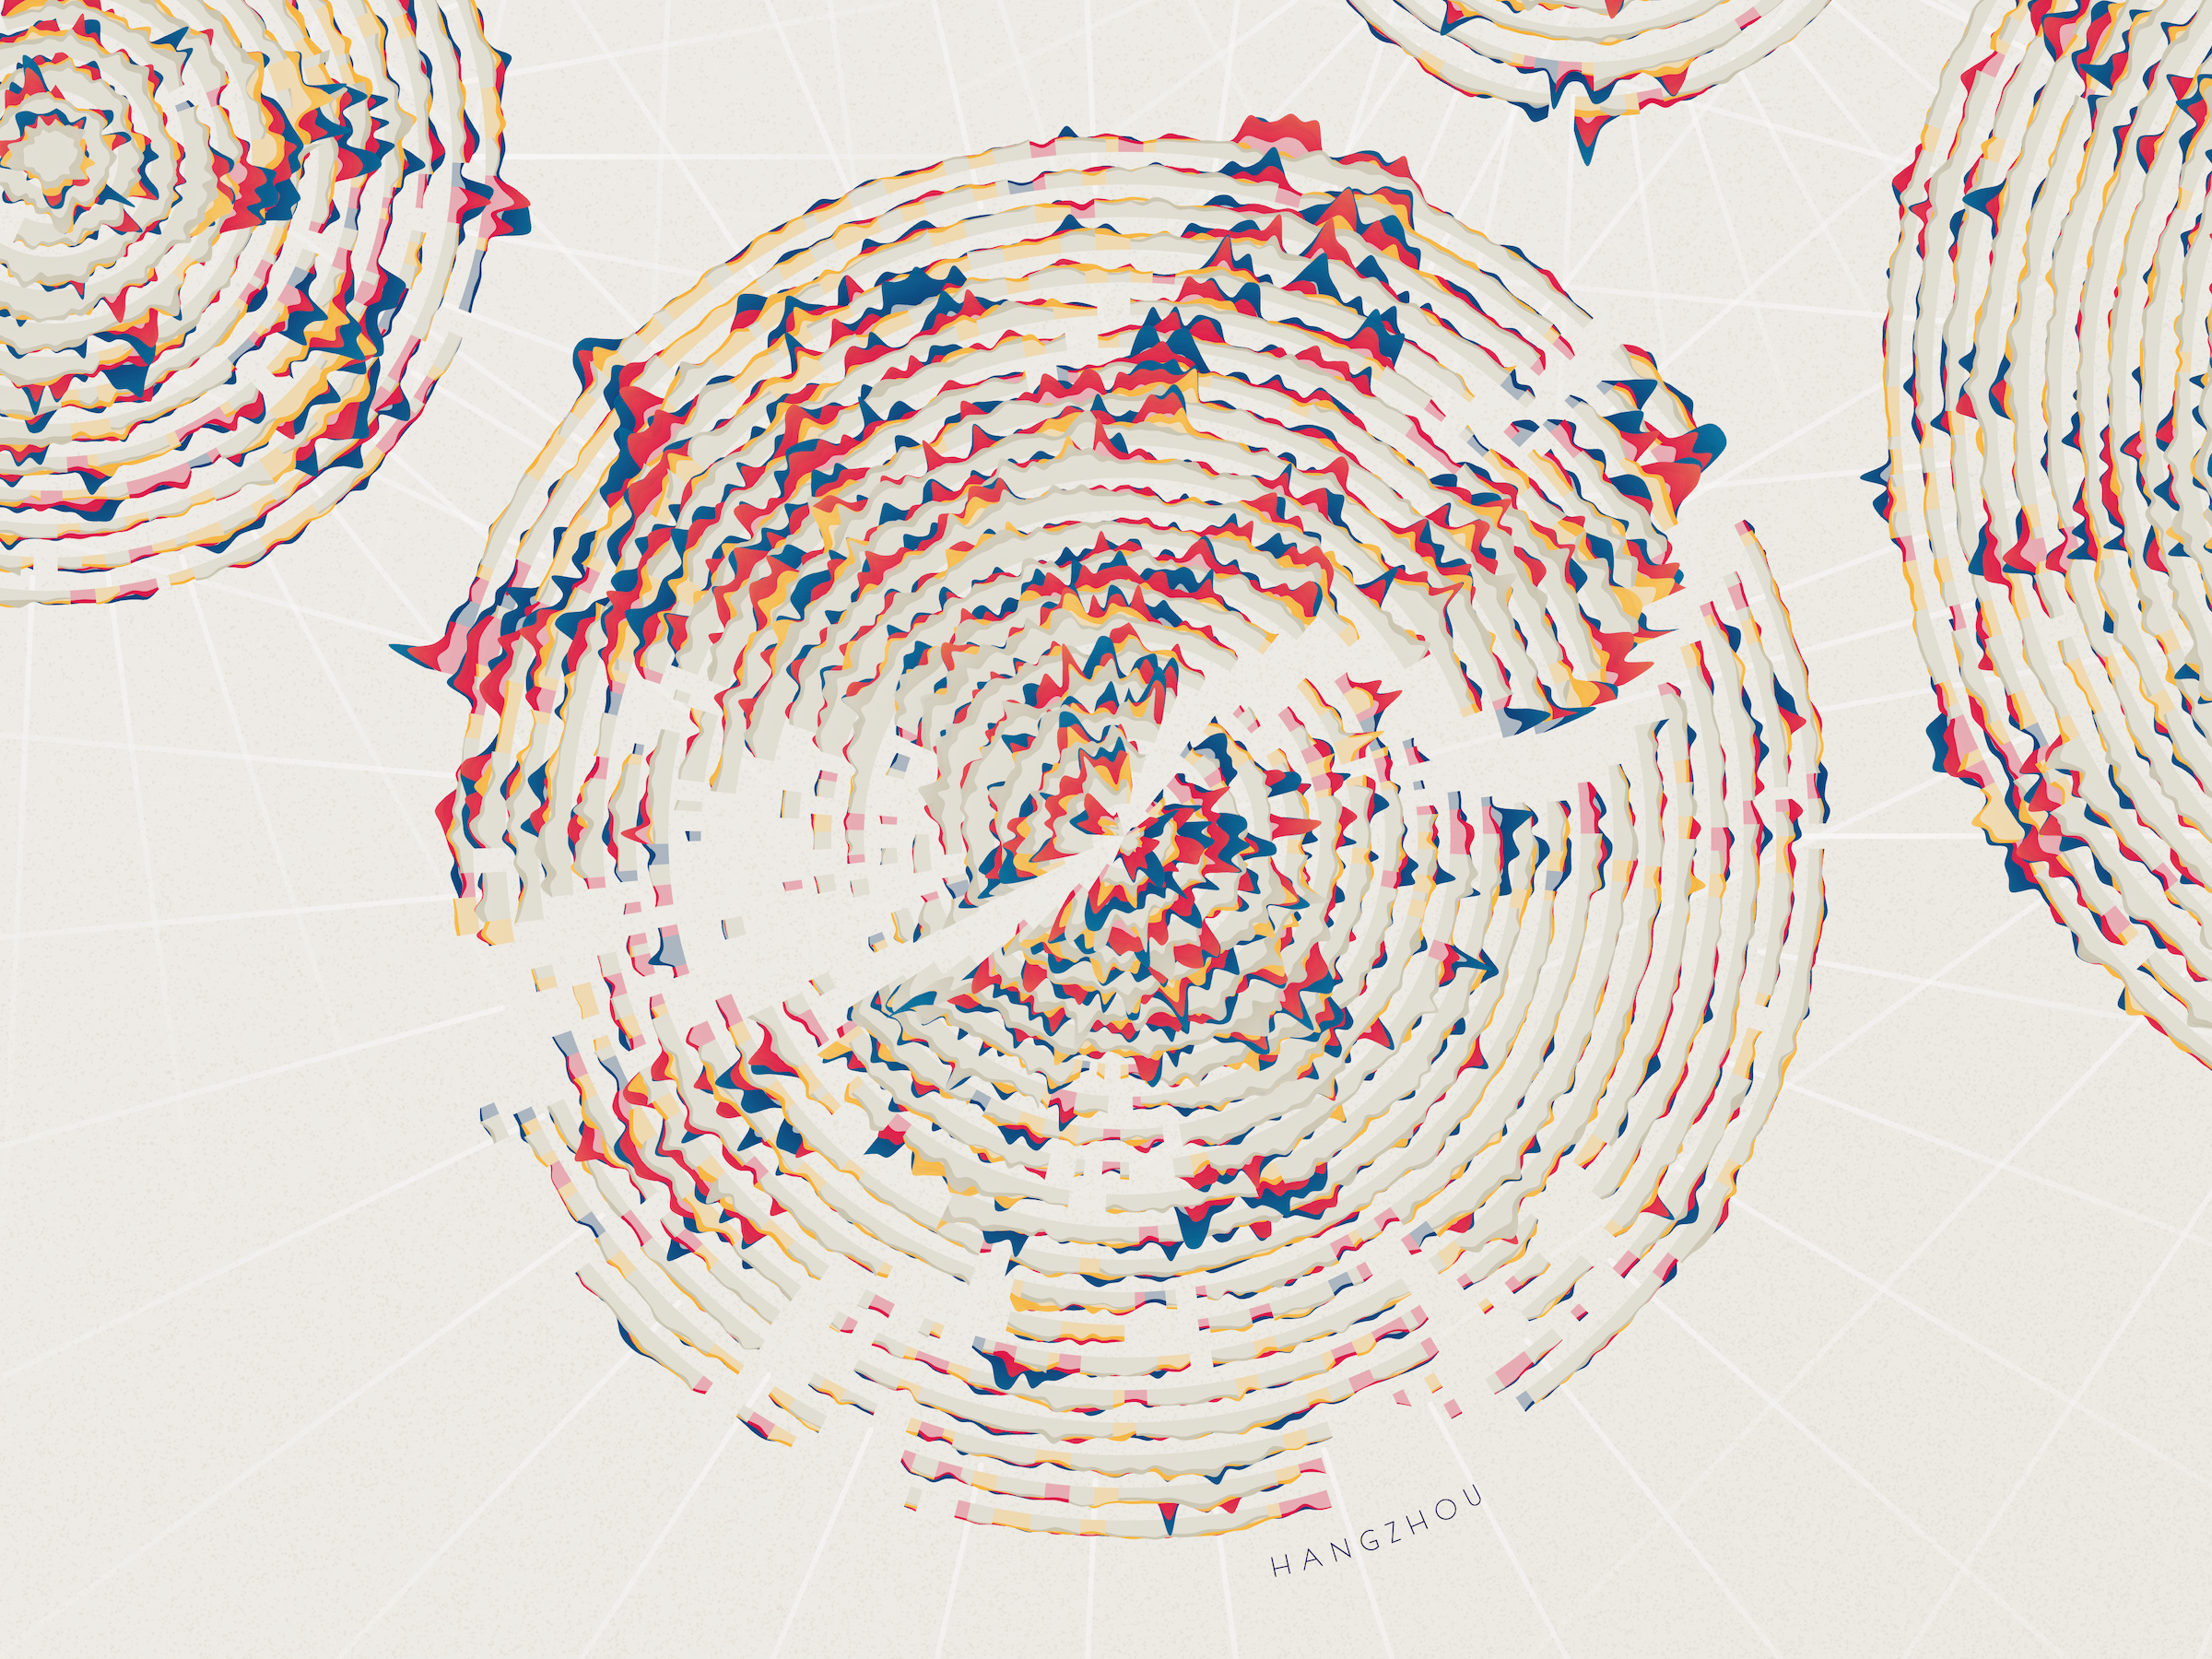
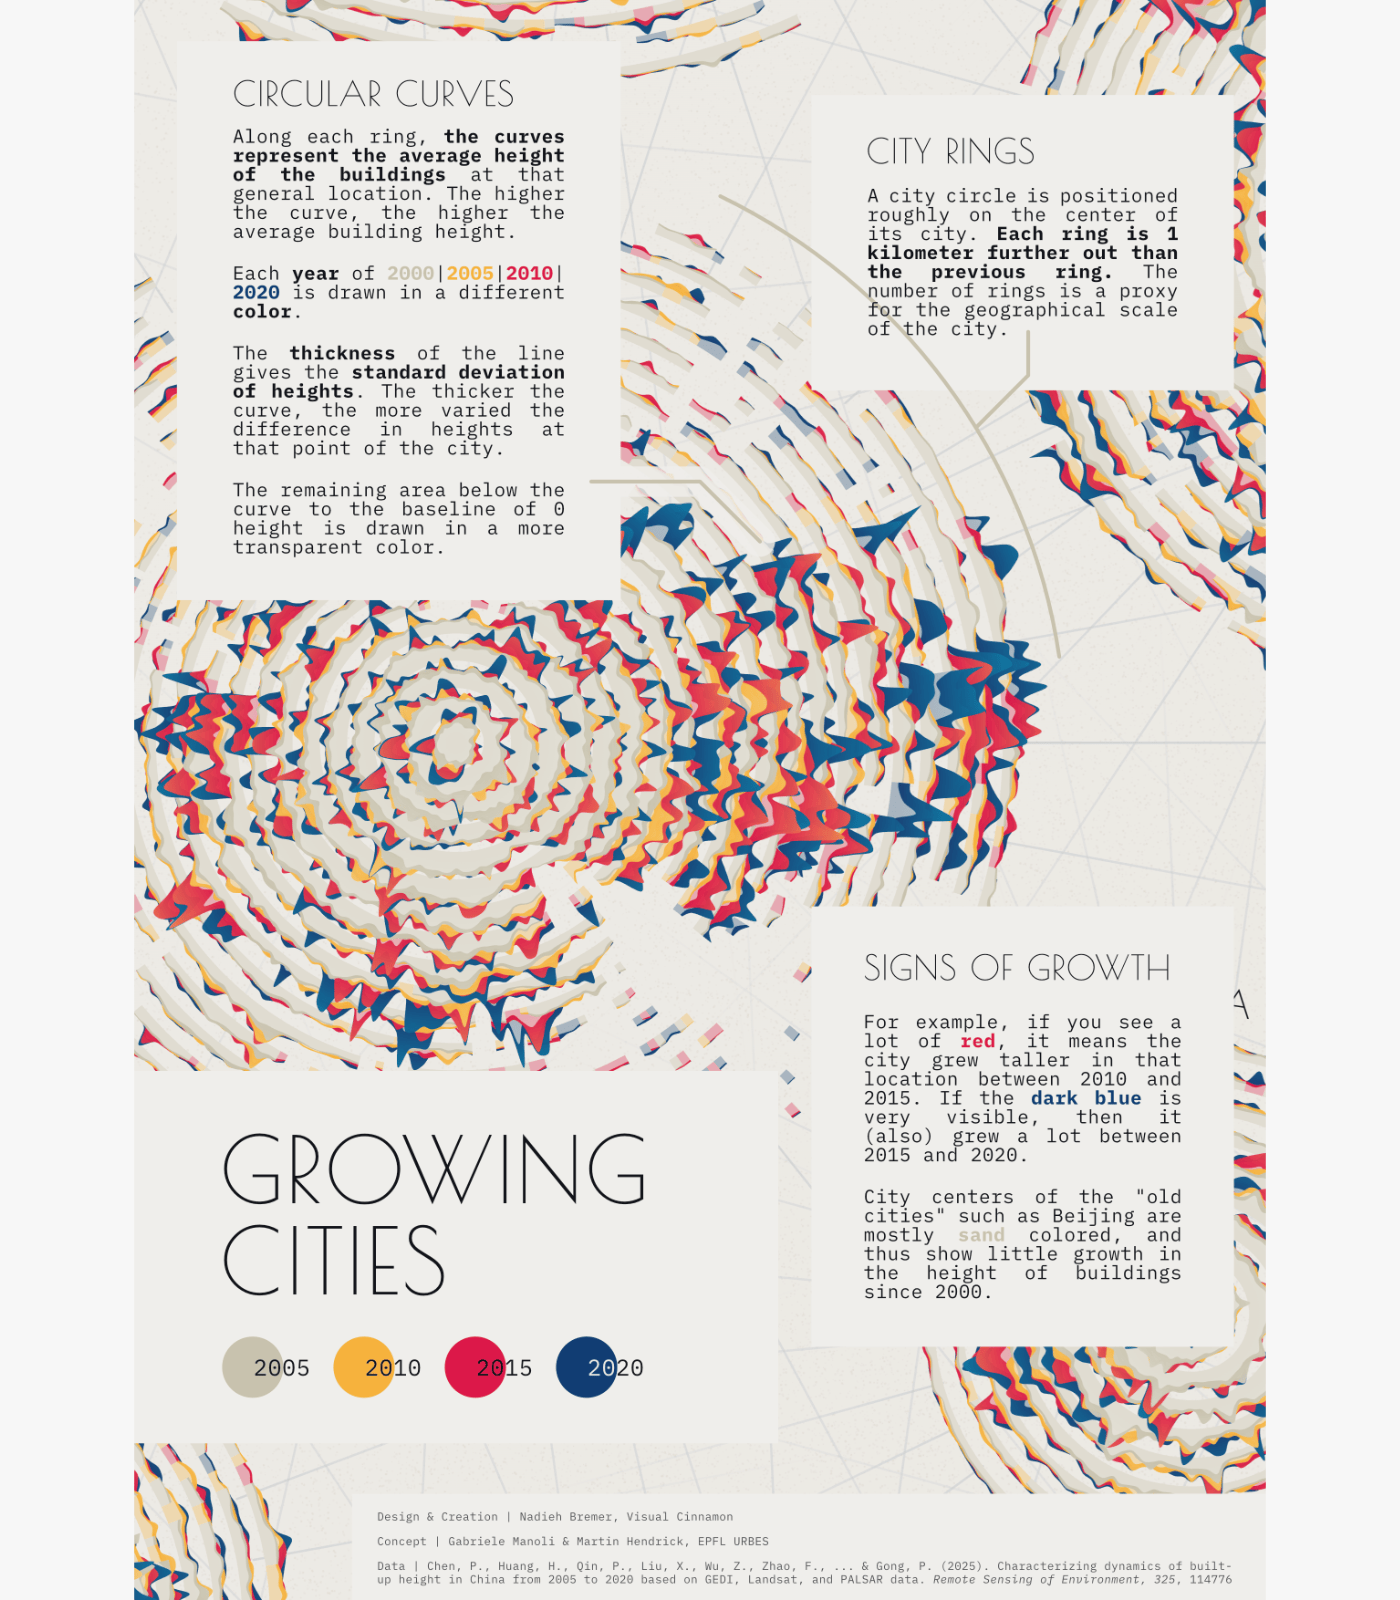
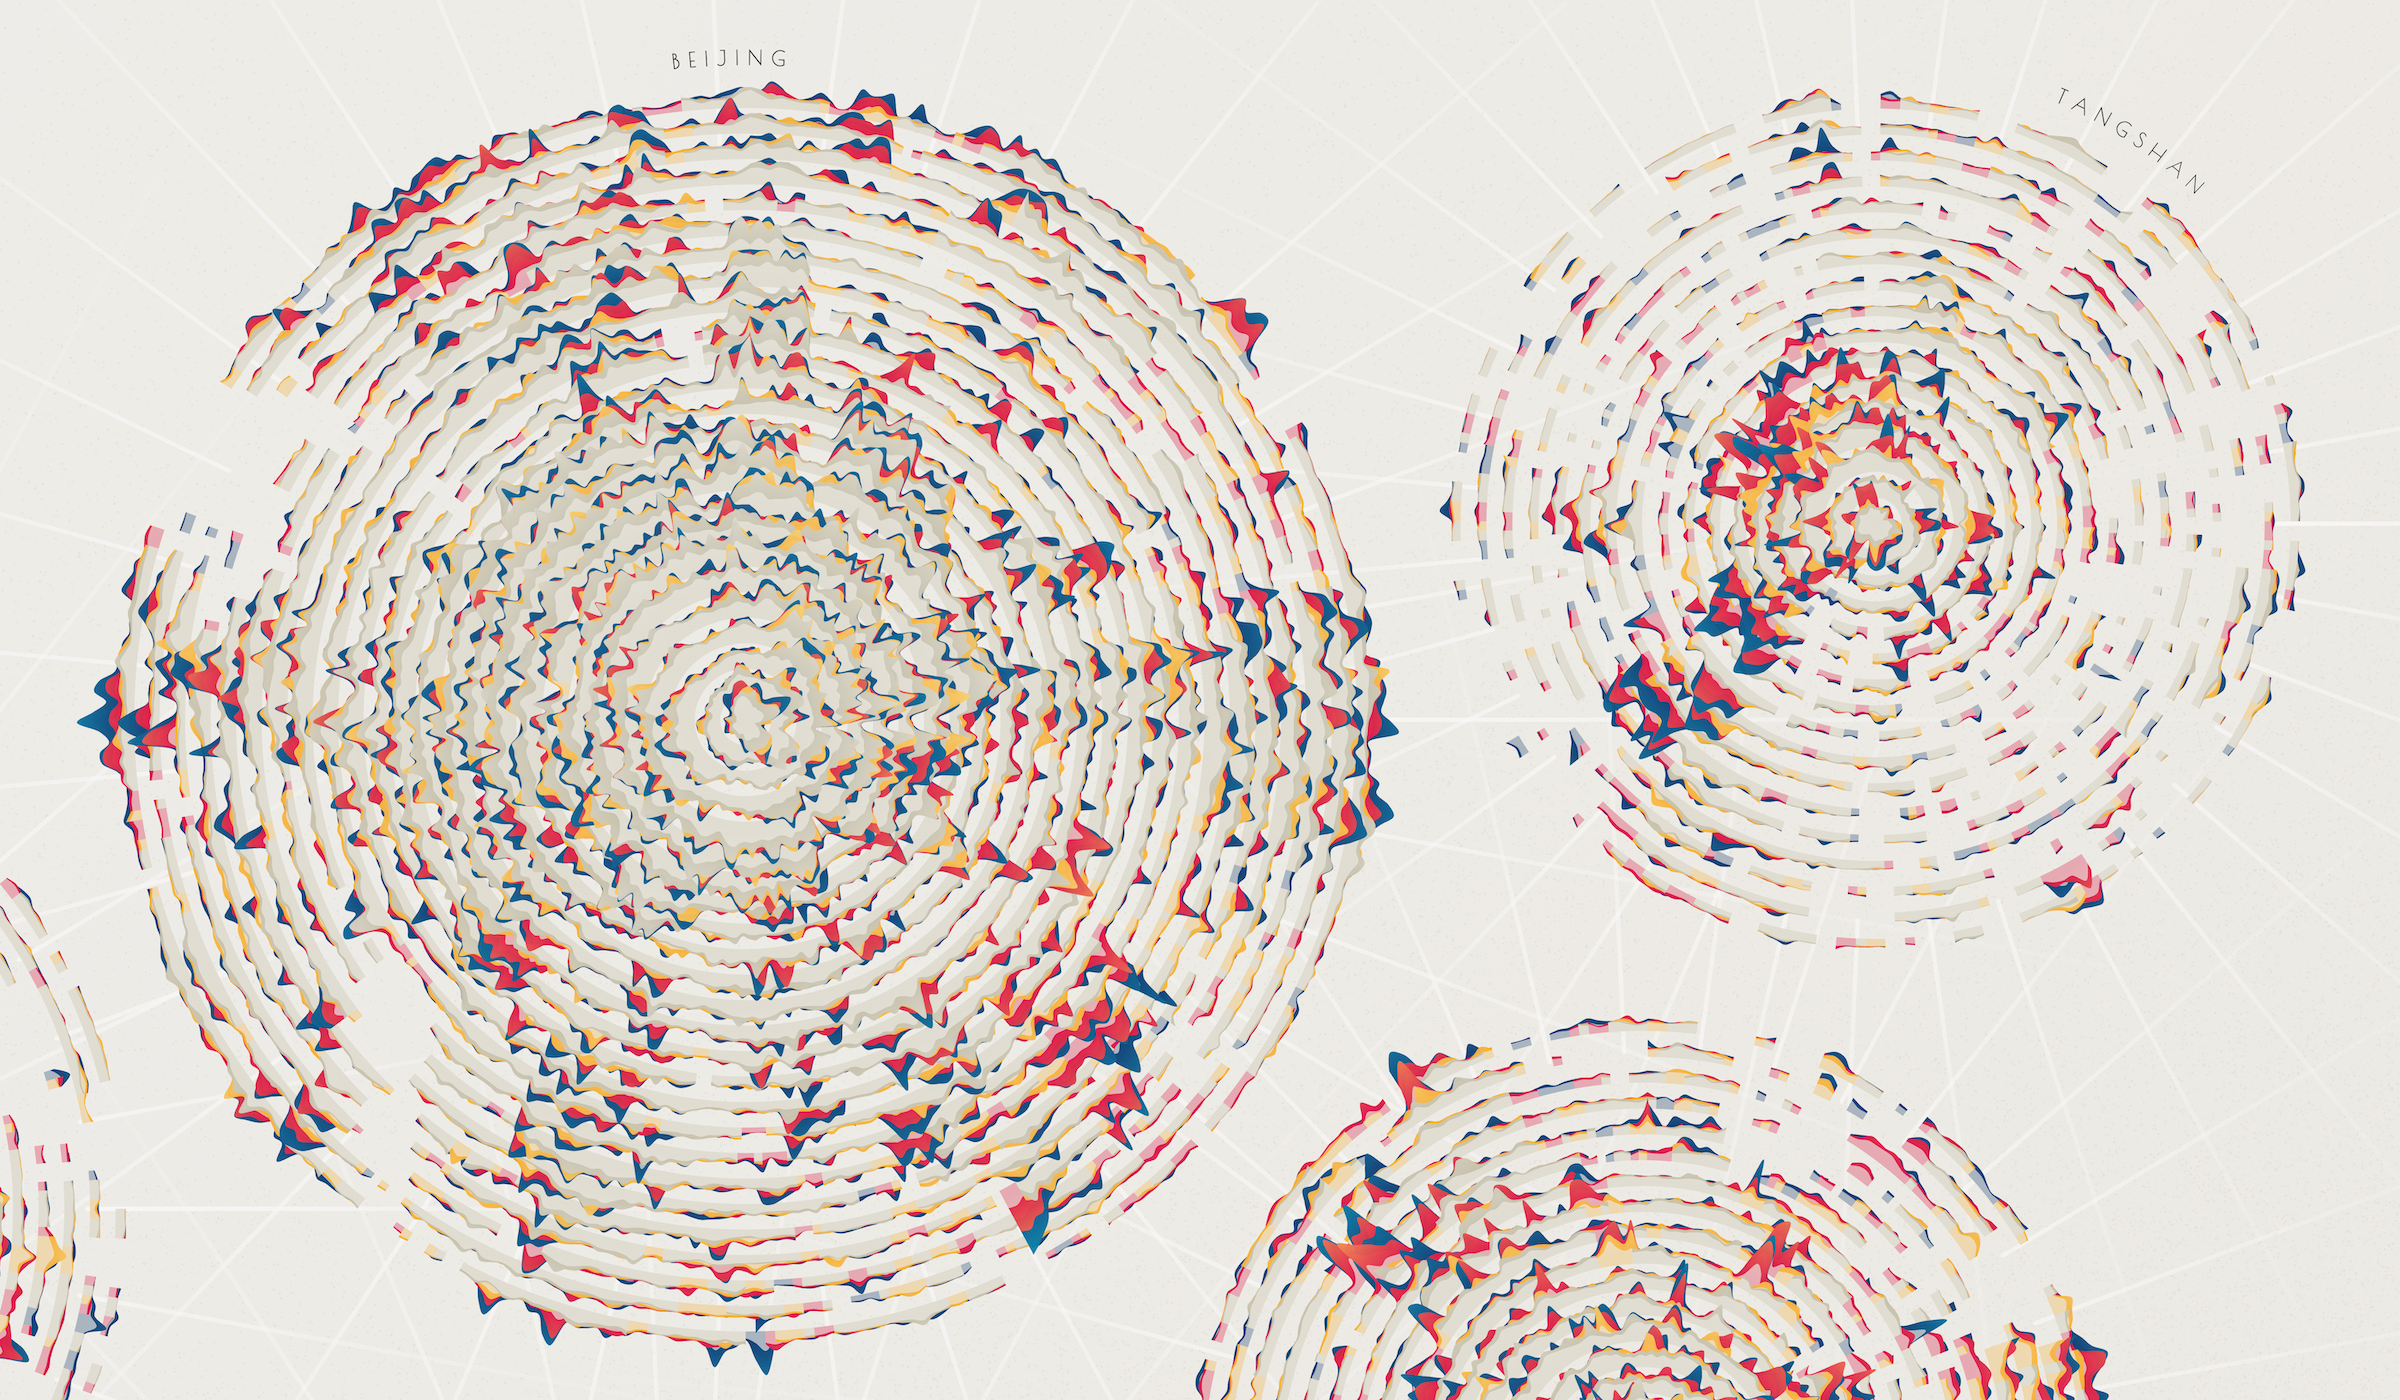
This project was commissioned by the EPFL URBES lab (led by Gabriele Manoli) to visualize findings from their Nature Communications study, “Dynamic roughening of cities driven by multiplicative noise”. The study reveals a fascinating analogy: urban skylines expand outward and upward in a manner similar to natural “growing interfaces” like crystal surfaces or bacterial colonies, all driven by economic productivity.
The goal was to create a piece that wasn’t immediately identifiable as a data visualization, but rather as an art piece. Upon closer inspection, however, the viewer should be able to discern the underlying data trends. The lab wanted to avoid standard charts and maps, seeking something that captured the “organic growth” of a city while keeping its specific morphology intact.
I moved away from standard cartography and toward a radial, “tree-ring” inspired aesthetic. By starting at the center of each city (13 in total) and radiating outward, I could sample building height data across 2005, 2010, 2015, and 2020 from the lab’s high-resolution satellite data (each year is represented in the artwork by a different color).
For readability and aesthetic purposes, I implemented a non-collision algorithm. This ensured each city remained distinct and readable on the final canvas, avoiding the overlapping “messiness” that would occur if plotted strictly by geographic coordinates, while still capturing the individual morphology of each urban center.
The team had this printed and placed in their lab while also using the artwork to accompany their sharing of the publication and findings.