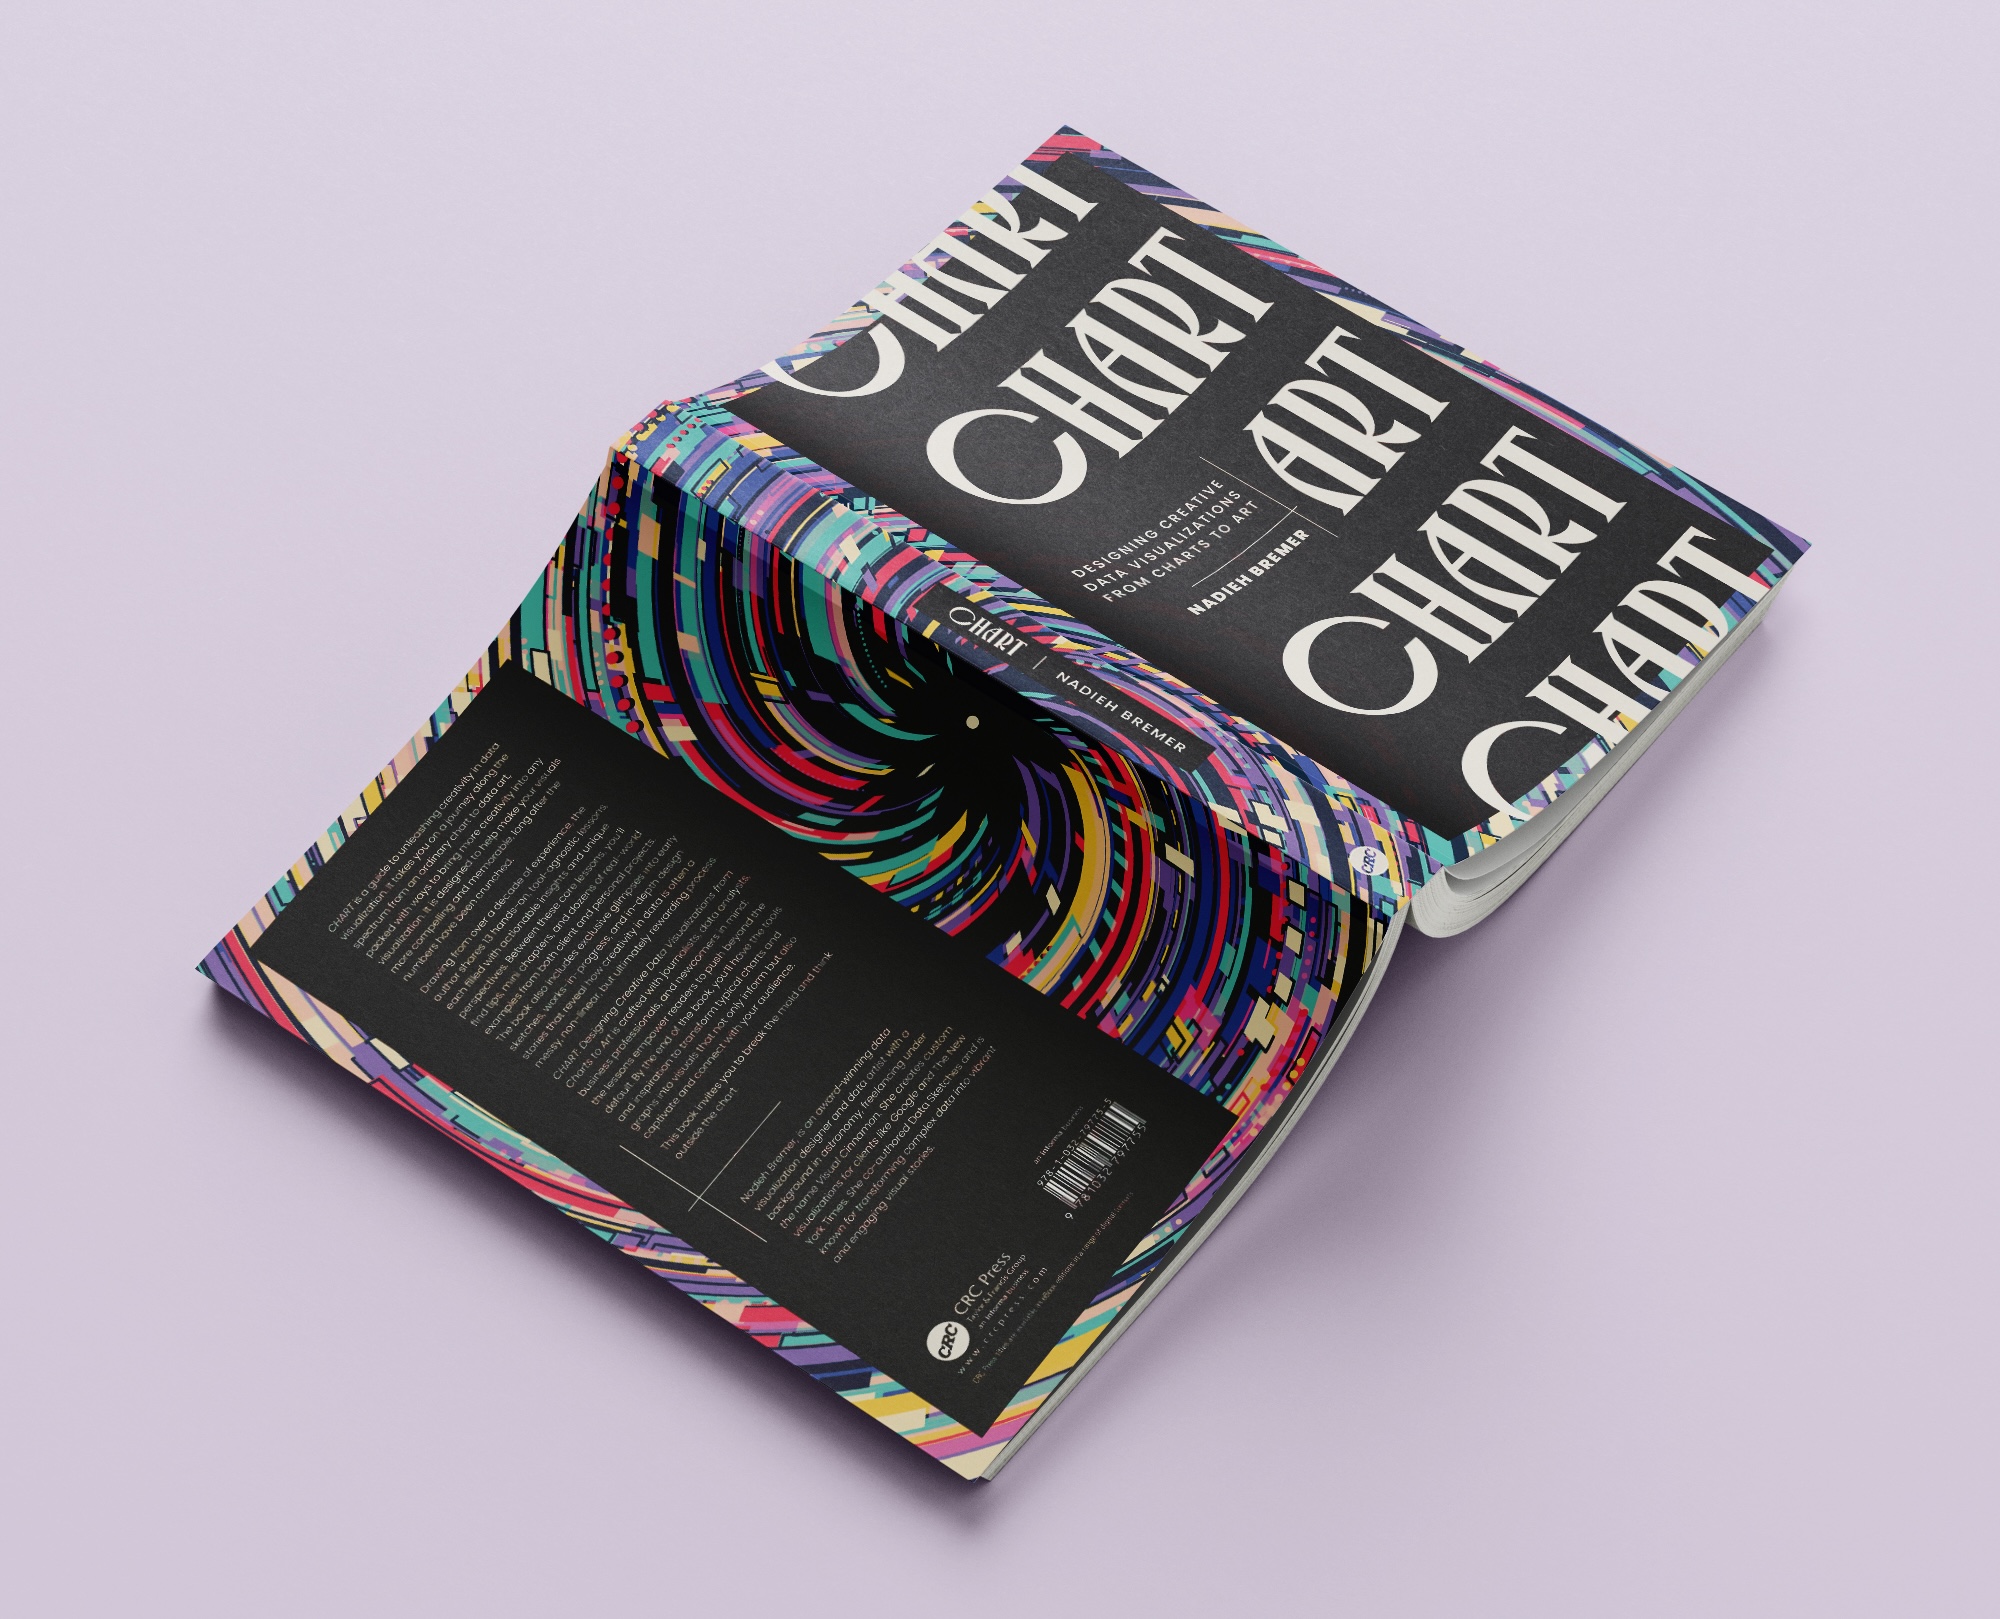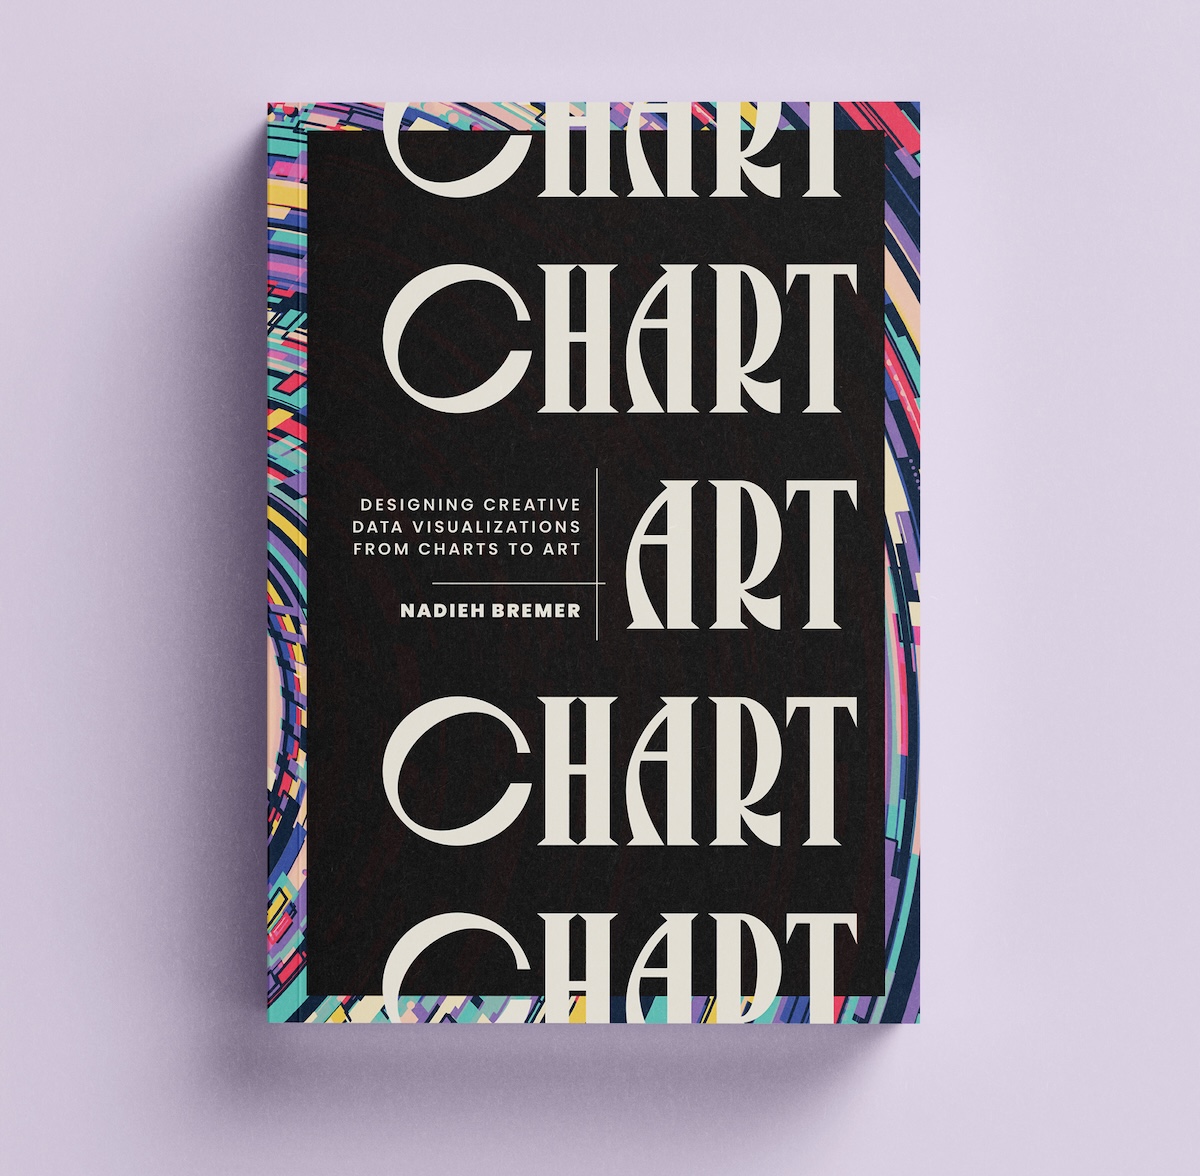
C H A R T
Ready to take your data visualizations from ordinary charts to compelling data art? My new book, CHART: Designing Creative Data Visualization from Charts to Art, is your guide. It’s an invitation to break the mold and unleash your creativity, helping you make visuals that not only inform but also captivate your audience long after the numbers have been crunched.
Drawing from over a decade of my personal and client work, the book is packed with actionable insights. It features thirteen hands-on, tool-agnostic lessons and six mini-chapters, all filled with unique perspectives and my favorite techniques. You’ll see dozens of real-world examples, including exclusive looks into early sketches and works-in-progress, which reveal how a creative approach to data is often a messy, non-linear, but incredibly rewarding process.
Designed for everyone, from journalists and data analysts to business professionals and curious newcomers, this book empowers you to push beyond the default. By the end of the book, you’ll have the tools and inspiration to transform typical charts and graphs into visuals that not only inform but also captivate and connect with your audience. And because I wanted this to be a book you’d be proud to display, the hardcover is beautifully designed to be a piece of art itself, exciting your eyes as you learn.
CHART invites you to break the mold and think outside the chart.
Testimonials
Several experts in the field have said very kind things about this book and my work. Here are some of their testimonials:
“
”
In the evolving world of data visualization, CHART offers a fresh and thoughtful perspective. Having explored similar ideas myself, which I've called Data Humanism, I really appreciate how Nadieh brings her own unique voice to the conversation, embracing complexity and creativity in ways that inspire new thinking about data.
“
”
Through showcasing her exquisite back catalogue of work, Nadieh takes us to the boundaries of the possible. She generously coaches us through what it takes to strive for and achieve the most enigmatic qualities of charm, elegance, and impact. Nobody is more uniquely talented, more evidently qualified, and more capable of inspiring others to unlock their x-factor.
“
”
From sketching ideas to combining chart types and finding inspiration in the unexpected, Bremer brings the process to life with vivid examples, inviting readers to reimagine what's possible when we embrace creativity in data storytelling. CHART is a gift to anyone who works with data — Nadieh's insights will inspire you to experiment, think differently, and create visuals that connect with your audience in new ways.
“
”
Everyone has seen Bremer’s beautiful work and wondered how she came up with yet another creative idea. CHART walks you through her process, revealing her thoughtfulness, attention to detail, and willingness to iterate. Yes, you’ll be inspired by her final products. But your own process of creating data visualization will change by her model. Bremer gifts readers a structure for exploring data to find a story and pulling together a visual influenced by the data.
“
”
Our much-needed antidote to predictable and ordinary charts. Bremer is a luminary of our generation, and this book is a generous invitation into her creative process. Each page is a visual feast, packed with real case studies and stunning visuals from her many client and personal projects. CHART is the essential companion for data designers striving to create beautiful, informative visuals in an increasingly complex and nuanced world.
“
”
CHART is a glorious celebration of the art and craft of creative data visualization—data with soul! I deeply appreciate Nadieh’s relentless creative explorations, pushing past the obvious and embracing a playful sense of wonder. Whether you’re a seasoned designer or just beginning your journey, this book will challenge you, encourage you, and remind you why we fell in love with data visualization in the first place.
“
”
Bremer excels at creating captivating and memorable information-rich data displays. In CHART she provides a series of prompts and recommendations—informed by her own experiences—for other data designers who are hungry for inspiration. If you're stuck in a world of bar charts and line charts and looking to stretch your own capabilities beyond standard visualization forms, this book is for you.
“
”
Bremer has distilled a splendid series of lessons from her deep reservoir of spectacular custom freelance visualization work to show us all how to go above and beyond: beyond the defaults, beyond the basics, beyond the boring, beyond the standard chart types, beyond the same old stuff, beyond the simplistic, beyond our previous limits! This book will inform and intrigue every designer, from fledgling to veteran, through Nadieh's thoughtful yet approachable voice.
A Free Look Inside CHART
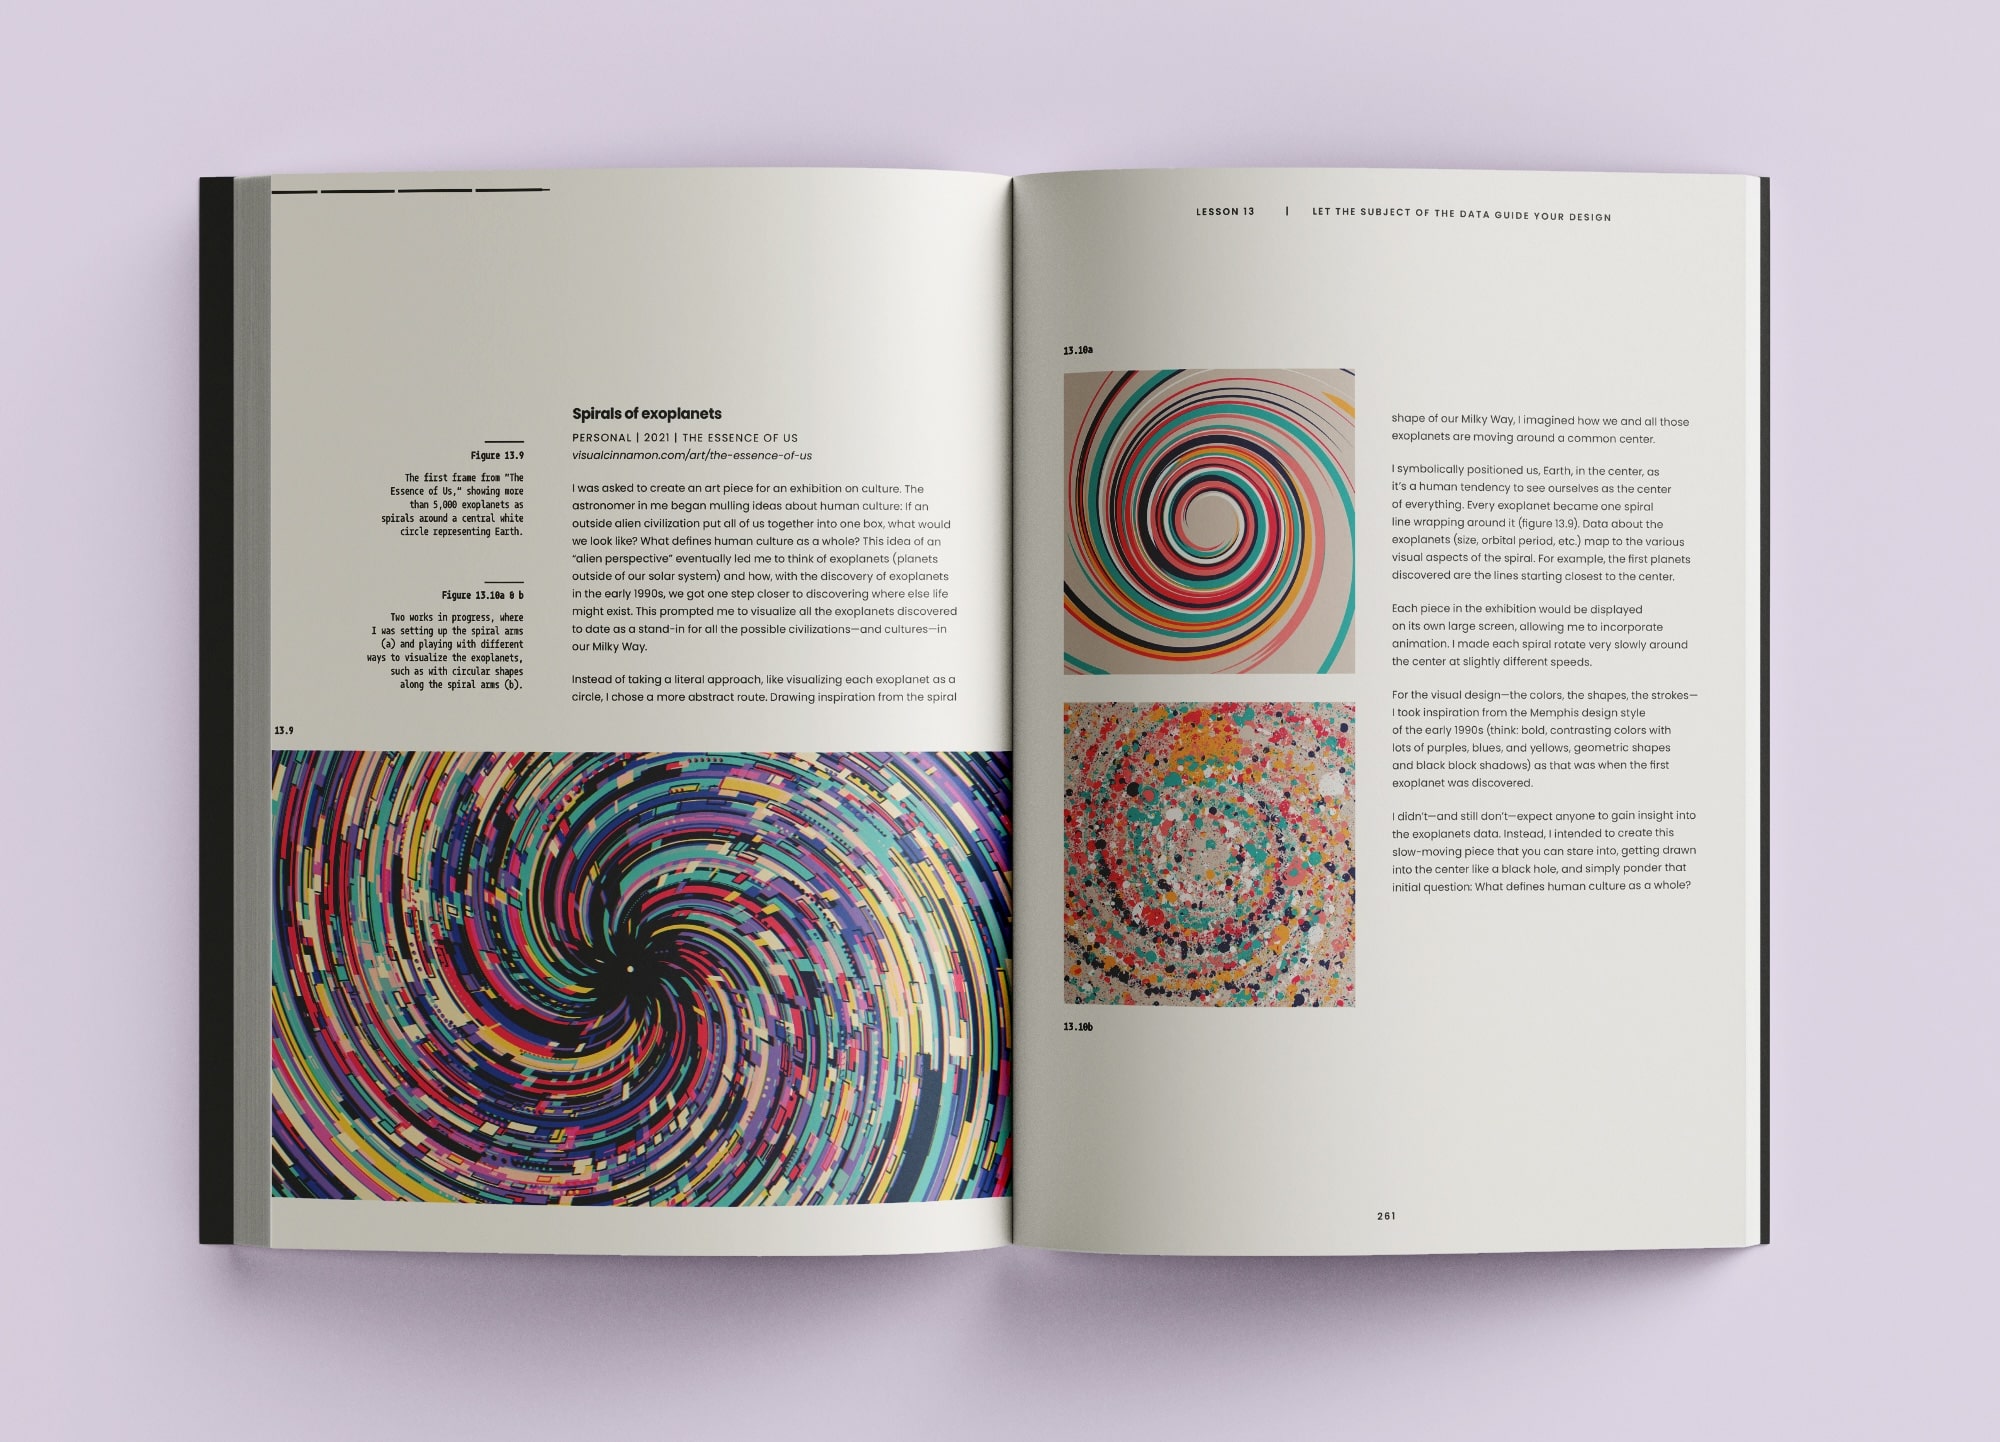
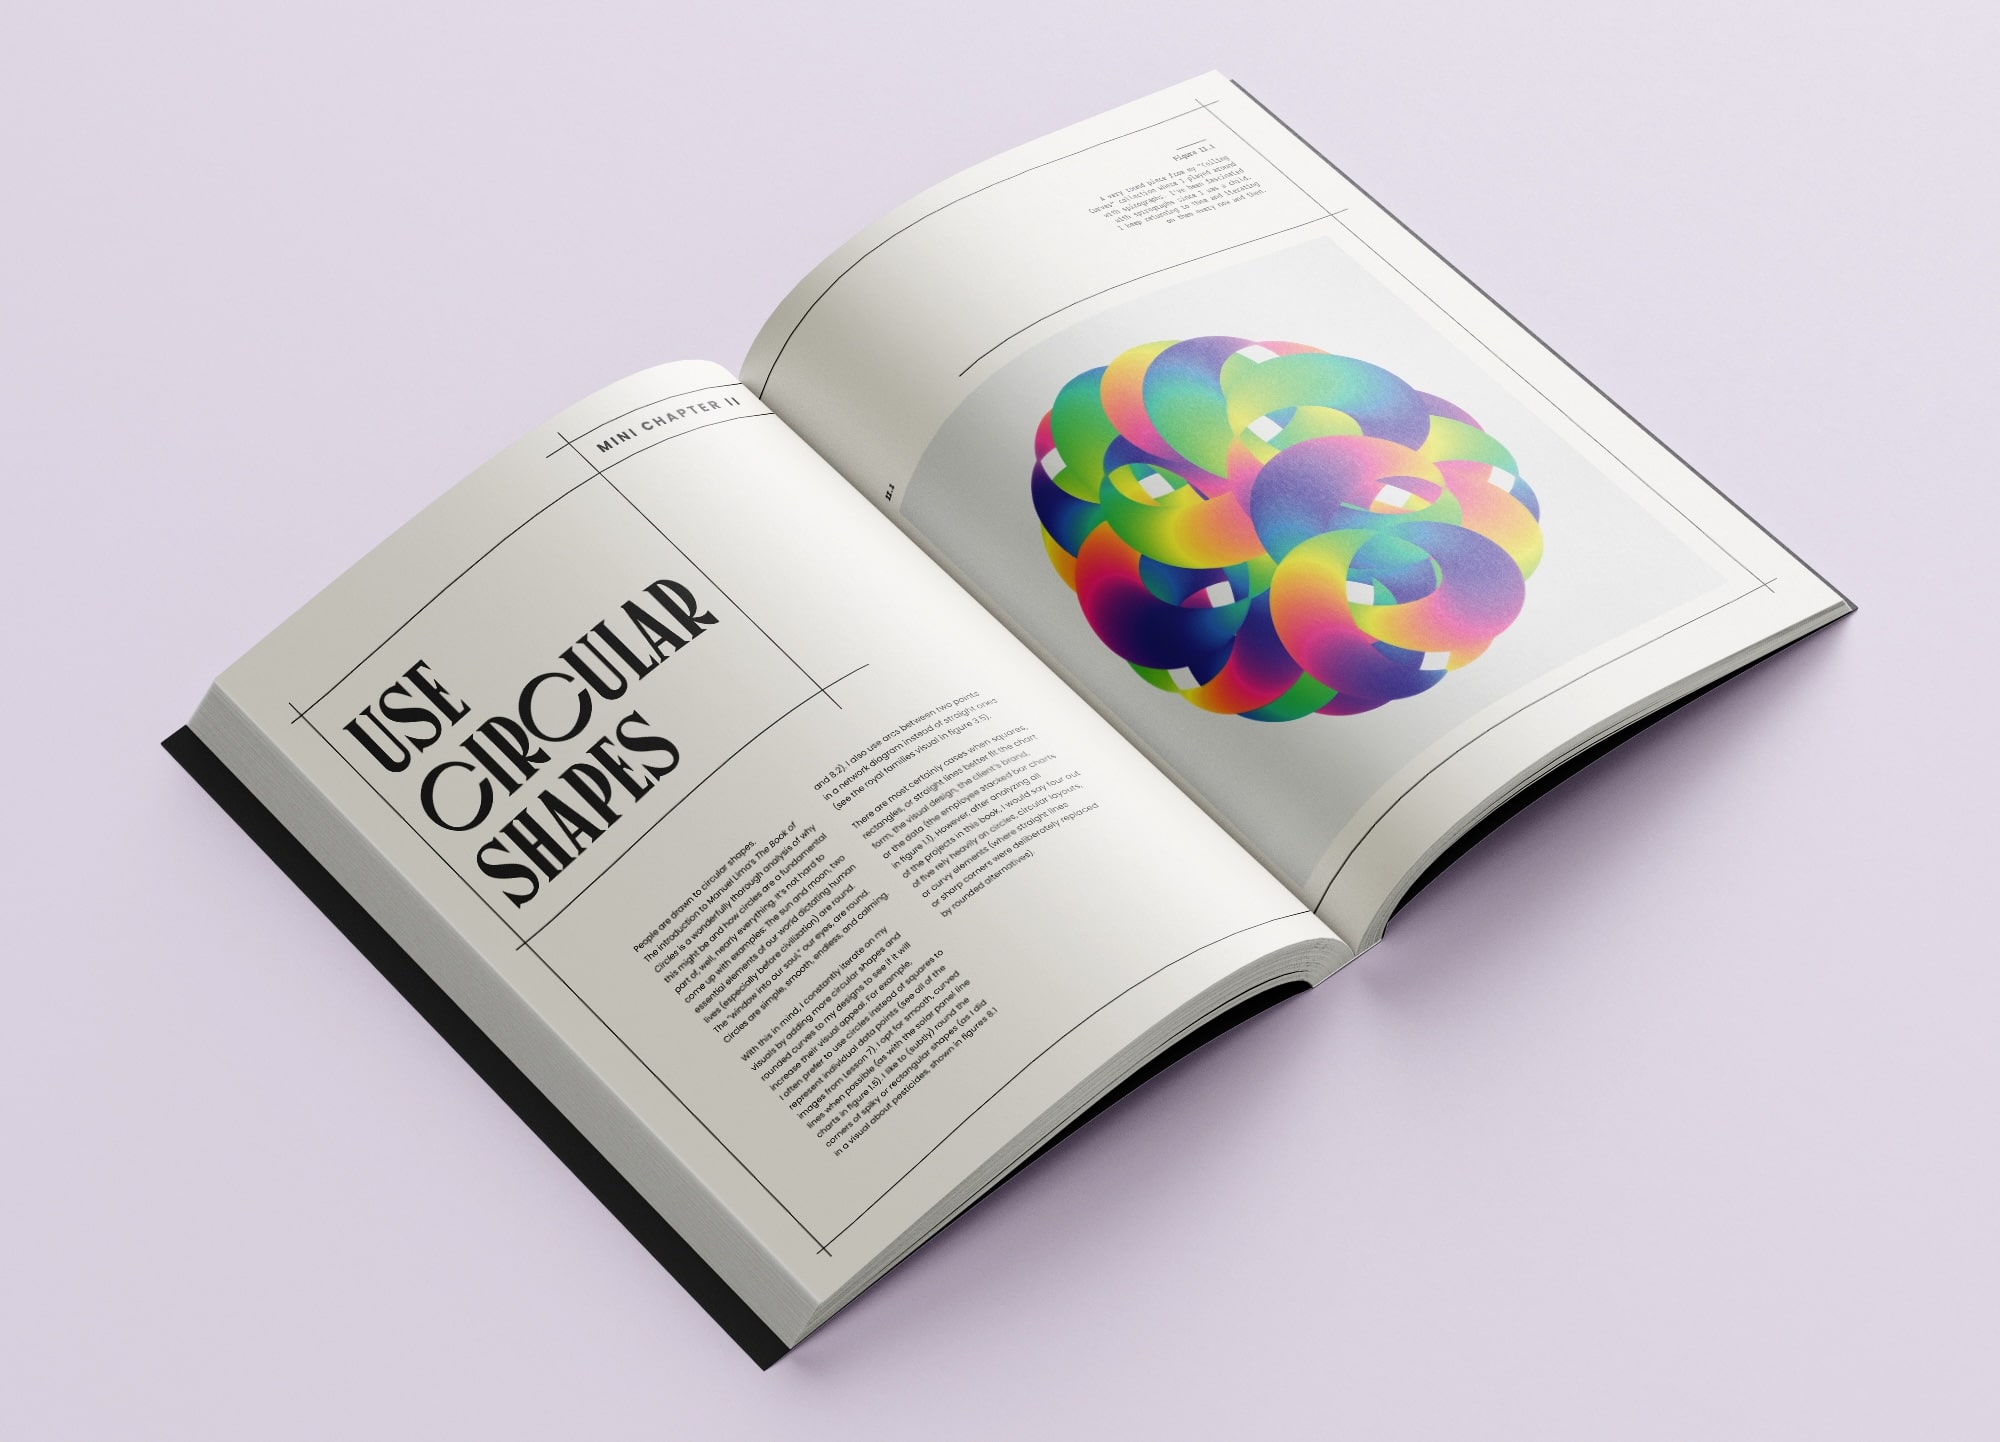
Get a taste of what’s inside CHART with this exclusive preview. The sample pages include the table of contents, so you can see the entire journey from straightforward data visualization to data art. Next, dive into the first full chapter, Staying Close to Ordinary Charts, to learn how to make even the most straightforward charts more effective, beautiful and memorable. Then, jump ahead to part of a later chapter on Showing All of the Data and part of a mini-chapter on more refined color use. Hopefully these glimpses will show you what CHART has to offer and see if it intrigues you enough to want to learn more.
You can also find more information about CHART in this extensive review by Neil Richards or hear me talk about CHART in this Storytelling with Data podcast episode, providing further insights and perspectives on the book’s lessons and inspirations.
You can get your own copy of CHART directly from my publisher here!