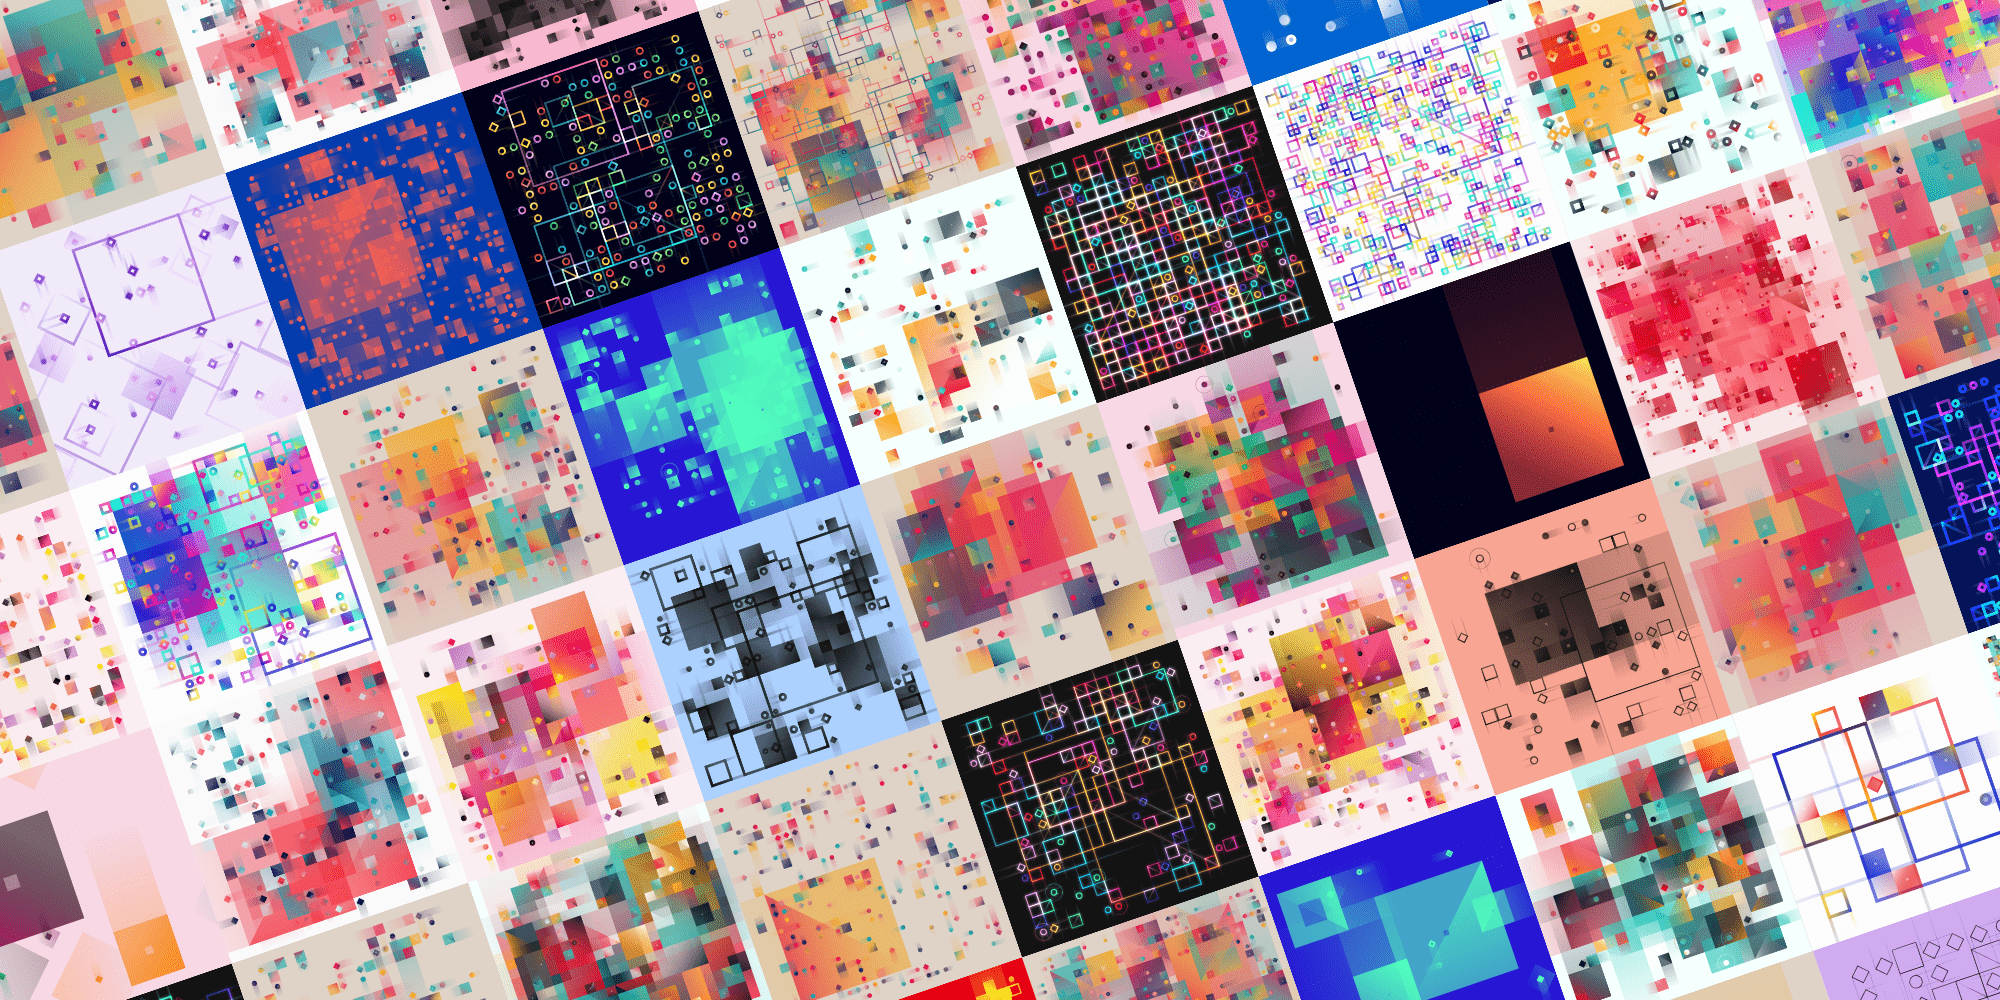
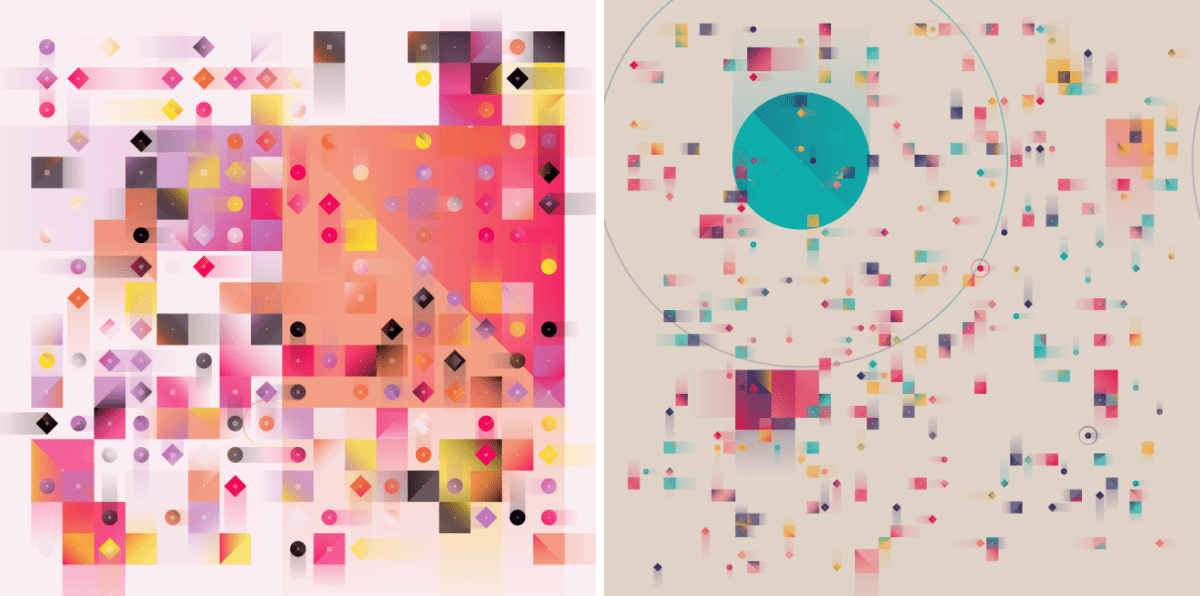
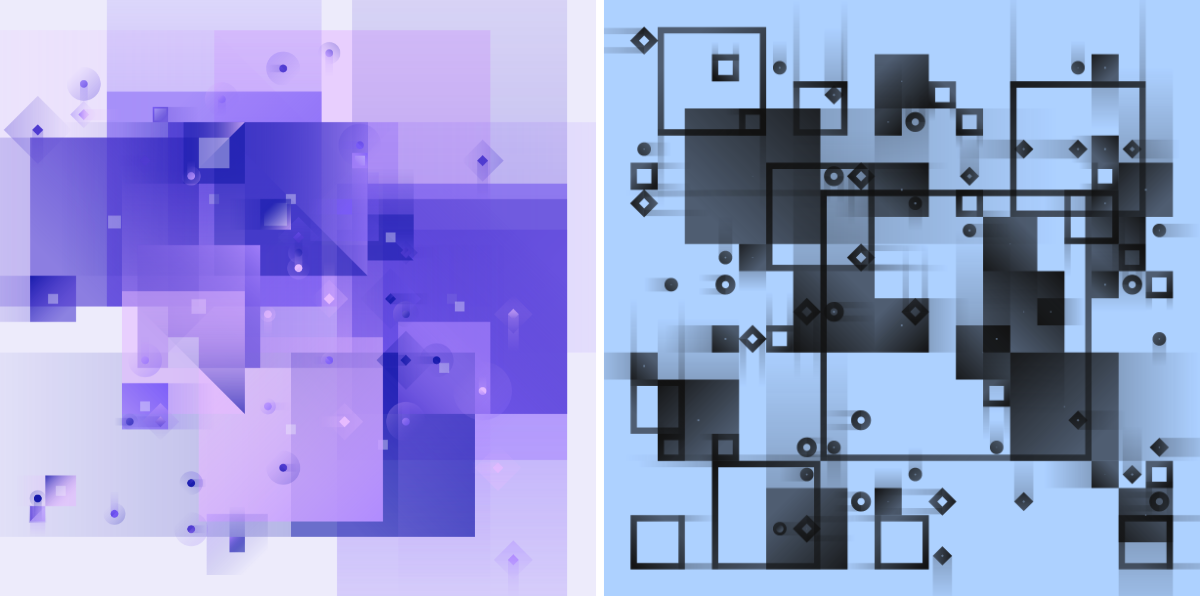
“Wanderlust” is a data art + generative art project, a BlockStyle, that I created for EthBlock.Art. My algorithm takes the transactional data from each Ethereum block in the blockchain and converts it into a unique, but deterministic, image, visualizing several aspects of each transaction.
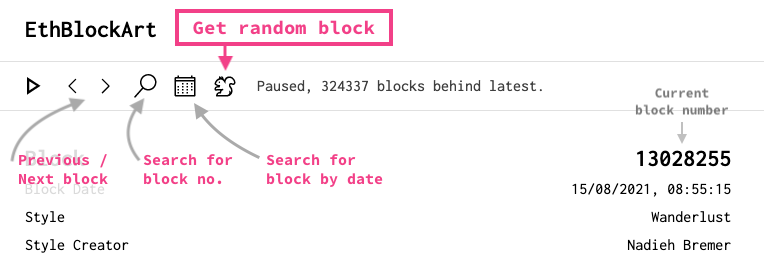
You can browse the Wanderlust collection and mint the block you like by going here (use the squirrel icon along the top-left to see new random blocks/images).
In case you’re interested to get a mint, this goes a little different than usual. Instead of simply pressing a “mint” button, you’re invited to browse through the Ethereum blocks beforehand until you find a block whose visual style you like (use the squirrel icon in the top-left to randomly go through blocks). There are then also four different modifiers that control the fine-tuning of the final mint along the right of the page to really turn the block into your perfect image.
EthBlock.art is a collaboration between artists, the Ethereum blockchain, and the minters. It aims to create an ecosystem of styles visualizing Ethereum blocks, either using pure generative art, or also incorporating the data aspect of each block. Read more on this FAQ page in case you want more details about the platform.
Because the description on the project page itself can only hold so many characters, I wanted to use this page to explain all the details in how I turn the transactional data into visual elements.
From Block Data to Data Visualization
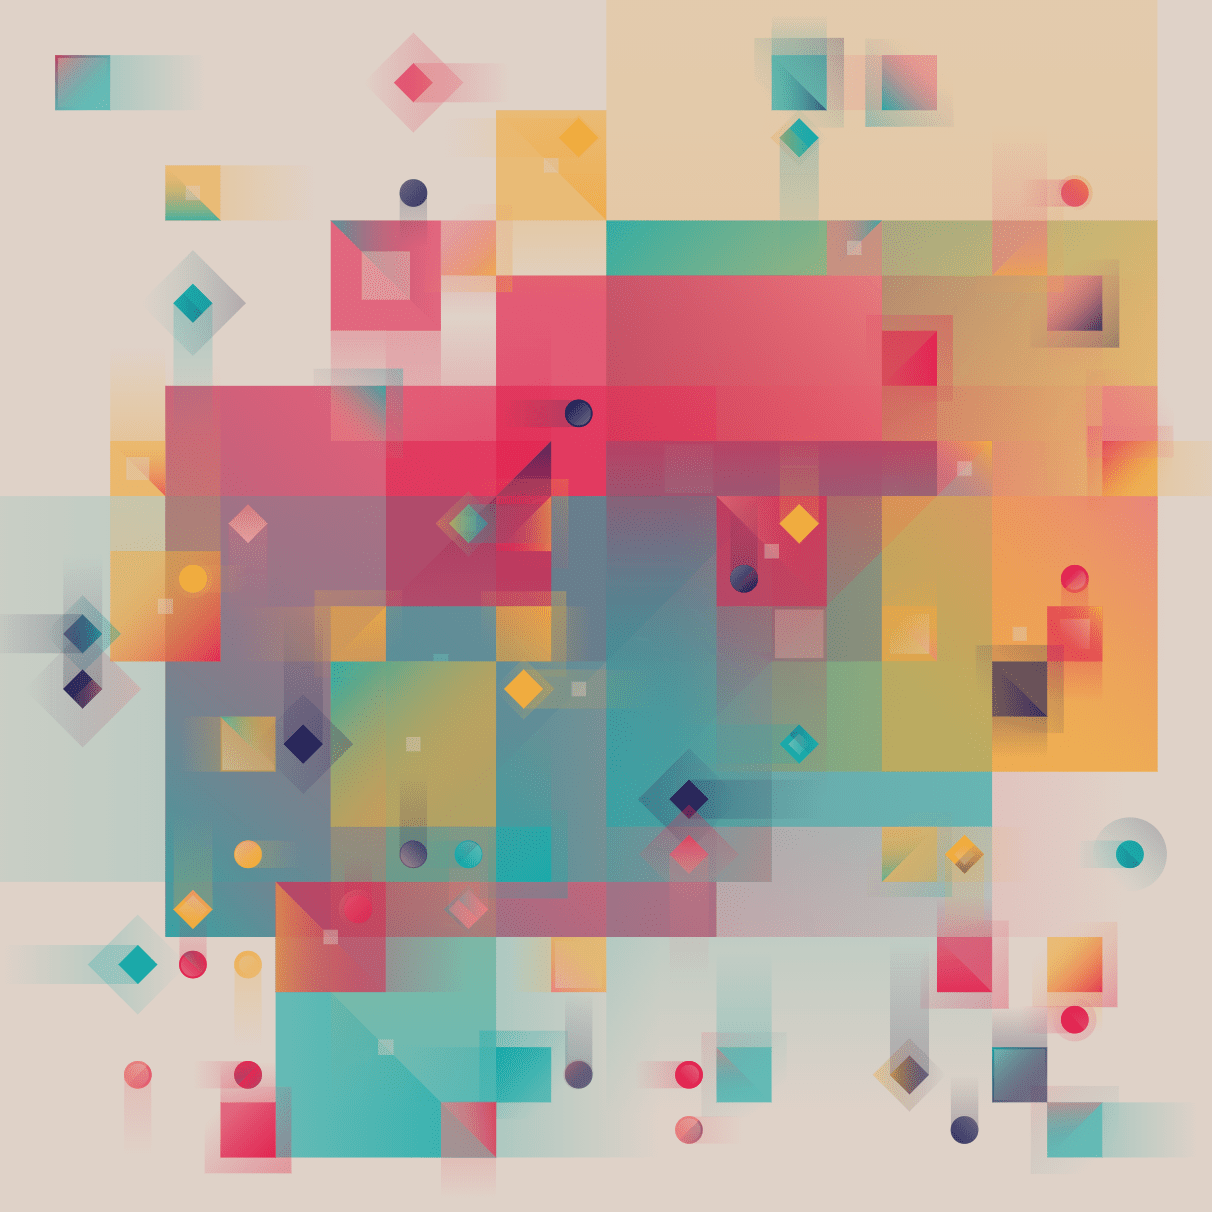
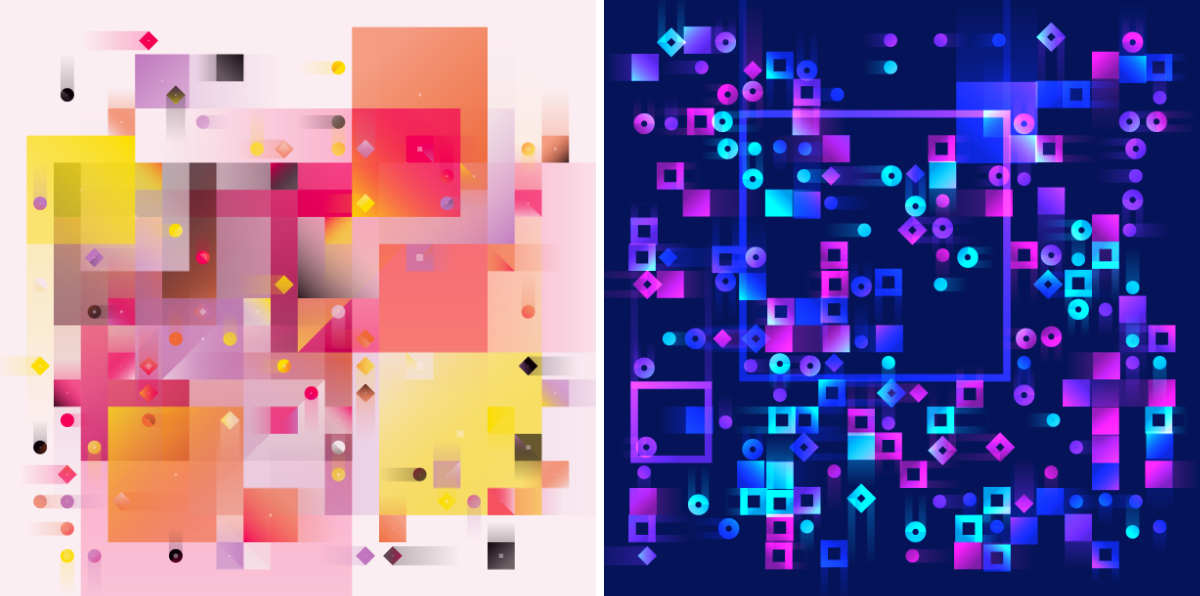
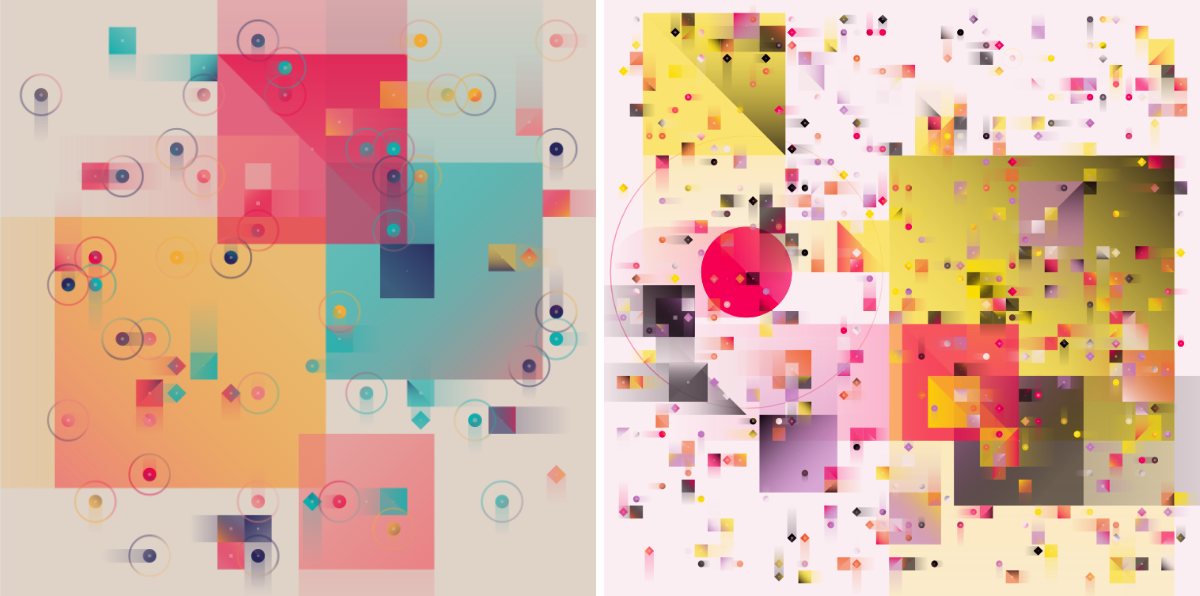
Each visual is a representation of the transactions of the Ethereum block. In short, squares represent transactions where ETH was transferred, sized according to the amount. Circles are ERC-20 transactions (a pulse marks an NFT), diamonds are all else. The approximate transaction fee (the gas) is plotted on top of each transaction, some barely visible, some forming shapes larger than the tx itself. And finally, everything is scaled to the largest ETH transaction of the block. For a much more detailed explanation of the data side, see the The Visual Data Encoding section at the end of this page.
You can literally take the block number that you see in the top-left of the EthBlock.Art page and search for it on Etherscan to see all the details of the underlying transactions.
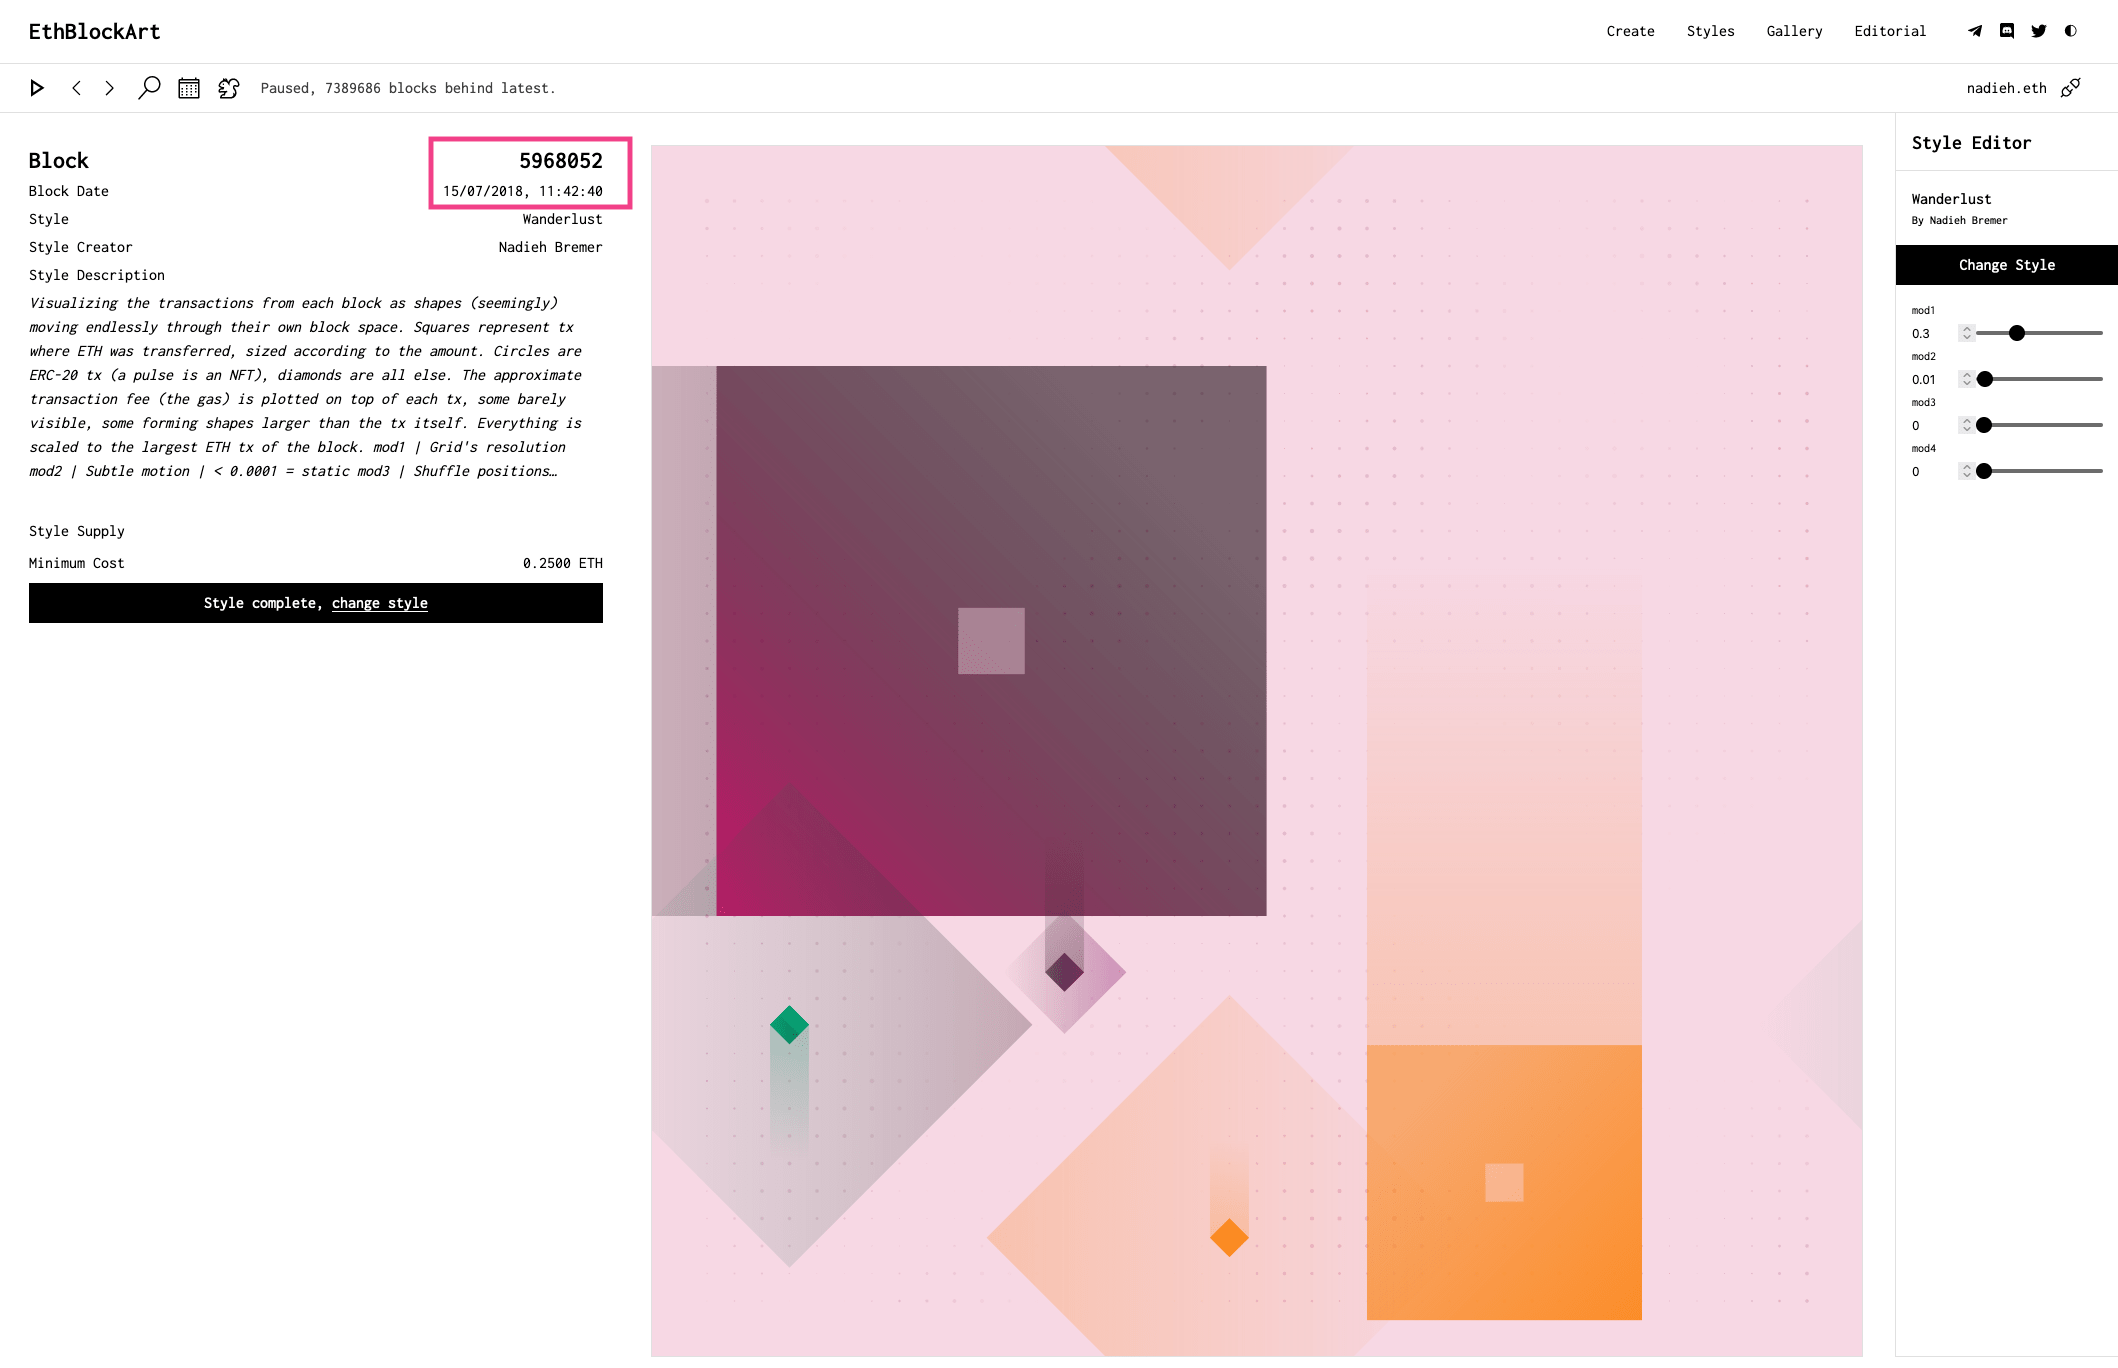
For example, the block from the image above, block 5968052, can be found here on EthBlock.Art. It’s clear that there are 5 transactions in this block. If we then look for 5968052 on Etherscan, we get the following result:
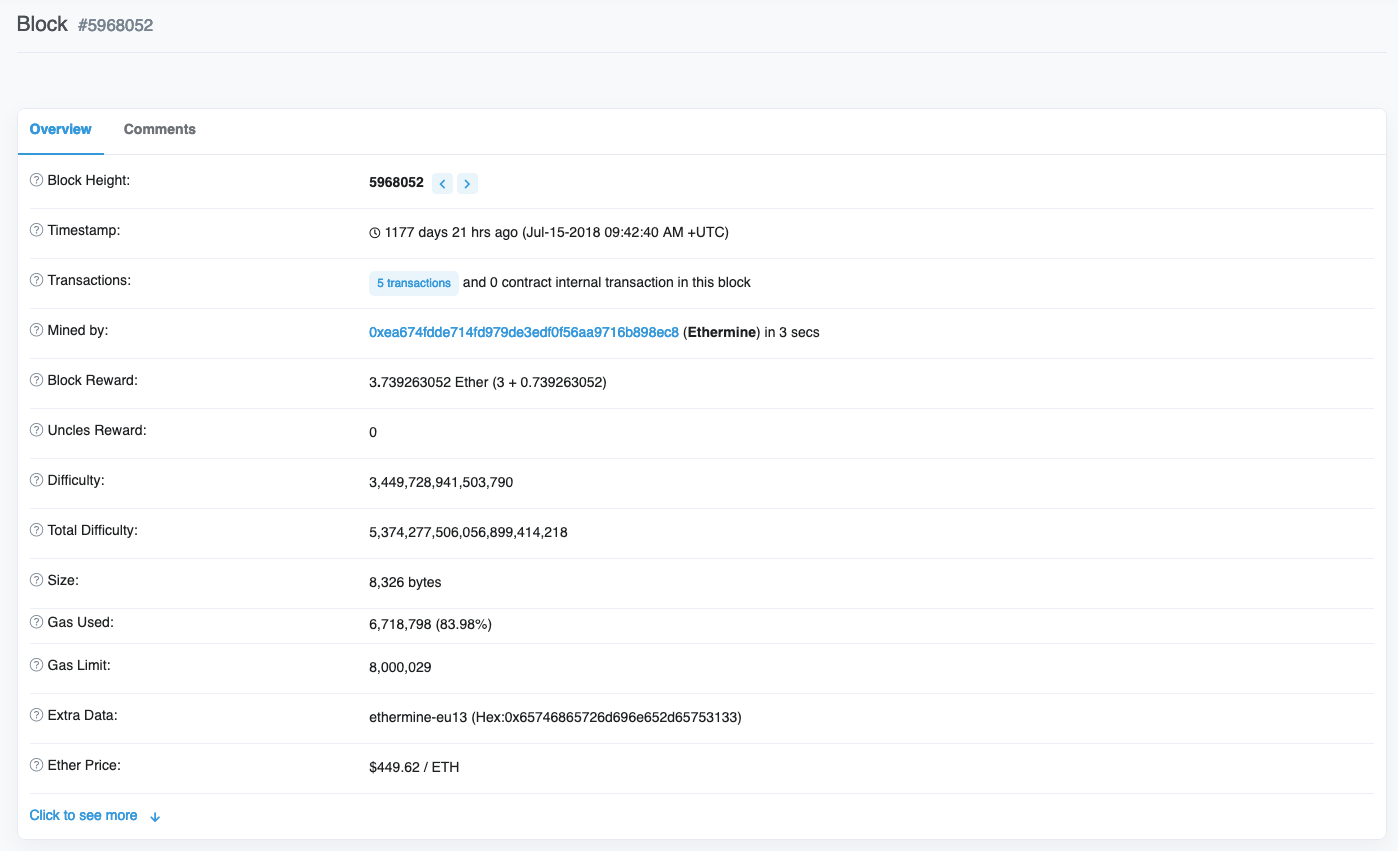
Clicking on the transactions shows all the details from the transactions in the block. From the visual itself, I already knew that there had to be two transactions where Ethereum were transferred, since there are two rectangles. And three transactions without any Ethereum transfer, but that weren’t marked as an ERC-20 or NFT, since these are diamond-shaped. And this is exactly what the information on Etherscan shows:
Etherscan has much more information about the transactions, so if you want to know more about the transactions in the block you’ve minted, I’d suggest going through the transactions list there.
You can also work the other way around. I used Etherscan to find my first Ethereum transaction, looked up the corresponding block number, and minted that block as one of my test mints.
Or you can try and find very special transactions. Looking at the contract to which all CryptoPunks are connected, I found a transaction for 450 ETH (!) done only 1 day before I wrote this. I can take the block number, 13347271, and fill it into the block search on EthBlock.Art (the little magnifying glass) to see the resulting visual with one humongous pulsing circle, being the CryptoPunk transaction.
Visual Styles
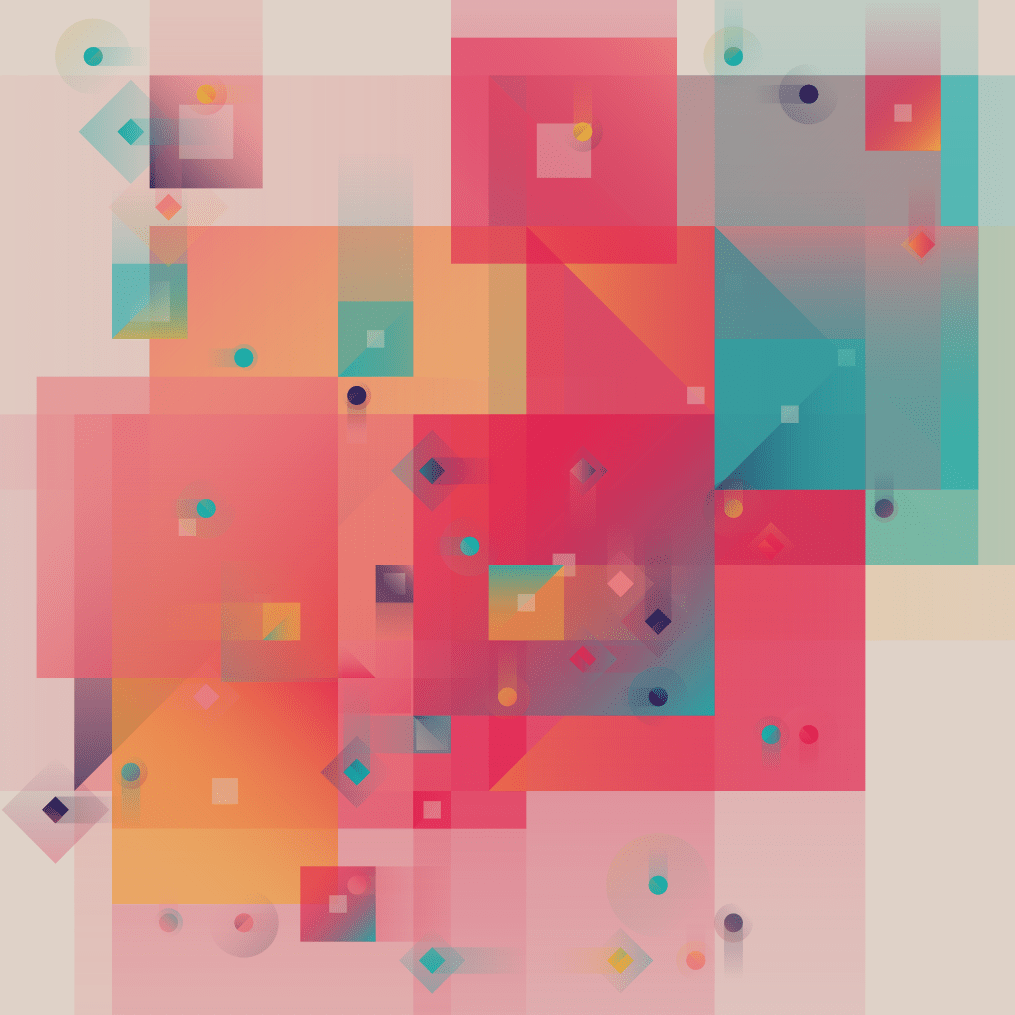
My approach for this project was to let the data, the transactions, be as important to how the visual looks as any purely visual design aspect that I could think of.
I hope it’s the data that might make things special, or even personal to you. A giant CryptoPunk sale, a field full of CryptoKitties, more transactions than the grid can really handle, the block containing your own first Ethereum transaction for example.
Shape Modes
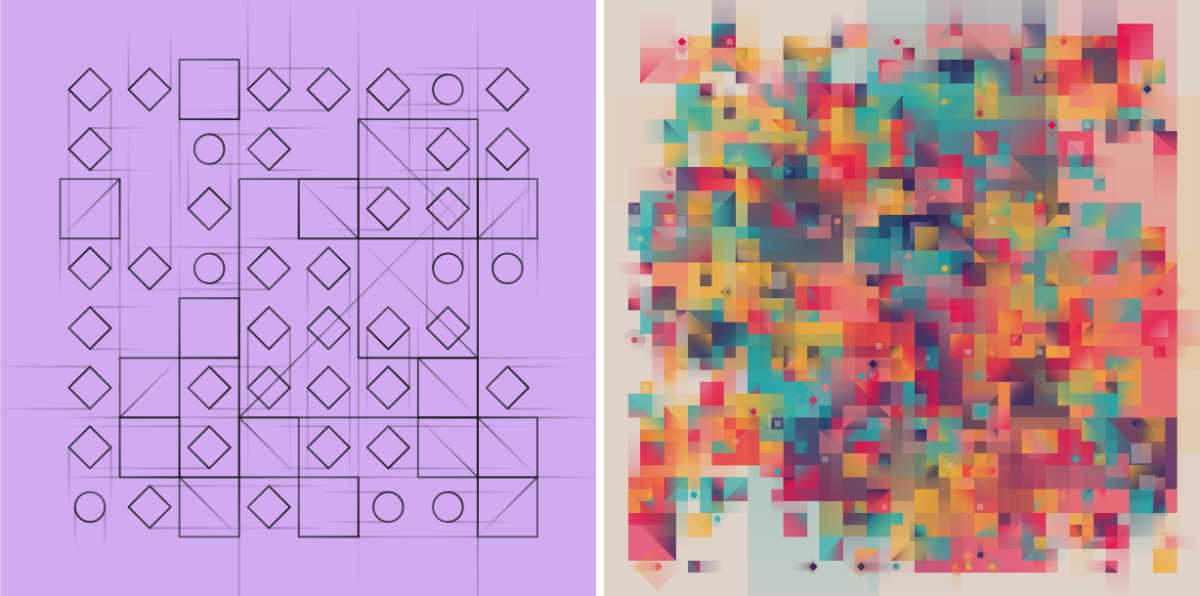
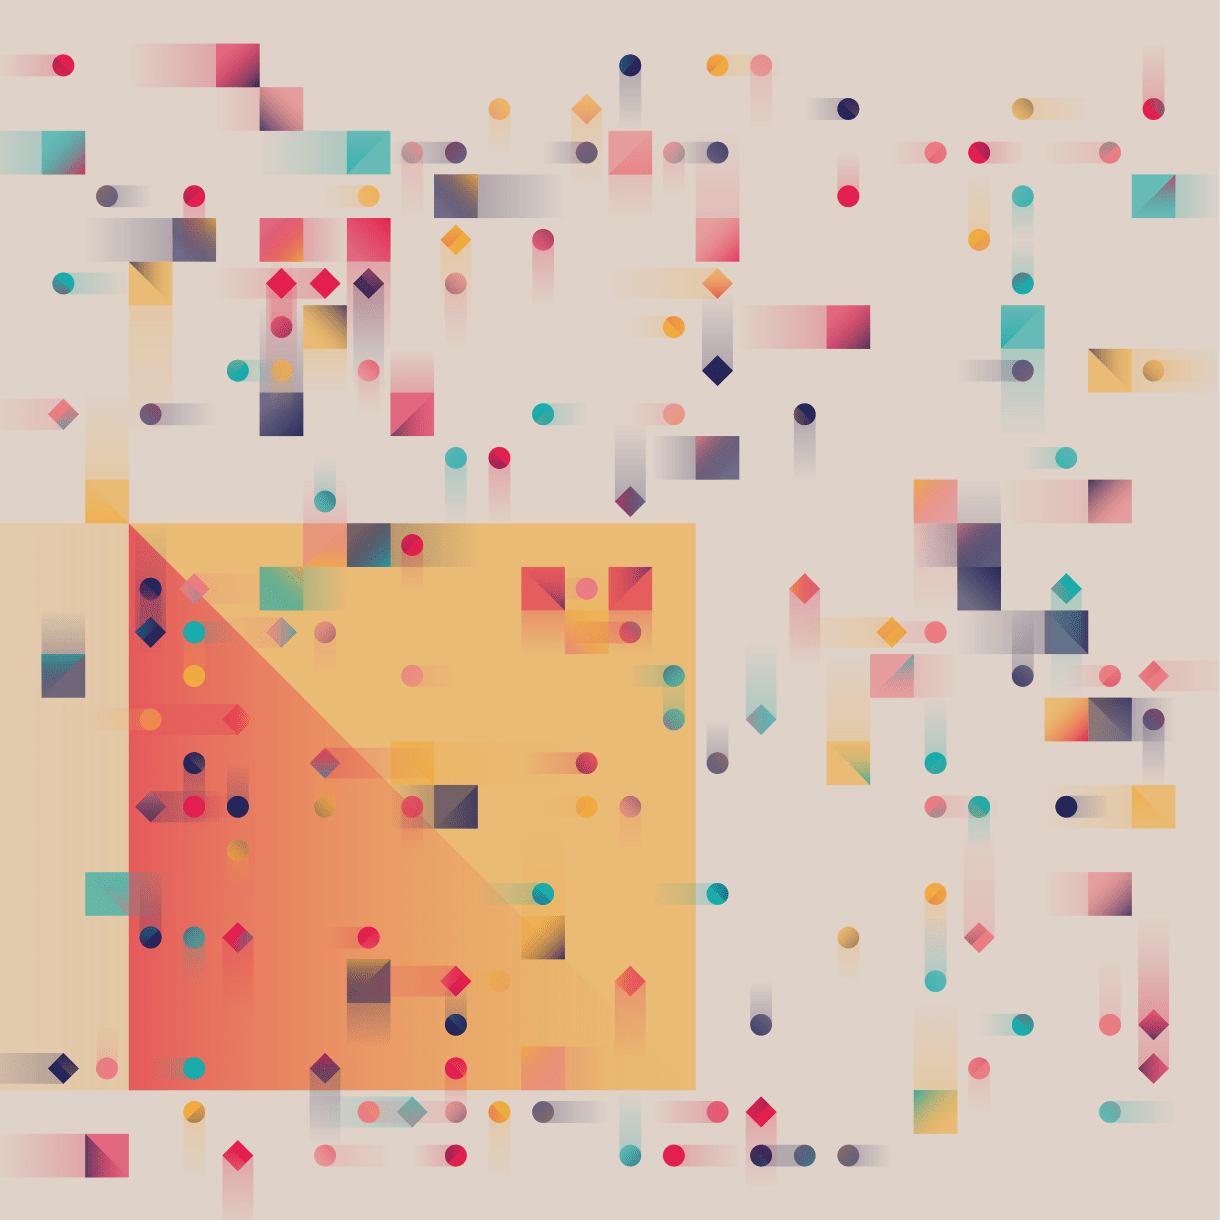
Besides the data itself one of the main visual aspects is the shape mode. There are three modes; Solid, Hybrid, and Wireframe.
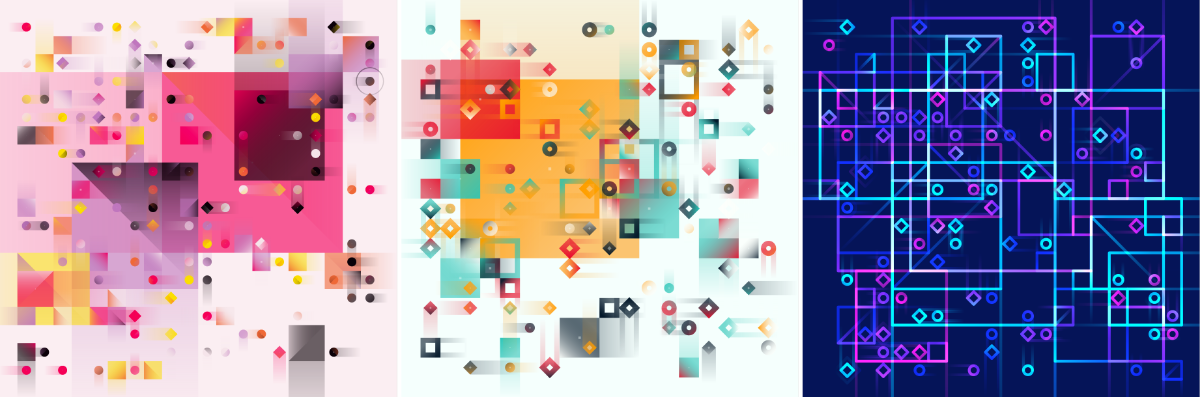
The line width of the Wireframe and Hybrid modes is randomly chosen. However, there are a few small differences between these lines. For example, with Hybrid the strokes of rectangles are pulled inward so the size of both a stroked and filled rectangle nicely aligns. Furthermore, the corners of the stroked shapes in Hybrid are sharp and angled, while they’re rounded for Wireframe.
Color Palettes
There are 19 different color palettes. About 75% of these have their color palettes fixed, such as the Chaos palette that I started this project with.
I was inspired to use this approach by Matt DesLauriers’ color use in his sublime Subscapes project.
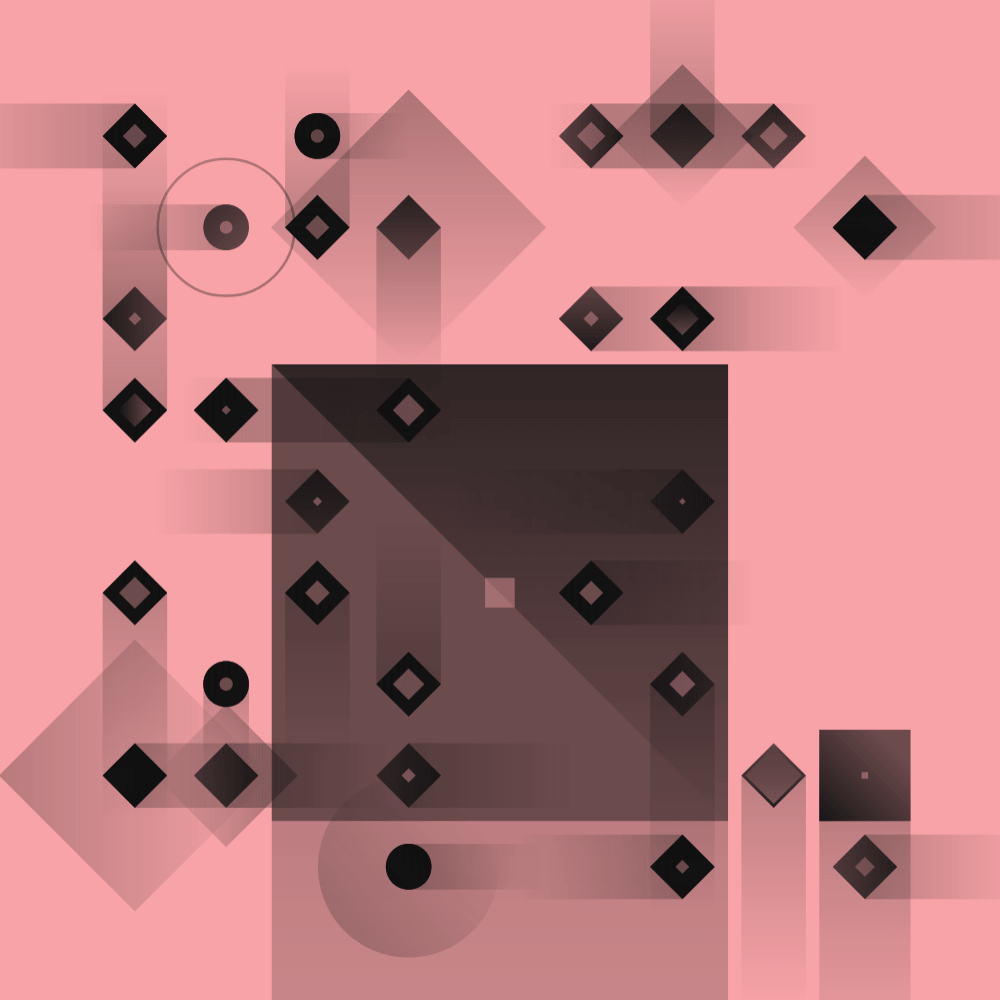
The remaining palettes use randomly generated colors to determine part, or even the whole color palette used. For example, One hue randomly picks a hue and creates a color scale with dark and light versions from it. Or Onyx that will always show black shapes, but the hue of the pastel-like color background is determined randomly from the transaction’s hash.
I’ll eventually update this page to show how all 19 different color palettes look. I hope each one will be present in the final set, but who knows, maybe some are just not picked ┐( ̄ヮ ̄)┌
Modifiers
There are 4 modifiers with which you can fine-tune the look of the block / image. You can find these along the right side of the image. You can continue making changes to these modifiers even after you’ve minted the block.
- Modifier 1 | Grid resolution | All the shapes are drawn to an underlying grid. You can control how big this grid is with this modifier. See the section below for a more elaborate explanation.
- Modifier 2 | Speed | Even as a completely static image, there is a feeling of motion in the shapes. With this modifier you can choose to actually make them move. The speeds remain quite slow though, it’s meant to be subtle. If the value is smaller than 0.0001 the image will become truly static, which you CPU will be happy with.
- Modifier 3 | Shuffle positions | With this modifier you can choose between 10 randomly distributions of all the shapes across the image, in case the default one just wasn’t it.
- Modifier 4 | Shuffle colors and shadows | This modifier lets you shuffle the colors, shadows, and gradients of all the shapes in 20 different ways. Again to really find that perfect combination of it all.
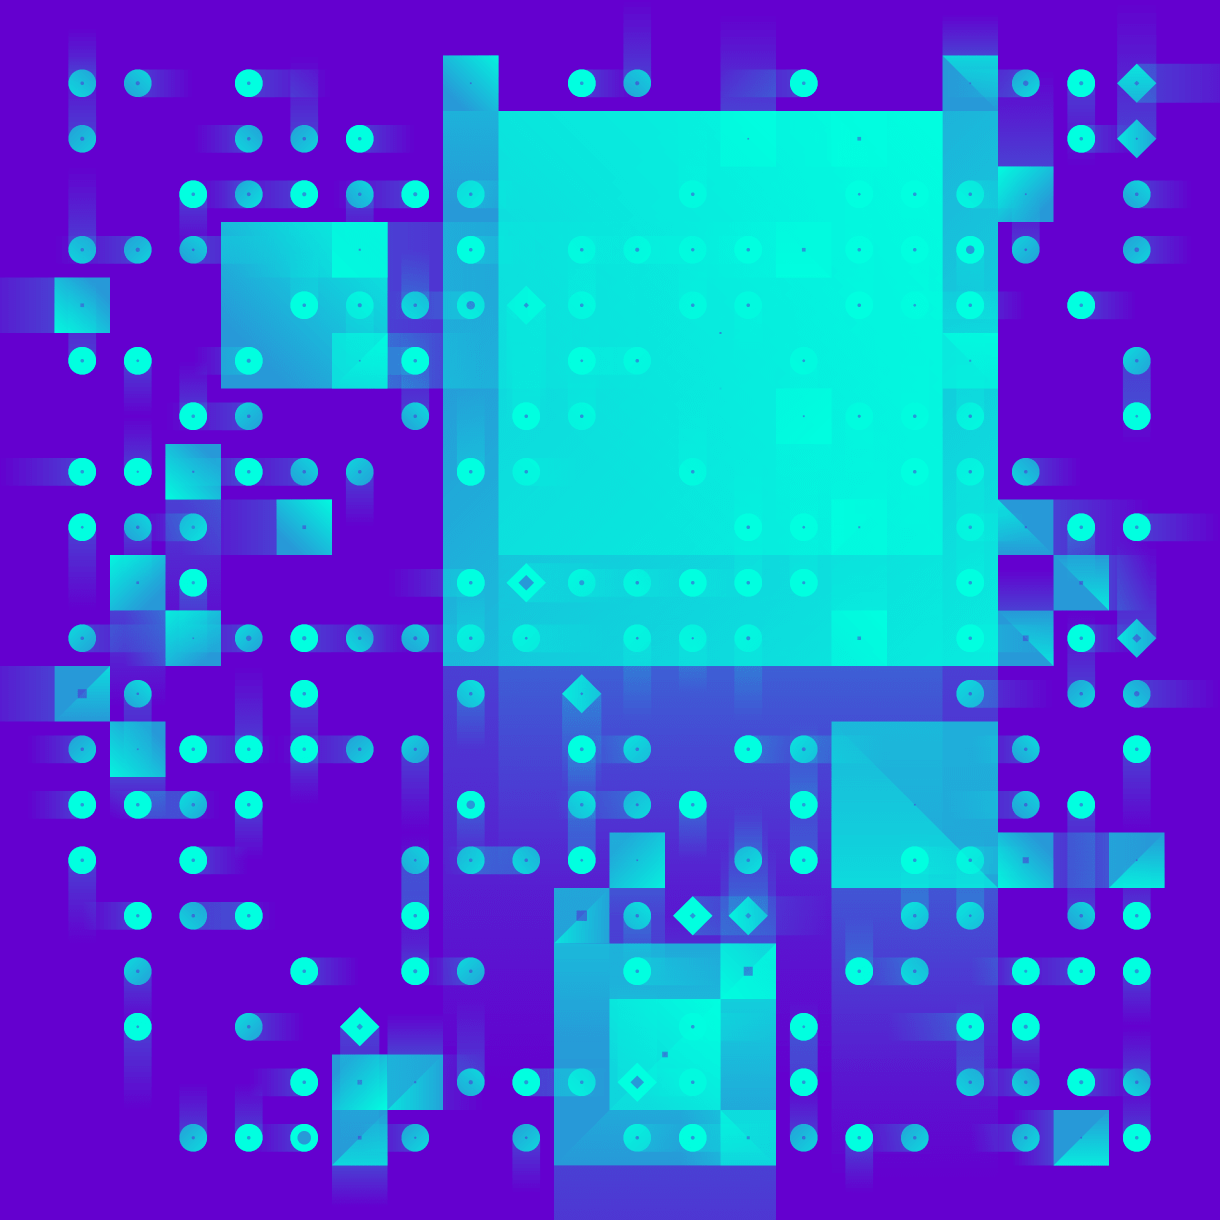
Grid Resolution
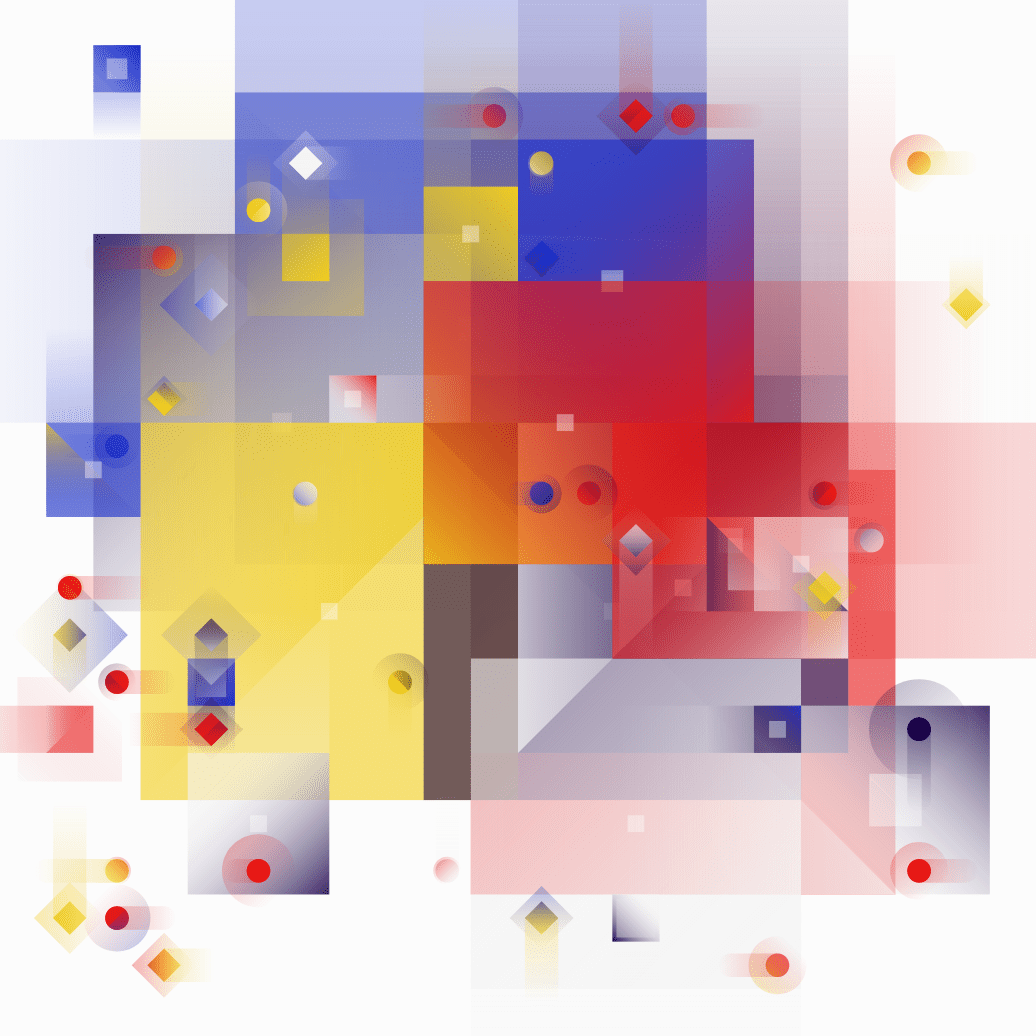
You will have control of how “big” the underlying grid is that all the shapes are drawn within with modifier 1. All the way to the left and the grid will be 8x8 cells. All the way to the right and its size will be 46x46 cells.
This modifier can have quite a big impact on how the visual will look. I hope you’ll have fun playing with it to get the block to look like you want.
I personally love the “chunky grid” look for blocks with fewer transactions, while the largest resolution can create quite the color interplay for blocks with hundreds of transactions (especially when there is quite some diversity in the ethereum values transferred).
The Visual Data Encoding
This being a project that blends data visualization, data art, and generative art, I have to find a good balance between wanting to show the data absolutely correctly, and making something visually appealing, even without any context given.
Let me explain exactly how I go from the transactional data to the visual elements, and the few concessions I make along the way to make the end result look more visually appealing.
- Each transaction is visualized as a shape:
- Transactions that purely transfer ethereum, or that transfer ethereum and weren’t marked as an ERC-20 or NFT, are shown as rectangles.
- Any transaction whose signature, the start of it’s
datavariable, is equal to"a9059cbb","23b872dd","18160ddd","70a08231","dd62ed3e"or"095ea7b3"are marked as an ERC-20 and is visualized as a circle.
- Any transactions whose signature starts with
"1249c58b","672a9400","40c10f19","449a52f8","a140ae23"or whosetoaddress is equal to any of the following addresses are marked as an NFT and are visualized as pulsing circles if modifier 2, the speed, is greater than 0 or stroked circles otherwise (with thanks to Adrian Leb for gathering these addresses):"0xaa84f7c9164db5c11b9fa65ad0118977c12a4729"| BlockArt storefront"0xb80fbf6cdb49c33dc6ae4ca11af8ac47b0b4c0f3"| BlockArt"0x495f947276749ce646f68ac8c248420045cb7b5e"| OpenSea Shared"0x60f80121c31a0d46b5279700f9df786054aa5ee5"| Rarible"0x3b3ee1931dc30c1957379fac9aba94d1c48a5405"| FND"0x2a46f2ffd99e19a89476e2f62270e0a35bbf0756"| MakerSpace"0xfbeef911dc5821886e1dda71586d90ed28174b7d"| Known Origin"0xa7d8d9ef8d8ce8992df33d8b8cf4aebabd5bd270"| Art Blocks Curated"0xb932a70a57673d89f4acffbe830e8ed7f75fb9e0"| Super Rare"0xb47e3cd837ddf8e4c57f05d70ab865de6e193bbb"| Punks"0xbc4ca0eda7647a8ab7c2061c2e118a18a936f13d"| Bored Ape Yacht Club"0x06012c8cf97bead5deae237070f9587f8e7a266d"| Kittens"0xf5b0a3efb8e8e4c201e2a935f110eaaf3ffecb8d"| Axie
- The above two methods won’t capture all ERC-20 and NFT transactions, it’s not perfect, but we felt that it would capture a lot, and it creates nice diversity within the images.
All transactions that didn’t fall into any of these categories (no ERC-20 or NFT that we could identify and no ETH transferred) are marked as a small diamond.
Each shape is scaled according to the value in Ethereum that was transferred. Using the area to scale by. However, for visual appeal I’ve made a few changes to this:
- Each shape has a minimum size; the size of one “grid” cell of the underlying grid that all transactions are drawn within. The farther you drag modifier 1 to the right, increasing the resolution of the grid, the more the actual sizes of those shapes that are exactly one grid cell large will start to reflect the actual value transferred.
- Since many/most ERC-20, NFT and unknown transaction types have no ethereum value associated with them, these are also given a minimum size. However, since (by far most of the time) no ethereum was transferred, I draw them slightly smaller than one grid cell.
- Each shape is rounded to the nearest number of grid cells it should take up. For example, if a transaction’s value would scale to 2.6 “grid cells” wide and high, it’ll become 3 grid cells wide and high (and anything below 1 is rounded up to 1 as explained above).
- Everything is scaled according to the largest transaction within a block. The largest Ethereum value transferred will become a rectangle that is half the available grid wide and high, and all other transactions are then scaled according to that value, no matter if that was 260 ETH or just 1 ETH.
- The approximate transaction fee is drawn on top. Because the transaction receipts are not part of the data available, I don’t have access to the
gasUsedvariable per transaction. Instead I multiply thegasPriceandgasLimitto get an approximate value of the transaction fee. It’s basically assuming that the transaction used 100% of what it was allowed (which isn’t a crazy assumption).- The size of the “gas bubble” is scaled in the same way as the size of each shape. However, with gas I do not round it to the nearest full number, nor do I round up to 1. Sometimes these shapes can become (quite a bit) larger than the original shape.
- If the “gas bubble” is smaller than the shape itself it will get the color of the background. If it gets bigger it will be given a gradient.
But what if a block doesn’t have any transactions? There are quite a few of these. Theoretically I should be showing an empty image with only the background color. However, I was afraid that might give people the idea that something in the code was broken, or that part of the visual still had to be loaded. I therefore chose to show something.
There is a small chance that a one-tx block will also have its rectangle in the dead center.
You’ll know that you’ve come across a zero-transaction block if there is one (big) rectangle (no circle or diamond), positioned exactly in the center, without any “gas” shape associated with it. If there is only one big rectangle/shape but it’s not in the center, that will be a block with one transaction.
Save a High Resolution Image
In case you’re looking for a high resolution image of your mint, I would suggest following the steps outlined in this article. Let me explain you the steps specifically for EthBlock.Art / Wanderlust as well:
- In Chrome, go to page with the mint
- Make sure mod2 is all the way to the left, so it’s a static image
- Open the Chrome devTools (right-click anywhere on the page and choose Inspect)
- In the top of the devTools, click on the little icon with a smartphone/tablet, this will let you go into the responsive mode
- In the dropdown at the top of the page, press Edit…. This will let you create a new “device” in the window that pops up along the right. Click Add custom device…
- Give the new device an easy name. Set whatever dimensions you want. Note, these will be the dimensions for the entire page. Set the Device pixel ratio very high. This is really the “secret sauce” to making a big image, not specifically the dimensions you set (I only used 1920x1920, but set the pixel ratio to 8)
- Click Add after you’re done to save this device. Close the edit window, and select the new device from the drop down at the top of the page. Let the page load
- Right-click the image, click Save Image As… (it can take a minute for the save-as window to appear), you know the rest
The video below shows all these steps performed on my own “genesis” mint of Wanderlust, which resulted in an image that was 8602x8602px large:
In case you want to create a high resolution image at the exact dimensions you’ve set up for the new “device”, you have to go to the Full-Screen version of your mint instead. However, since you can’t mess with modifiers there, your mint will need to have its mod2 set-up all the way to the left as its base/saved setting to have it be static.
In the video below I show how to save a high res image that is exactly 1920*8 = 15360x15360px big (which was the device setting I created):
- I find the mint on OpenSea and click on the View on BlockArt icon along the top-right
- Within the new page I press View Fullscreen
- I now follow the same steps as explained above, except that my device already exists, so I only need to select it, let the page reload, right-click the image and press Save Image As… (and wait a minute for the pop-up window to appear)
If you do end up printing a Wanderlust, I’d love to see a photo! (ノ◕ヮ◕)ノ*:・゚✧