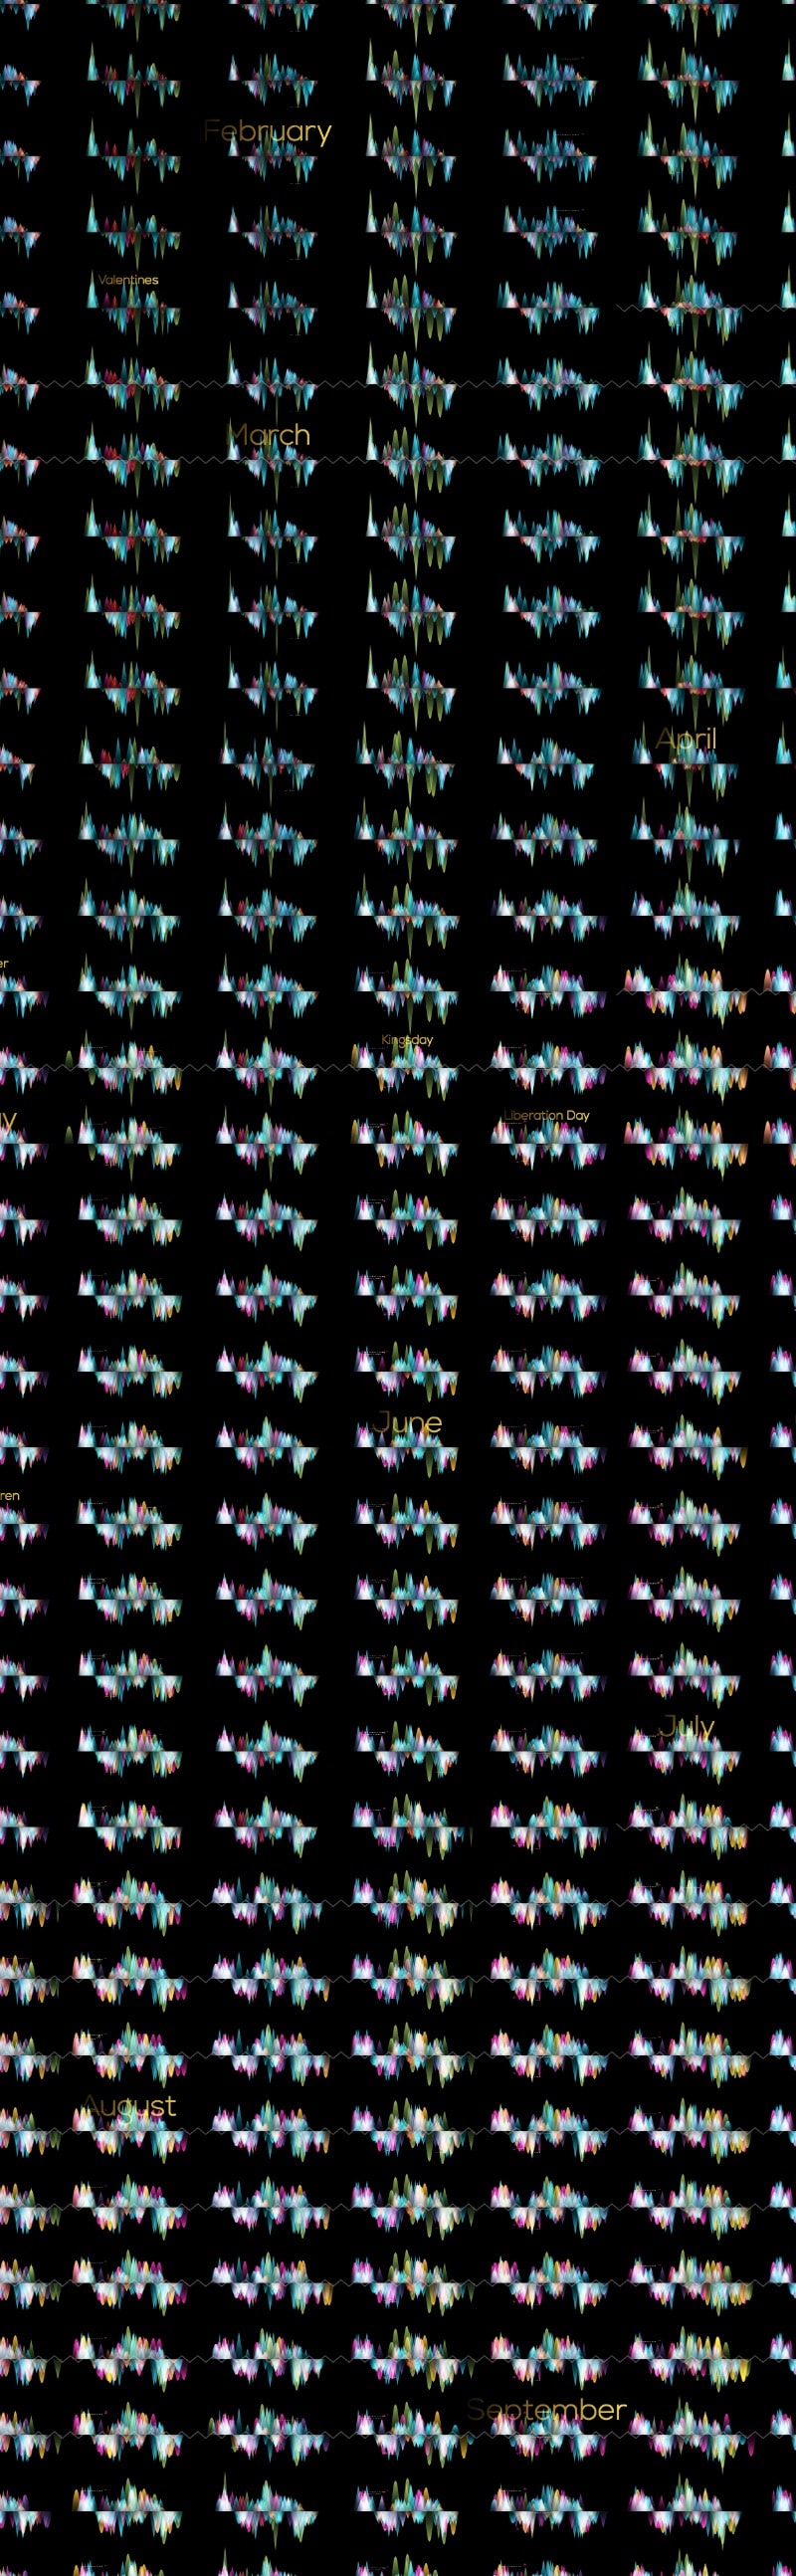
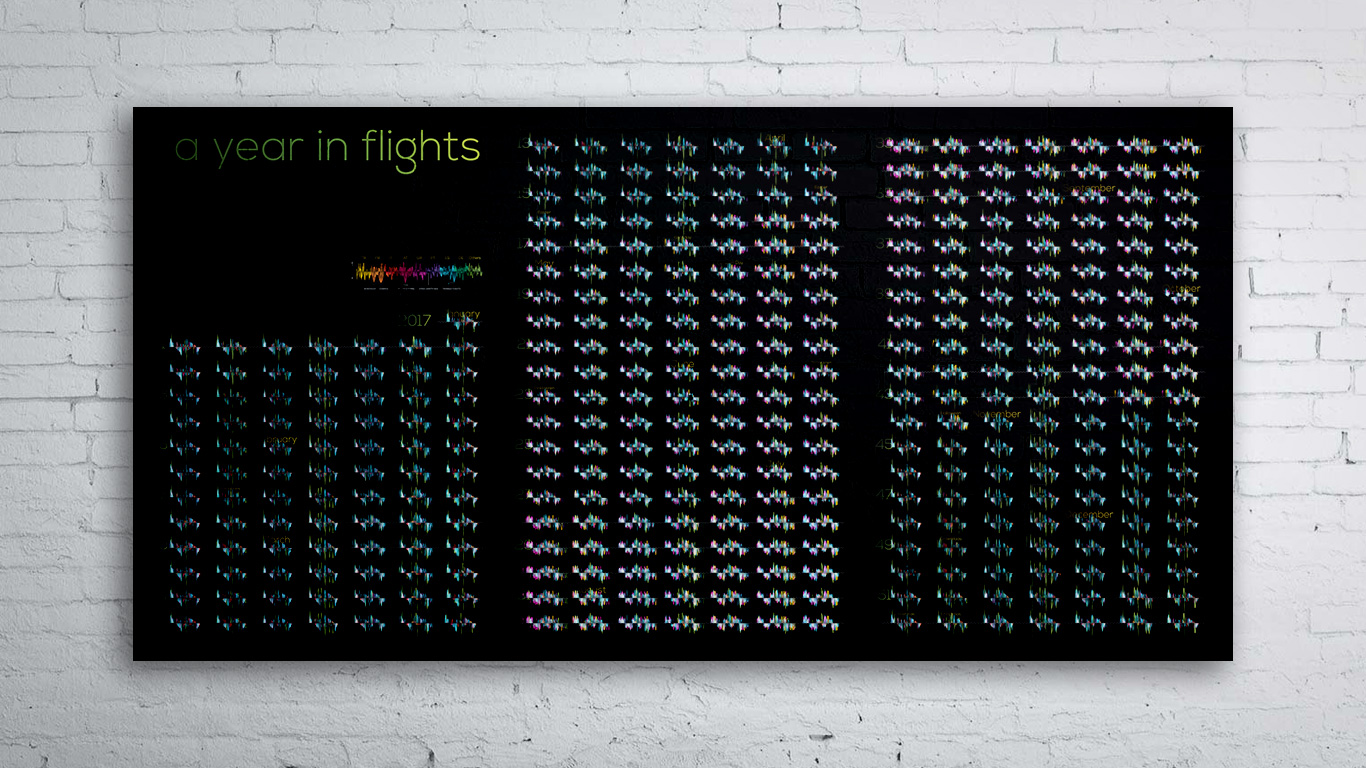
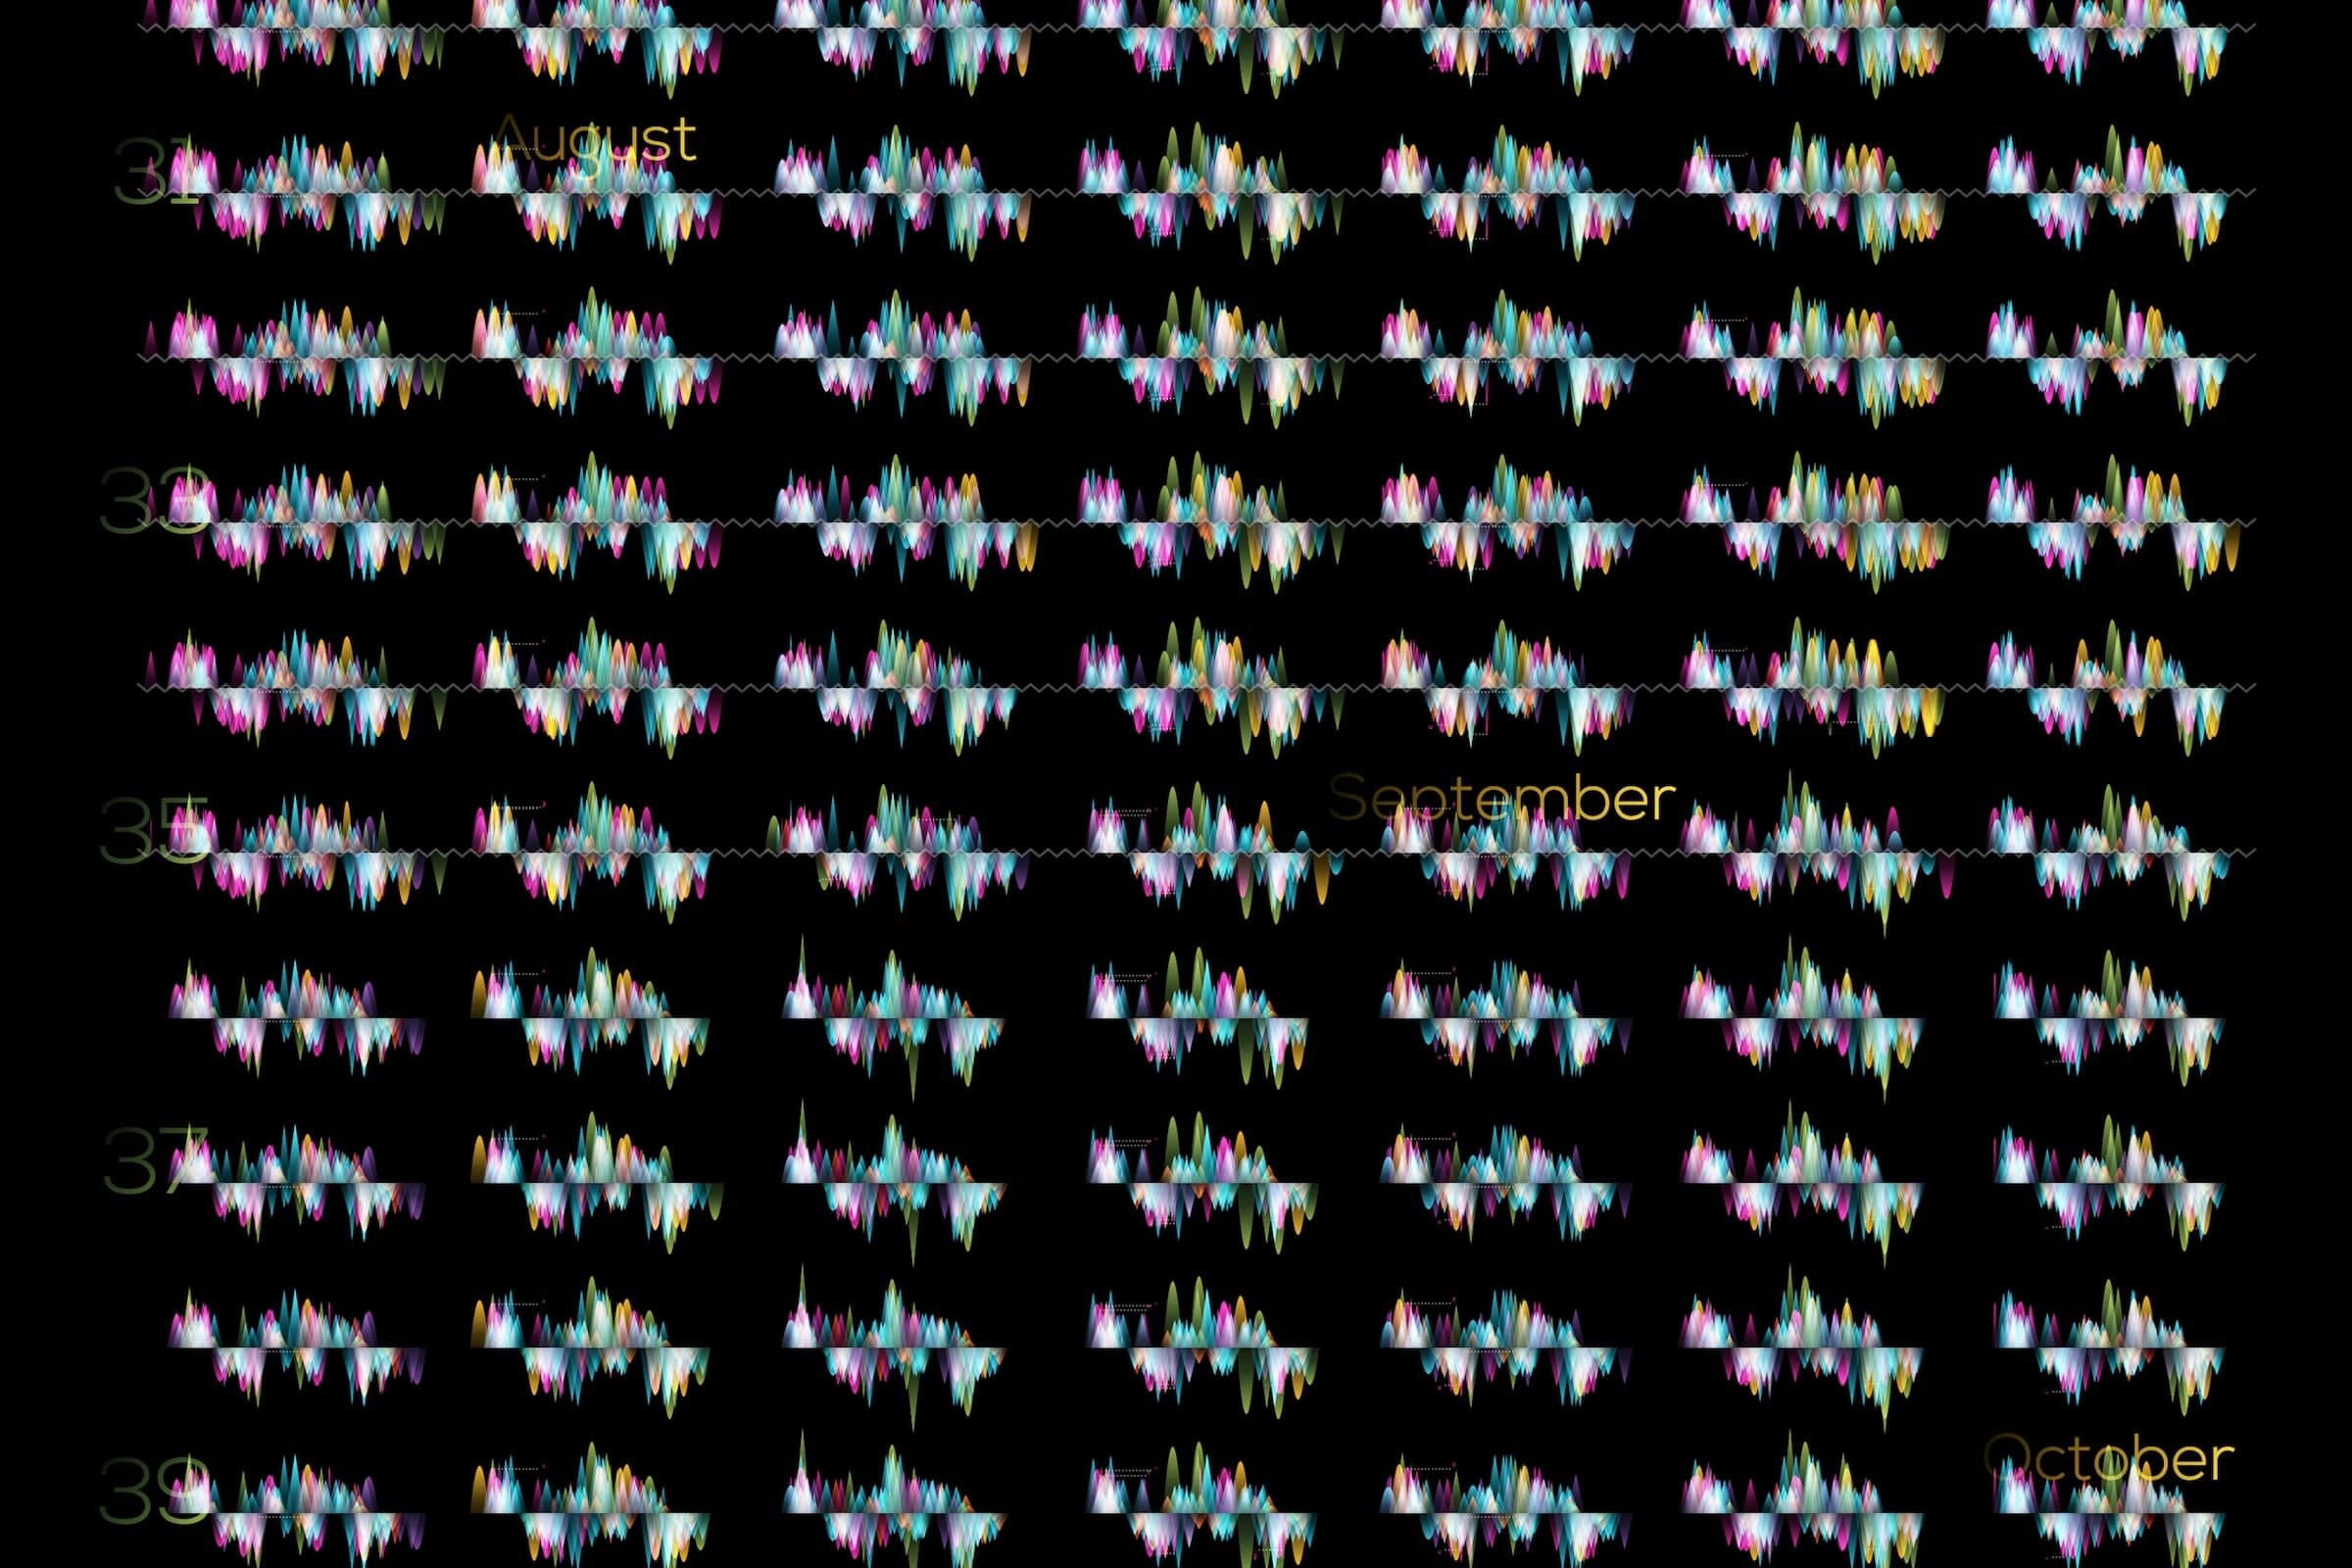
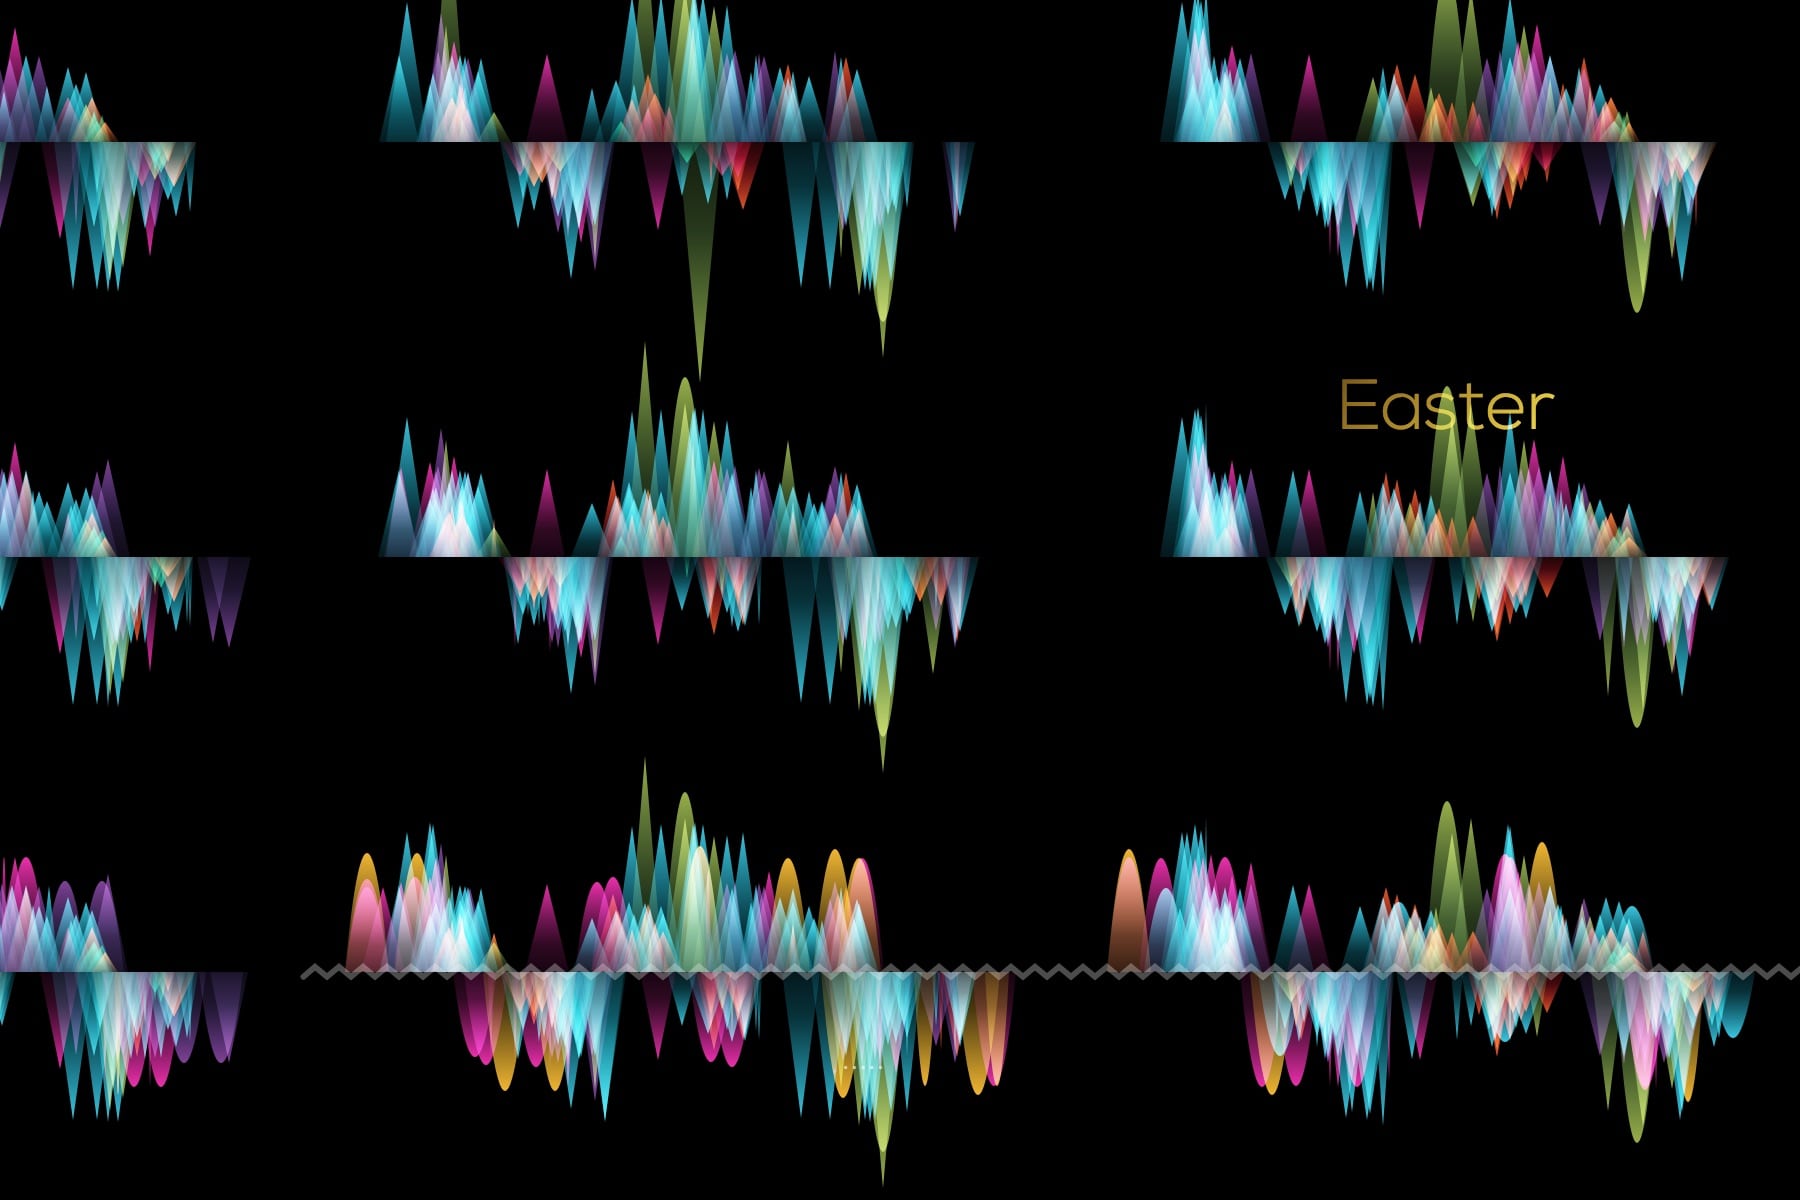
This data art piece conveys the intricacies of a year’s worth of flights performed by Transavia, a Dutch airline. Each flight is turned into an abstract shape whose appearance is completely determined by the meta-data of that flight. Together they create a piece that is unique and crafted only from Transavia’s own data that still conveys general trends (holidays, destination shifts depending on season, charter flights, etc.), while also having an artistic feel. The final piece, measuring 3m x 1.5m, was placed in Transavia’s office to remind employees about the vast amounts of data that they can use in their day-to-day work.
Projects where the client asks me to create something with a strong artistic focus are probably my favorite kind, and I was therefore very happy when Transavia approached me to create an art piece for their office that was based on their flights.
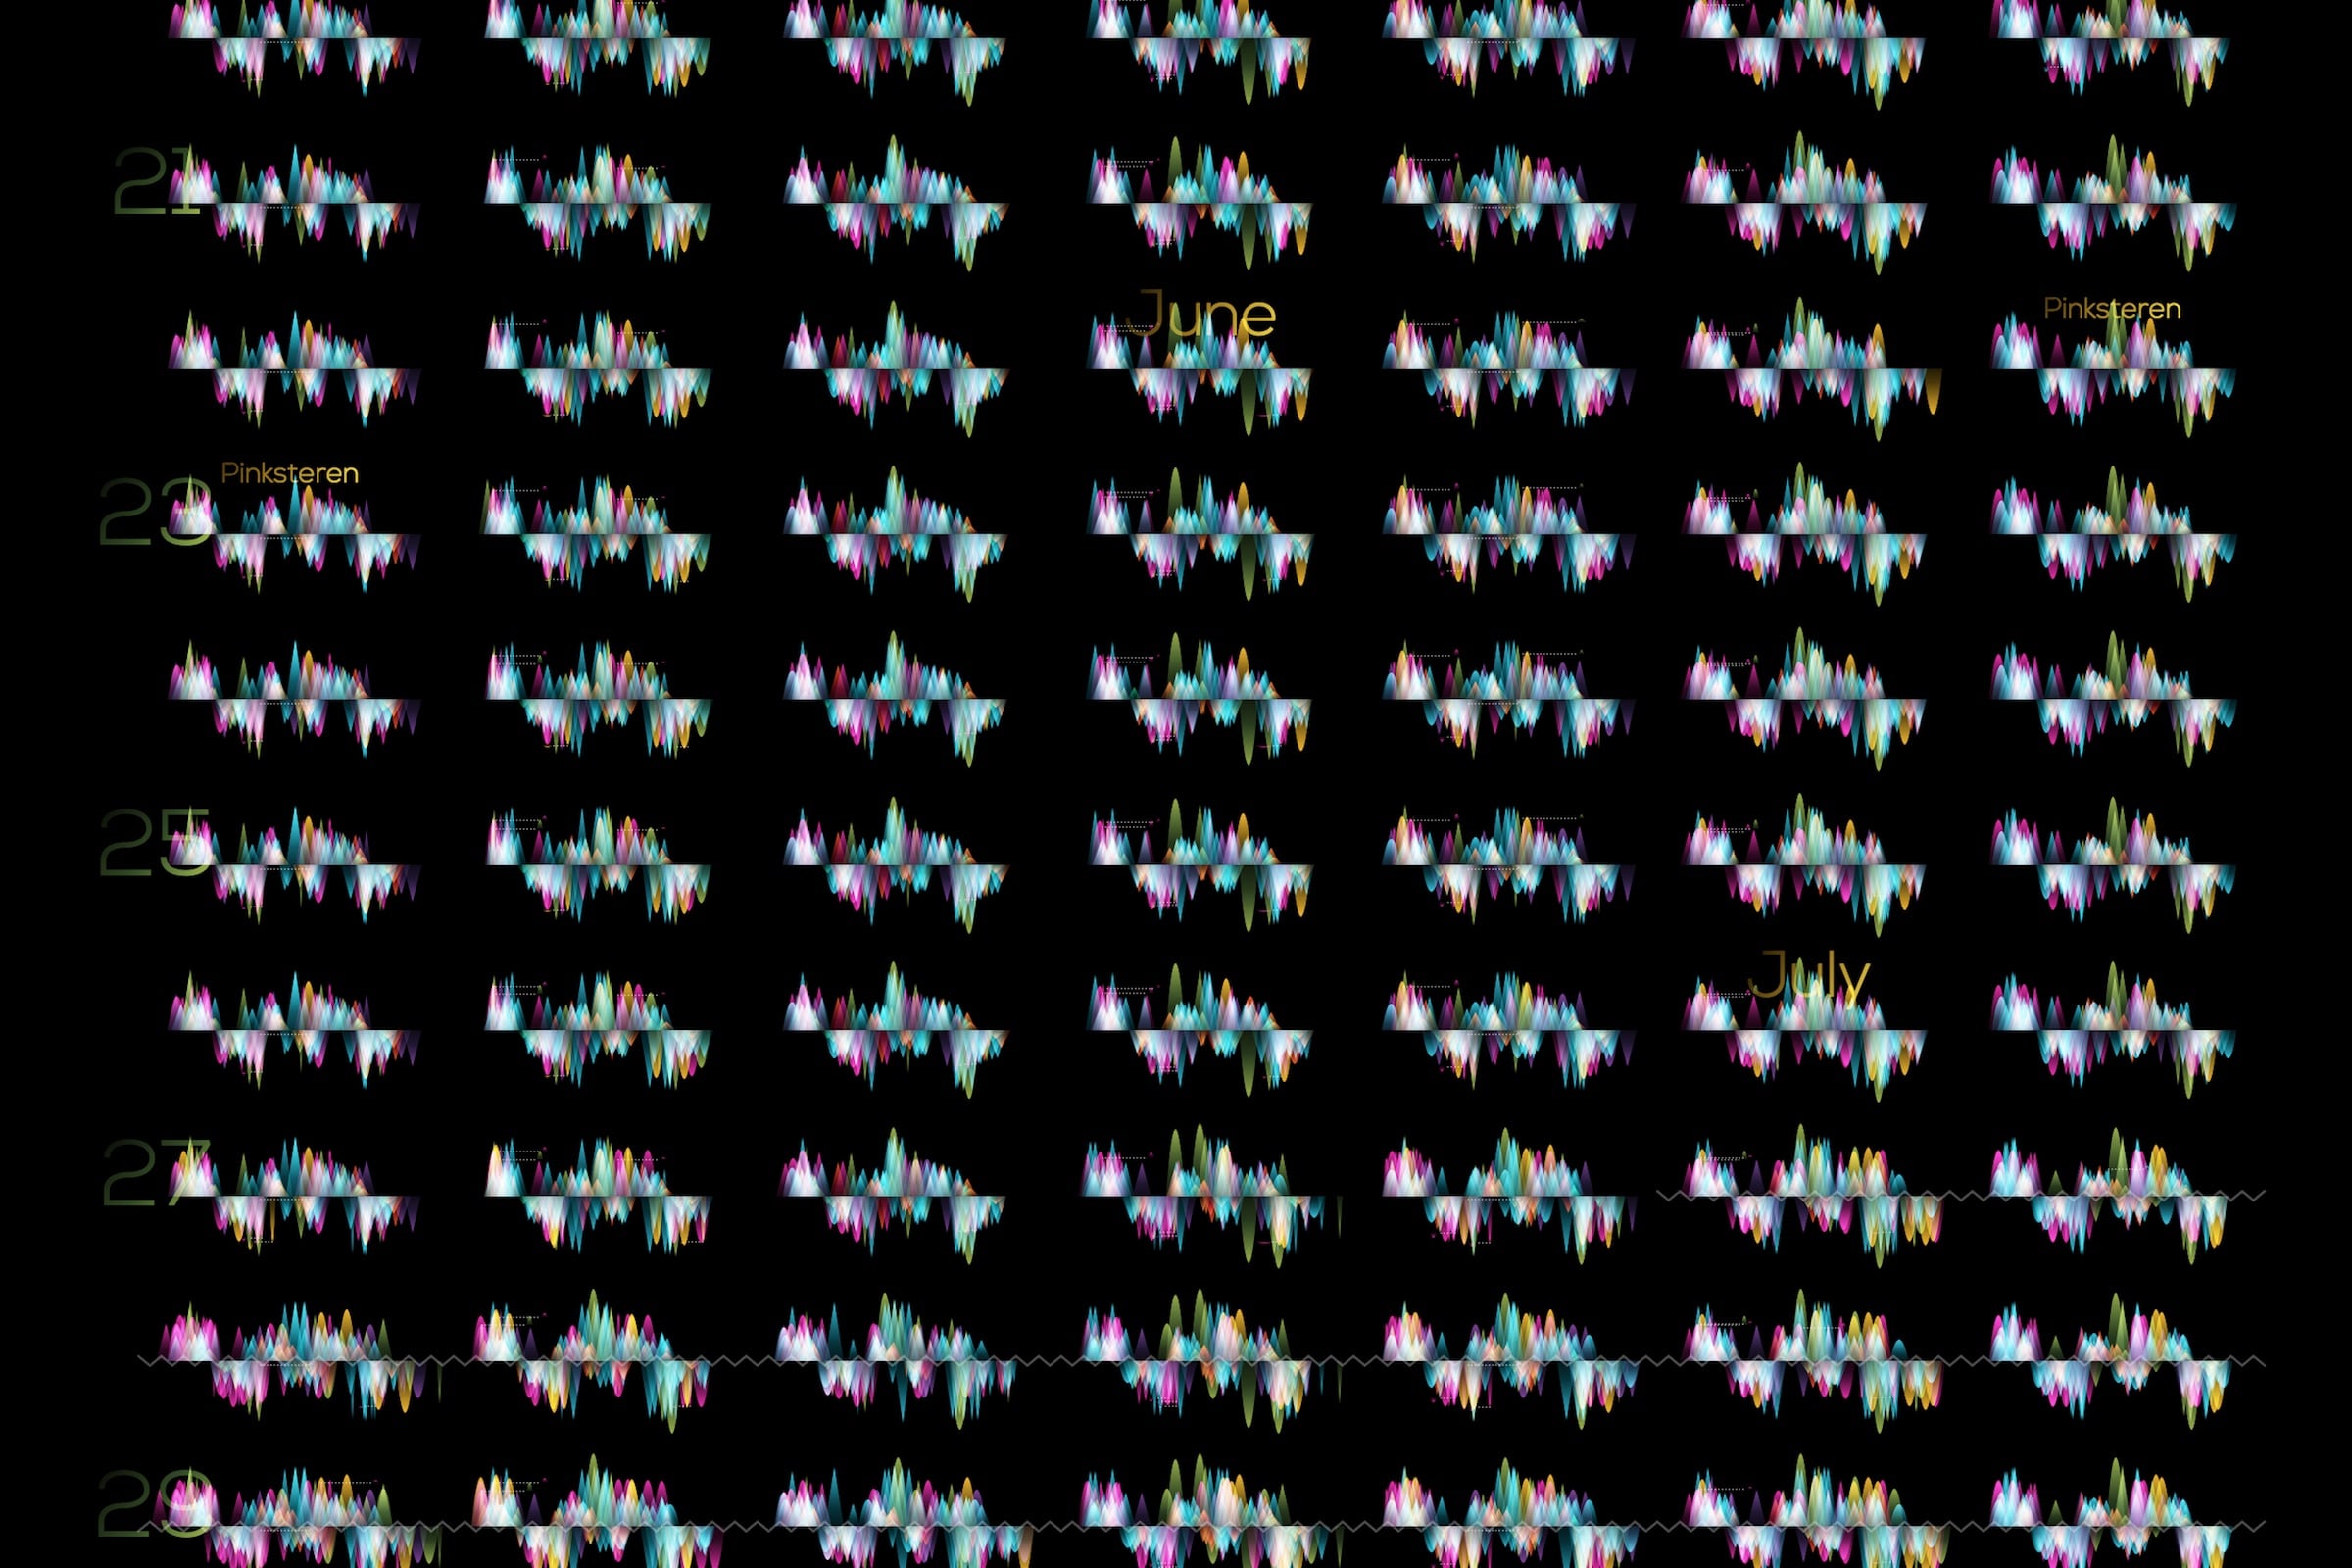
After an extensive design phase in which I explored several different ways of visualizing the meta information about the flights, we eventually settled on the idea of showing all ±50,000 flights in a grid-like structure, where each flight’s appearance was determined by thing such as; how far, how many passengers, country, in- or outbound, and more.
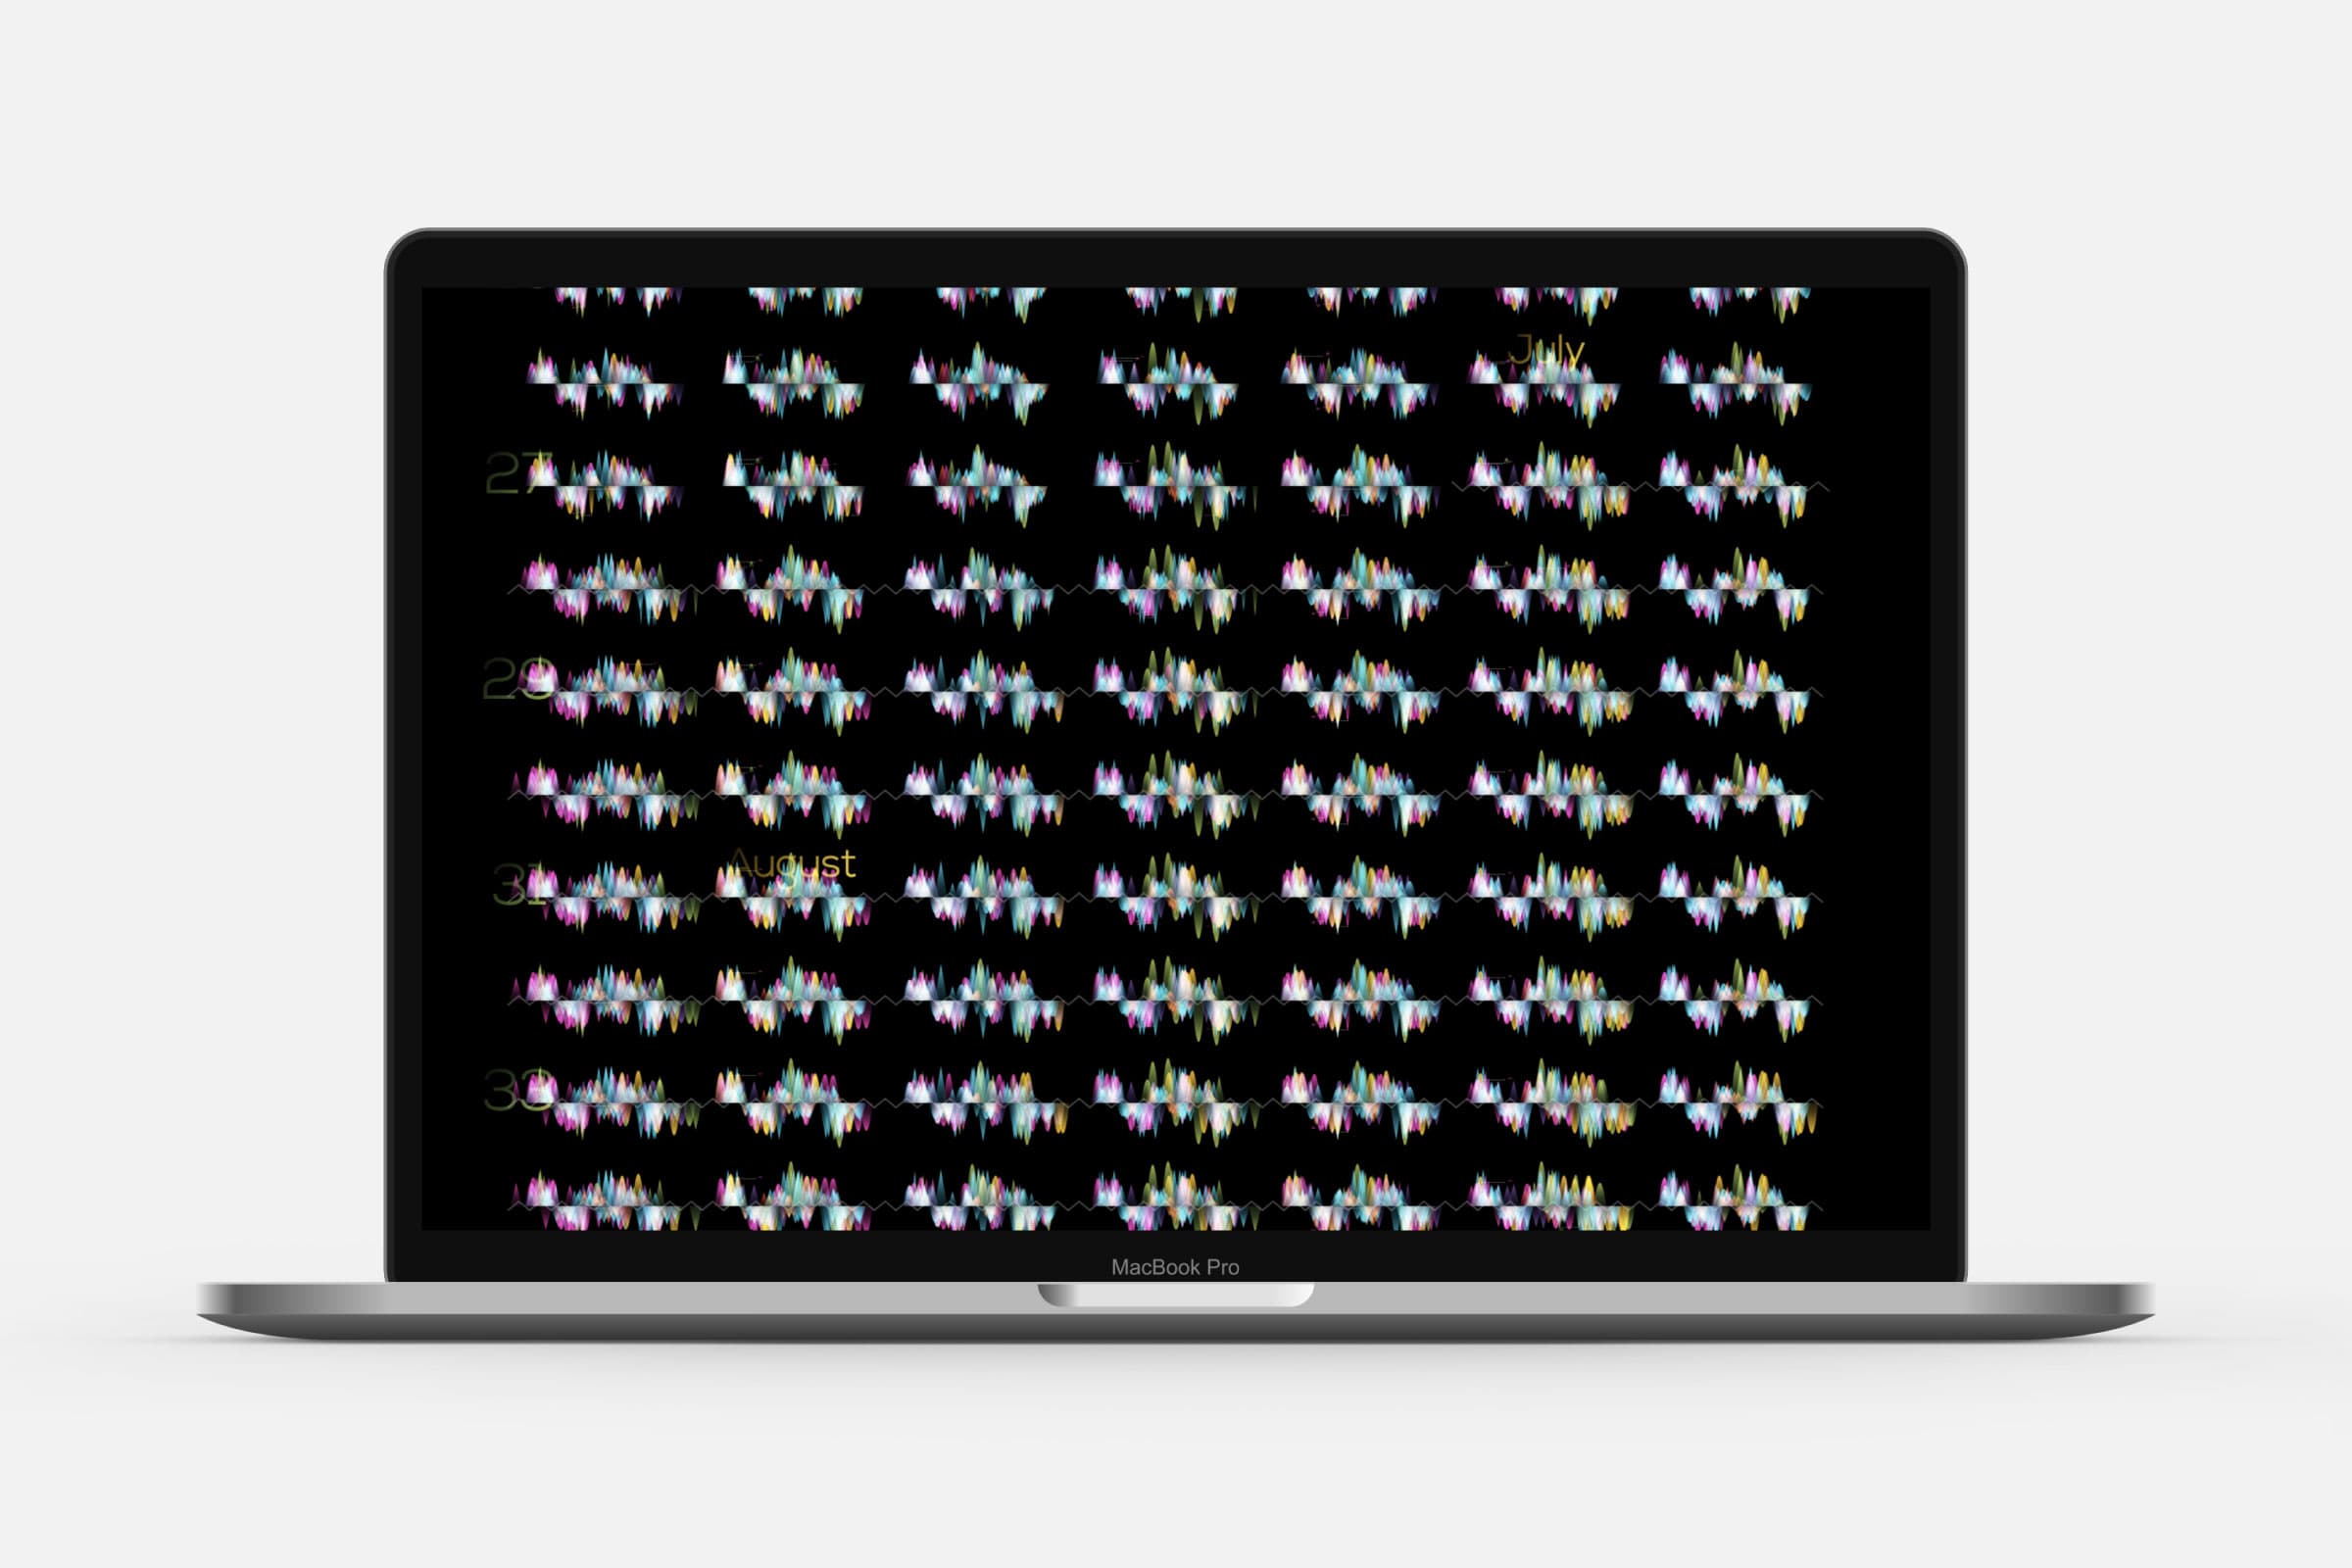
The final piece was printed and placed into Transavia’s office, but I also created an online version for the employees to see each day up close and in even brighter colors.