Charts often aggregate across time to simplify the numbers. Instead, for this visual made for Scientific American, the focus has been on visualizing the number of babies born across different time frames; from weeks down to the minute, to reveal the role of scheduling & intervention in births. Nuanced insights about data design, visual form, and graphic design resulted in these unique charts that compare the birth of babies to the average. And people have much more influence than expected!


During the start of 2016 Zan Armstrong asked me if I wanted to collaborate on creating a visualization for the Scientific American about when babies are born in the US.
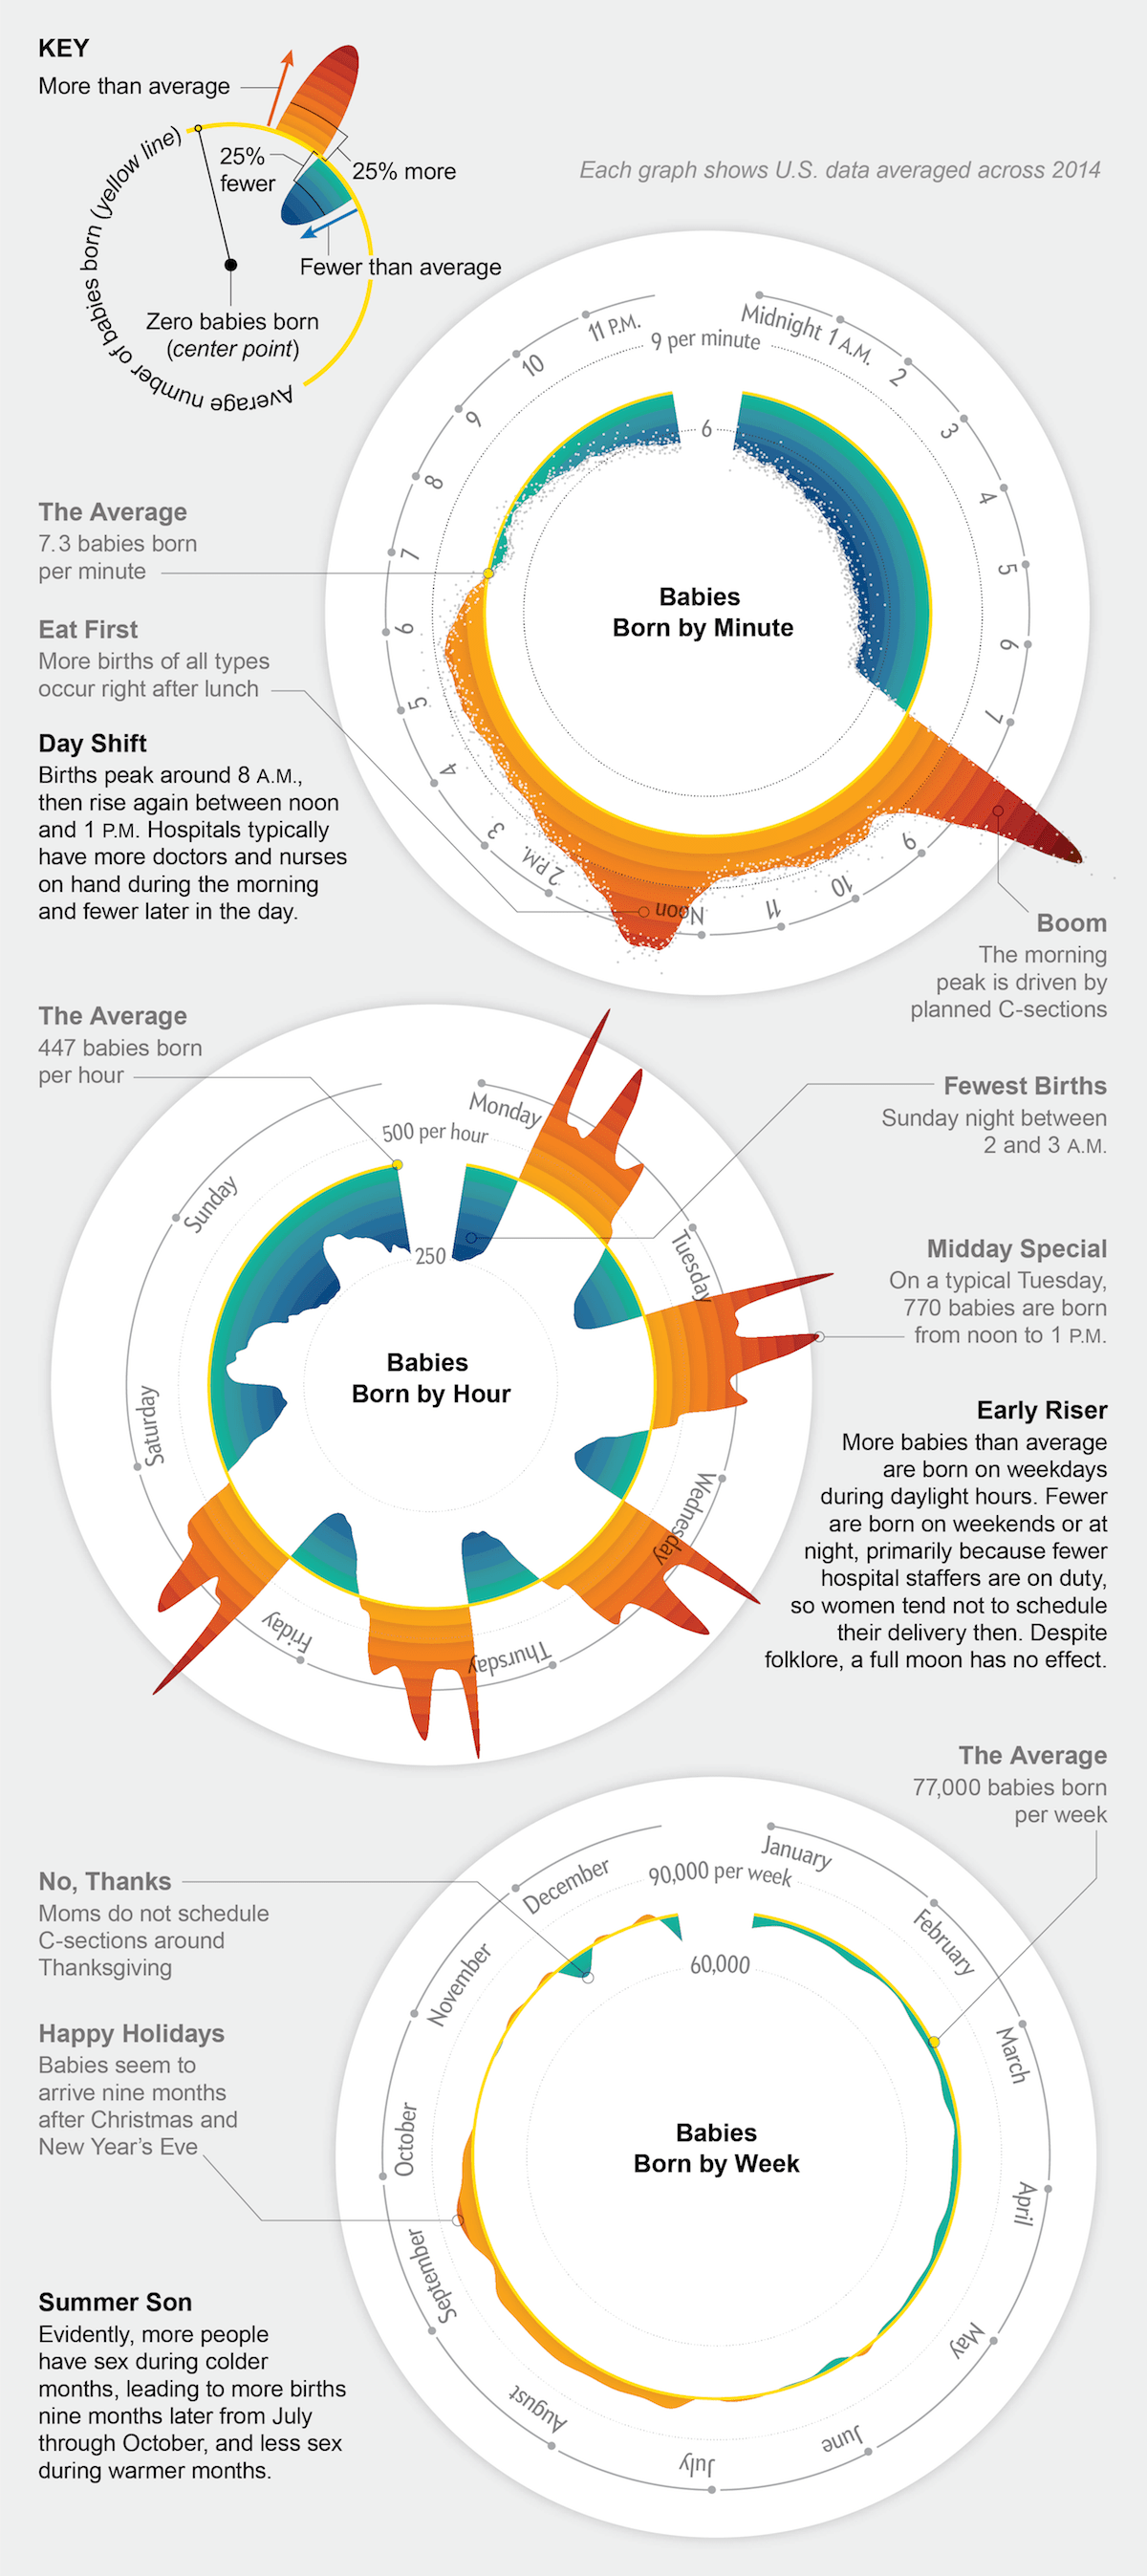
The data was available on several layers of time-granularity. From the numbers born per week, per hour and even down to the minute. We quickly moved towards using circular charts due to the cyclical nature of the time frames we were looking at. Another important aspect was the yellow average line, which is the same size in each of the three circles. This makes it more clear that the deviations from the mean are only small for the weekly totals, but are literally off-the-chart for the minute totals.
The final visual appeared in the July issue of the Scientific American, and Zan also wrote a more extensive blog post that dives more into the details & differences between types of births. You can also read a much more elaborate account of the design process in my blog post.