Blank Bio commissioned me to design the hero infographic for their technical report announcing Ladon, an AI foundation model trained on vast amounts of RNA data to understand human biology and disease. To showcase the model’s capabilities, the infographic tackles a fundamental puzzle in cancer medicine: why two patients with identical clinical diagnoses and matching routine test results can experience completely opposite treatment outcomes. Tracing two real-world “clinical twin” patients from a breast cancer trial, the infographic guides readers from their matching diagnostic baselines into an overlapping circular visaual of each tumor’s complex molecular fingerprint. This reveals their hidden biological divide, showing how Ladon accurately predicts who will respond to treatment and unpacks the specific cellular mechanisms driving cure versus resistance. It was tailored specifically for an expert audience of life scientists. Therefore, the design strips away introductory exposition to serve as an eye-catching summary meant to be explored alongside the report.
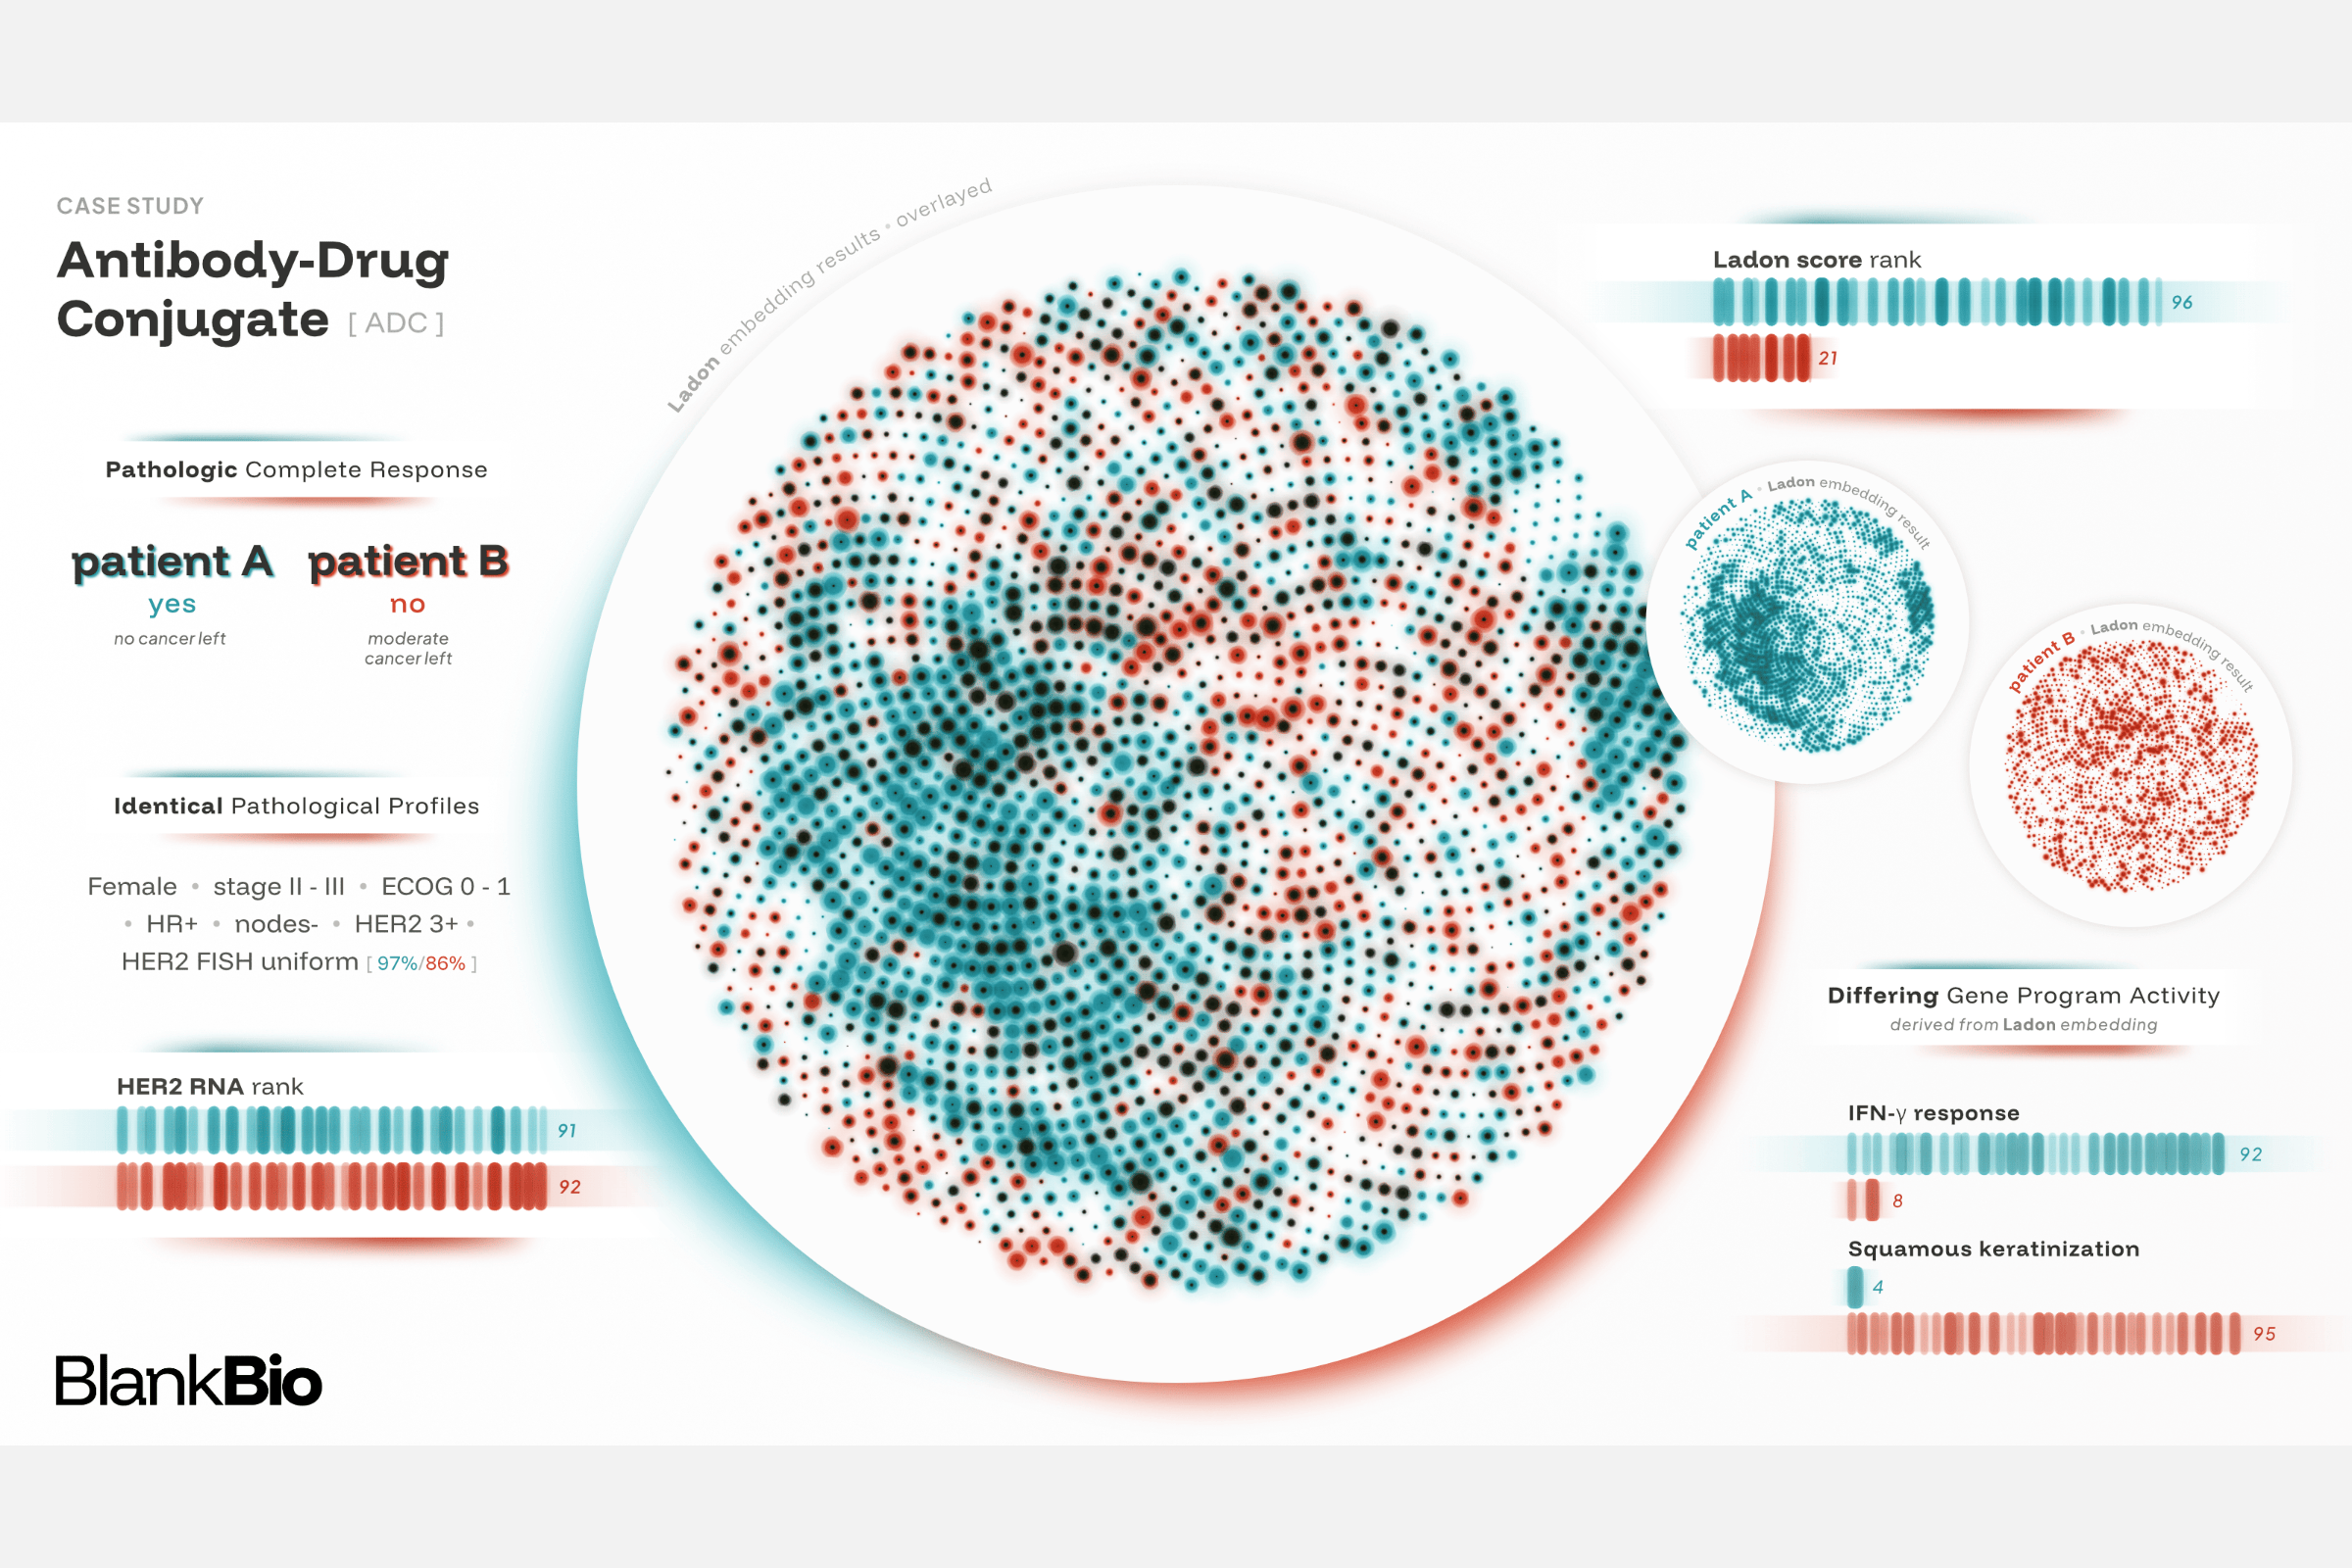
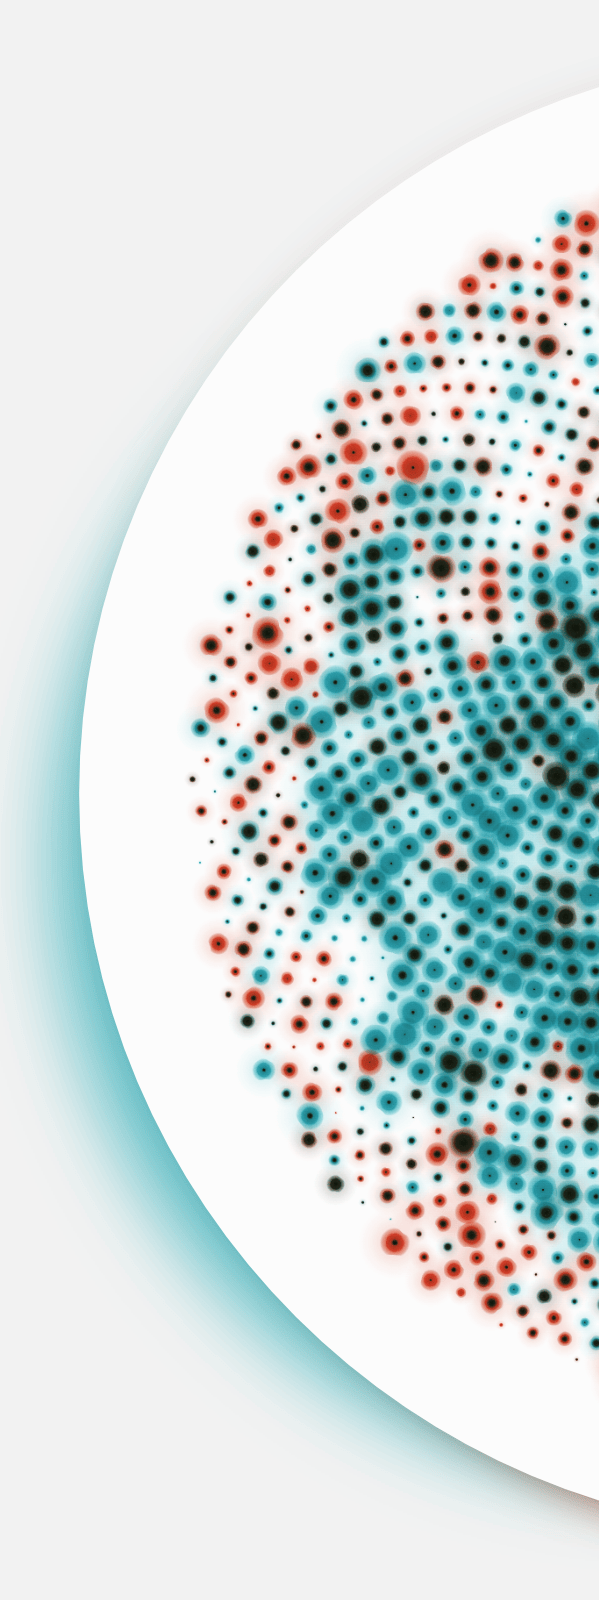
The client wanted something different from the standard “UMAP” plots typically used to represent high-dimensional data. Because it was important to create something visually enticing, I ended up going for a large phyllotaxis visual of the model’s results, showing how the two patients’ data differ.
I based the design of the central visual and the surrounding bar charts on classic DNA gel electrophoresis strips. The idea was to create something that felt grounded in the science, yet abstract and intriguing enough to serve as the hero image for their whitepaper and blog post.
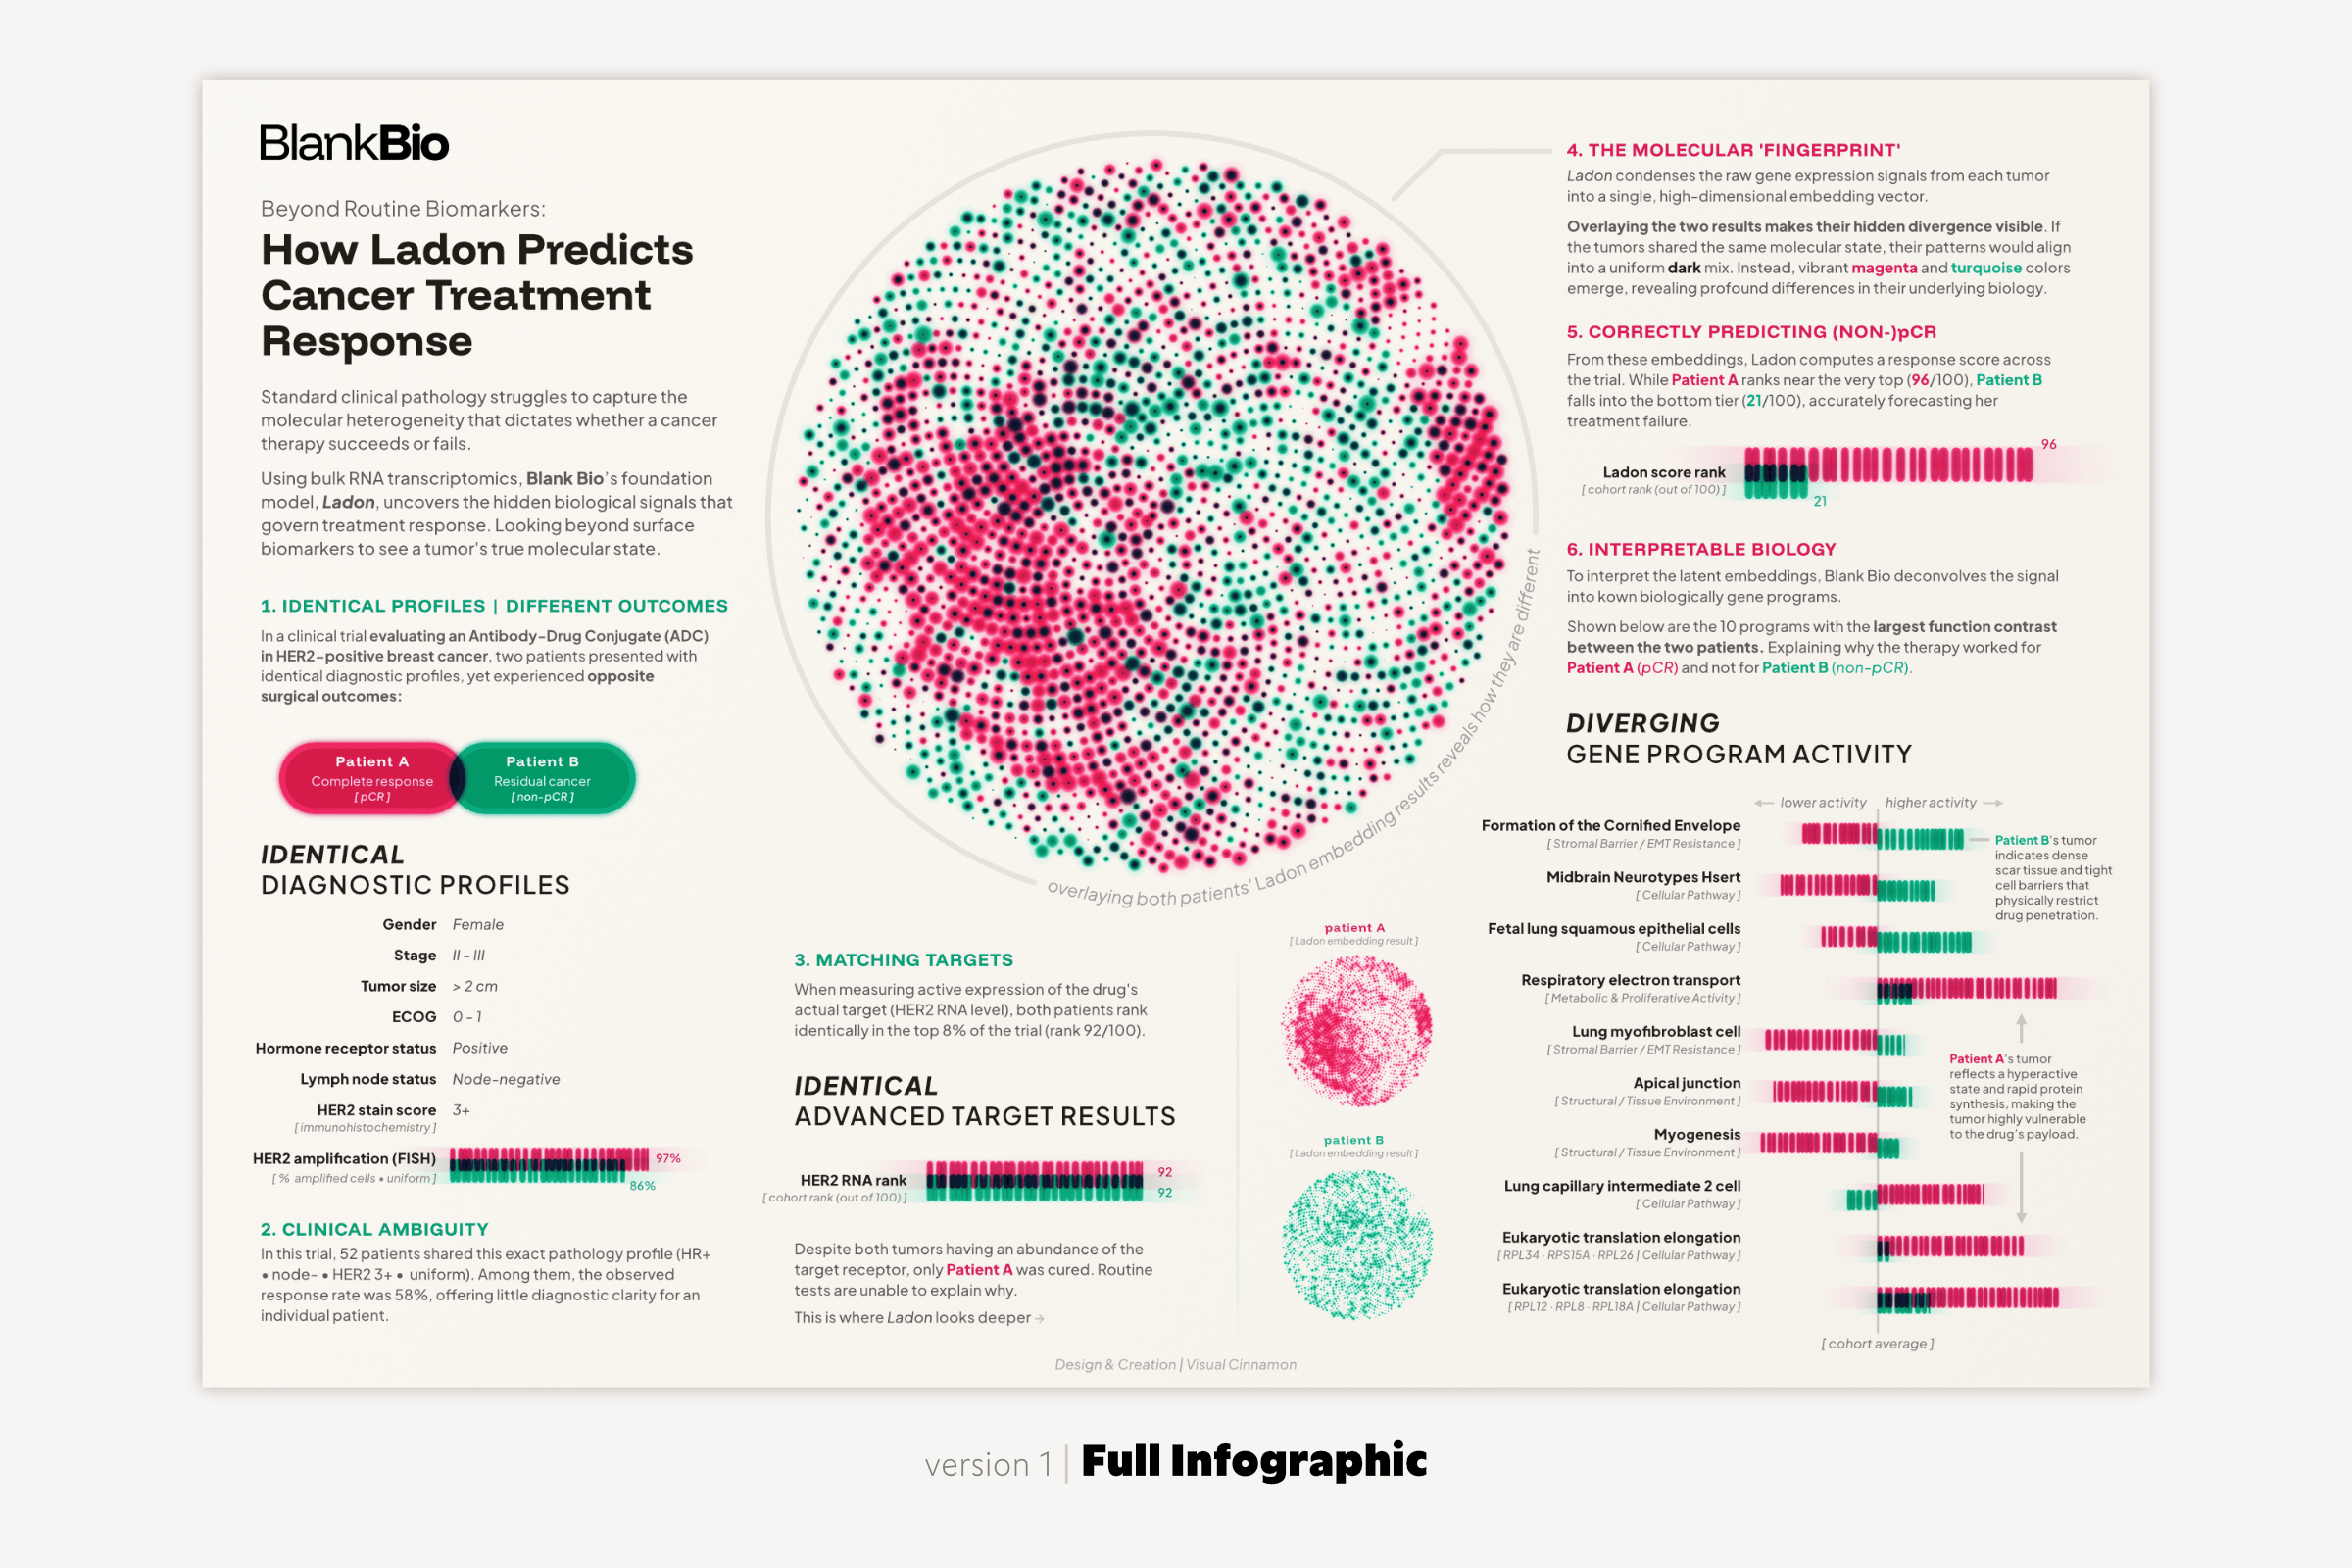
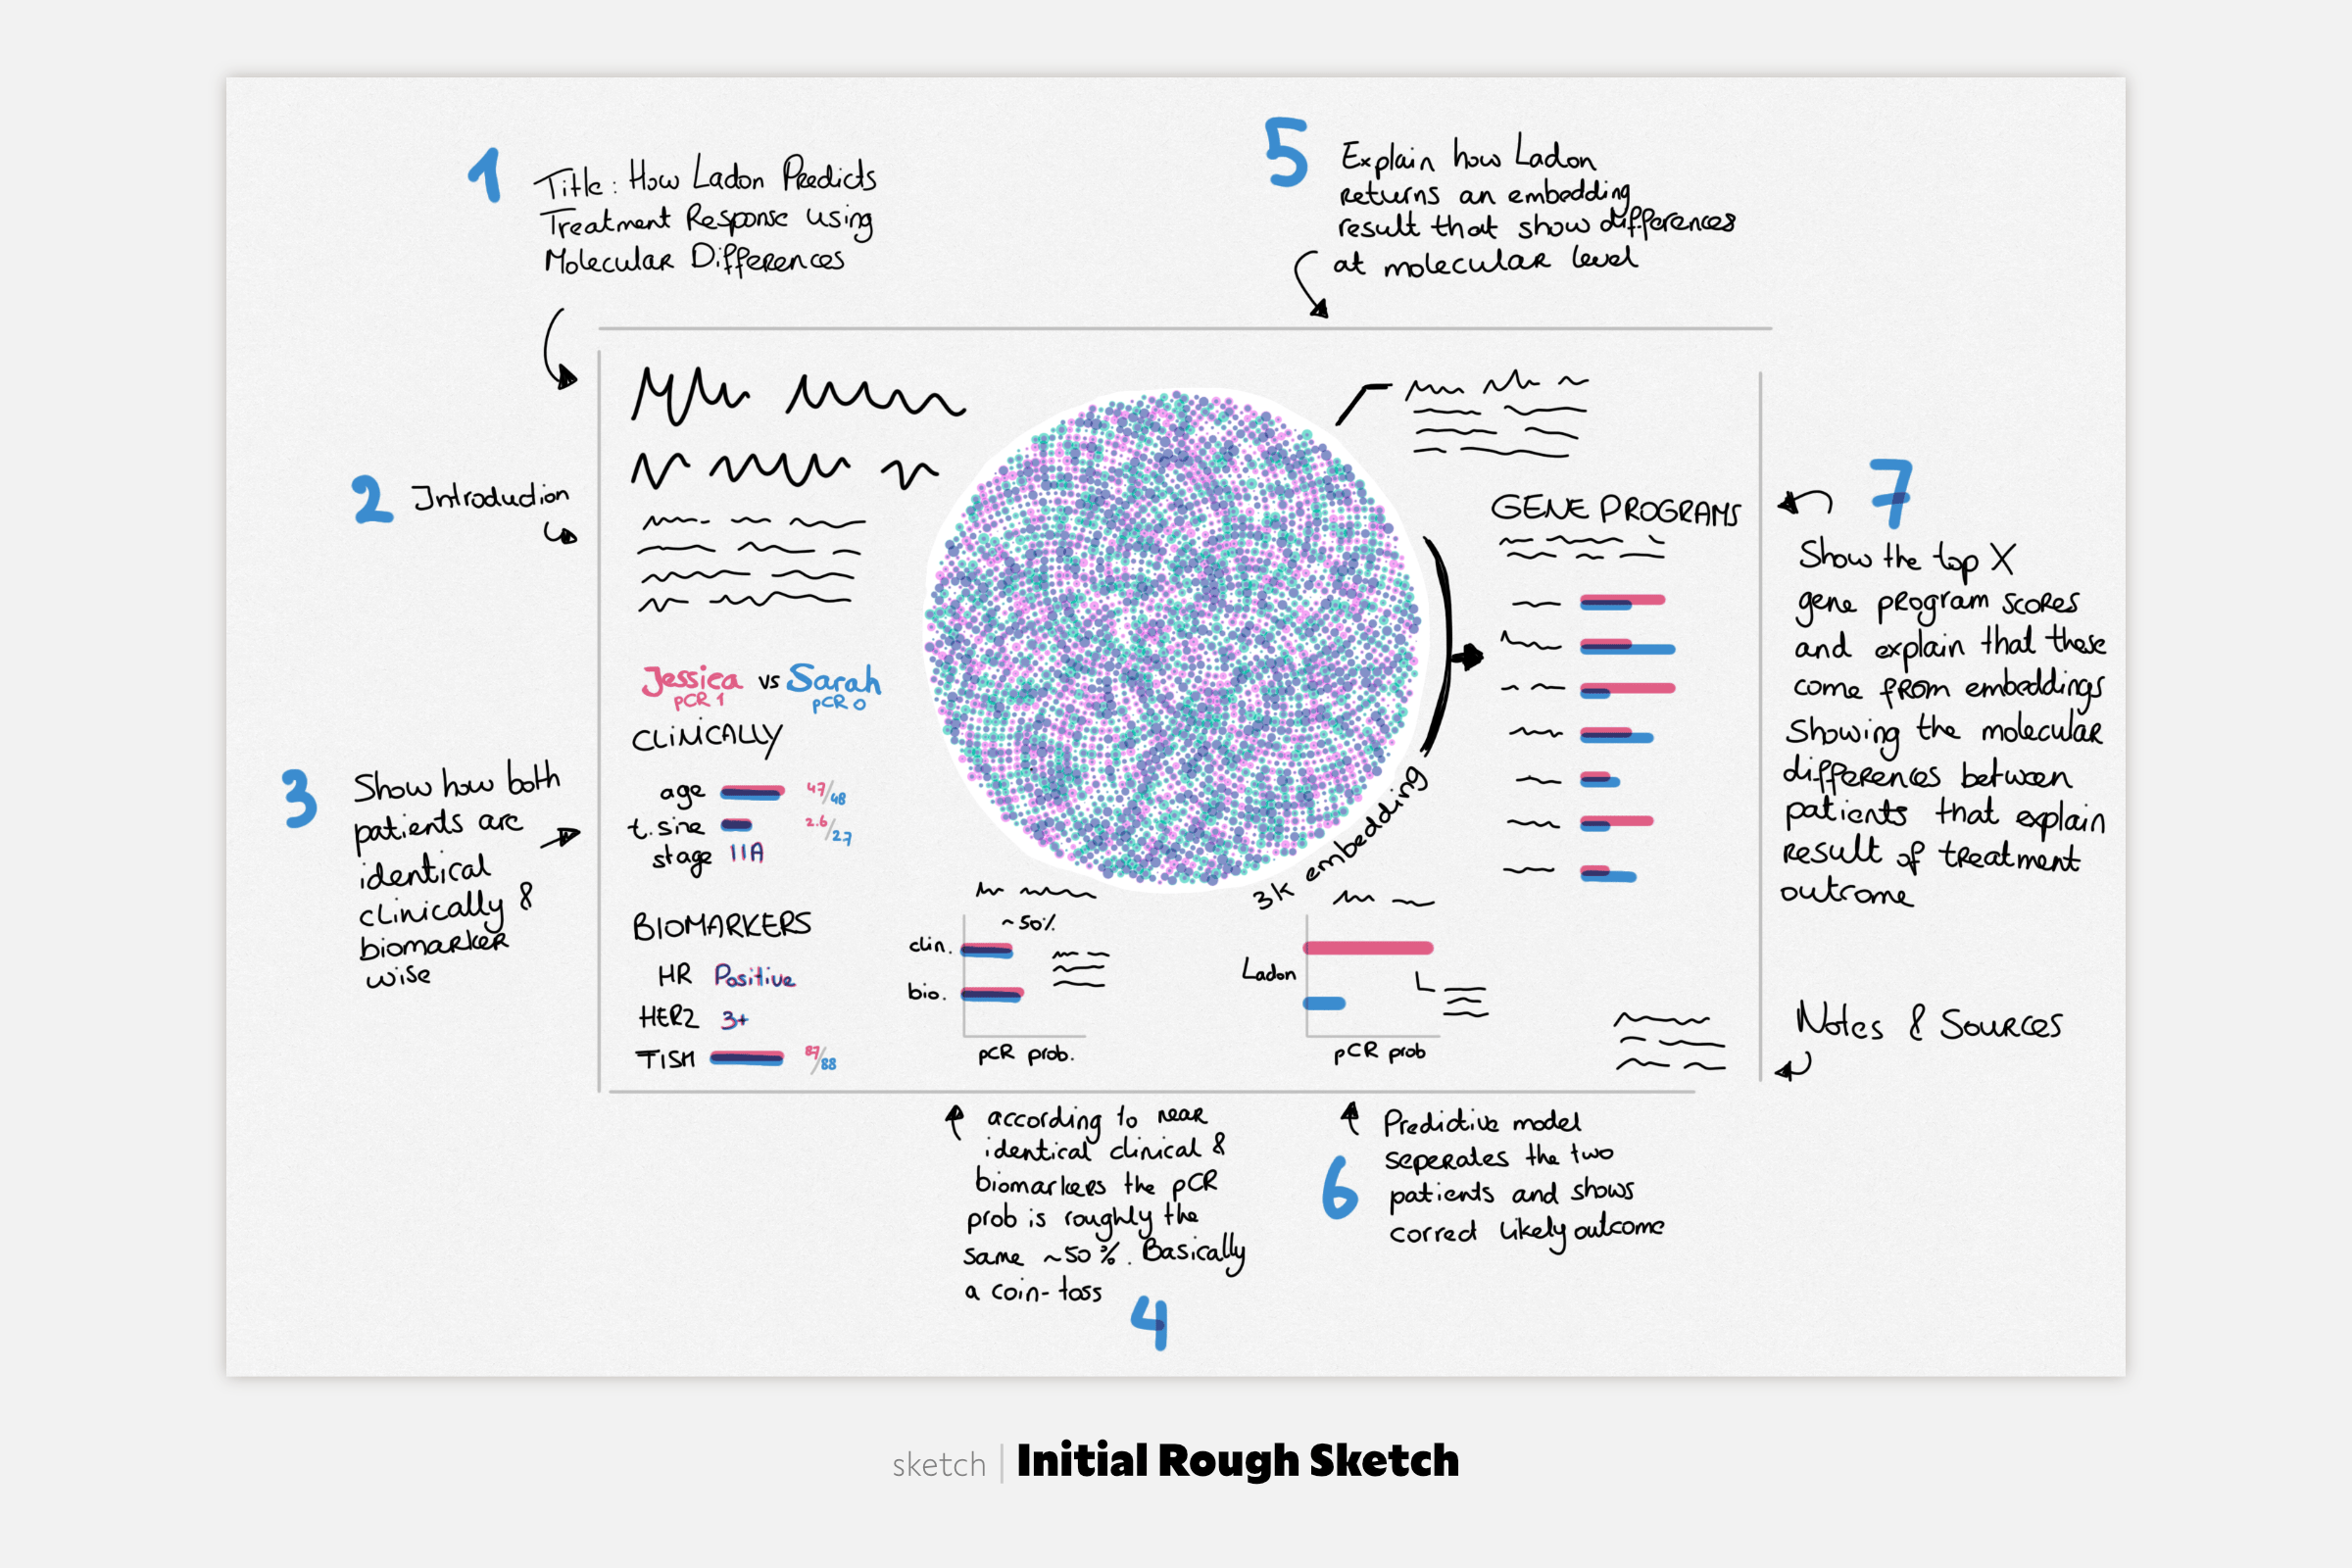
Because RNA transcriptomics was completely new to me, my first design was aimed at explaining to a broader audience how the client’s technology works (see the first image below). This required extensive textual annotations. While I knew a text-heavy layout wouldn’t work as an eye-catching header image, going through this exercise was essential to truly grasp the science myself. This, in turn, helped me understand what could safely be stripped away in the next iterations.
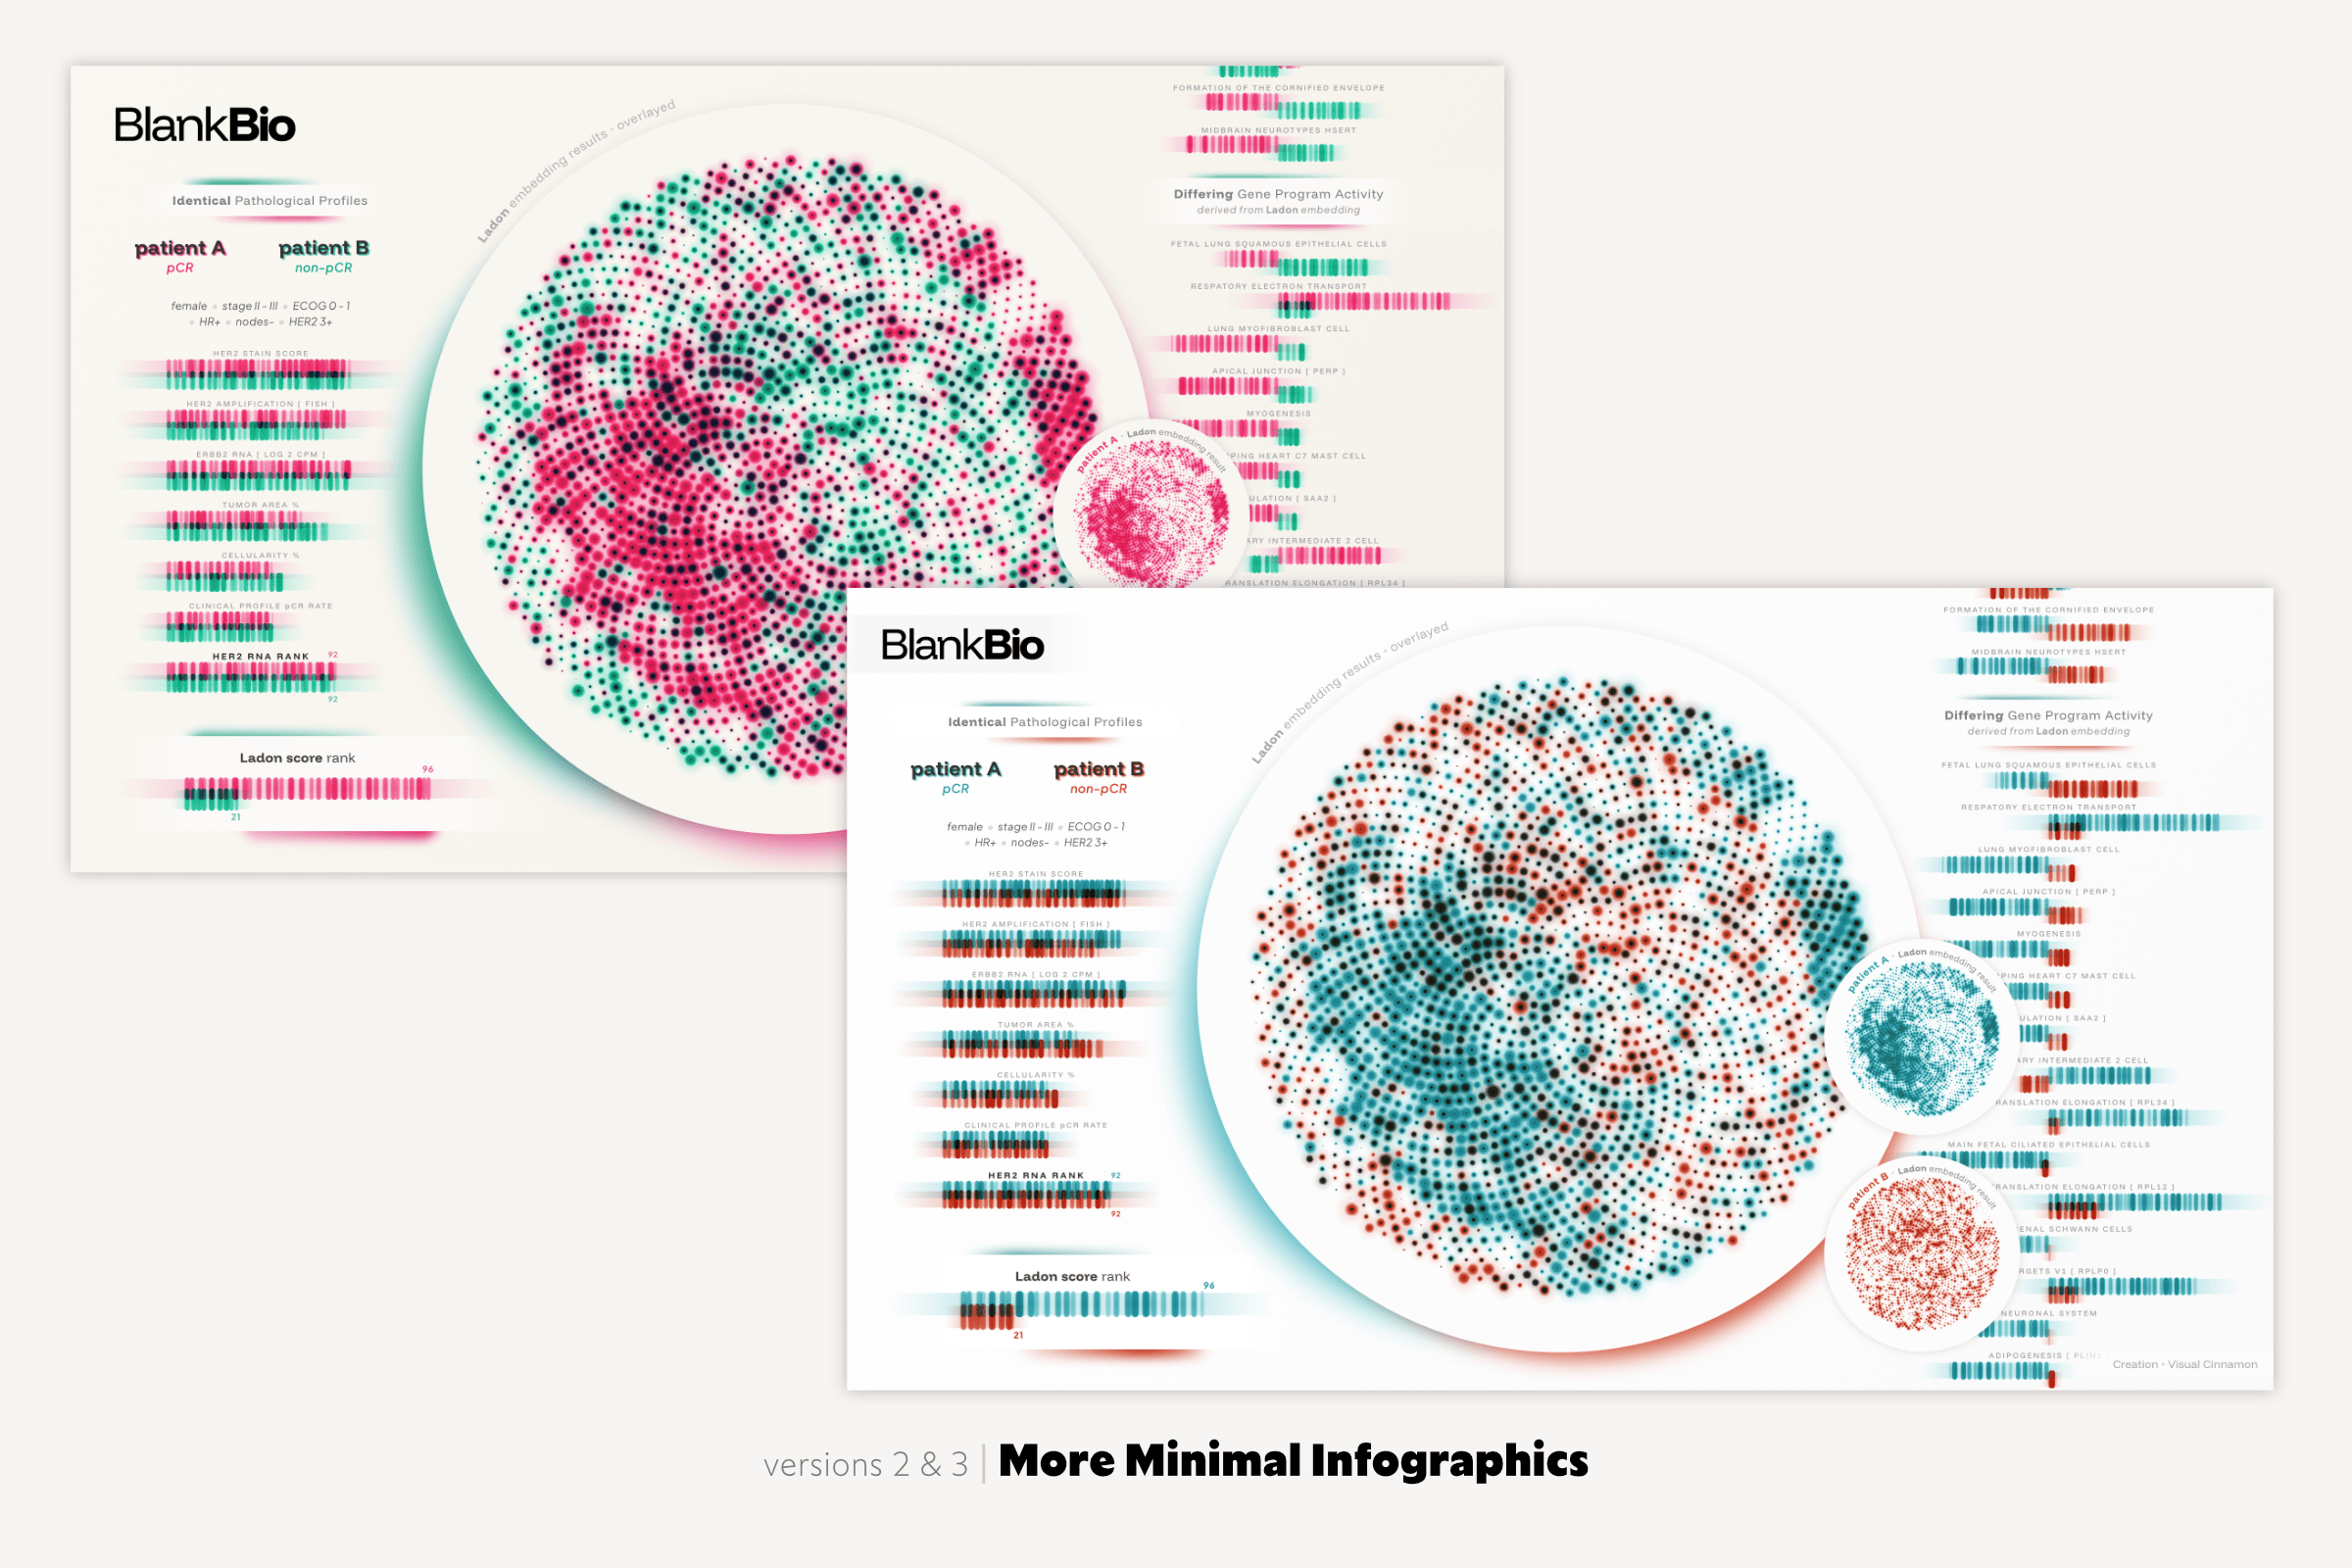
In versions 2 and 3 below (switching to the client’s brand palette in version 3), I severely stripped back the text, focusing on creating something that sparks curiosity even if you don’t know what it represents (yet). While there wasn’t enough explanation left for non-experts to follow the entire narrative, that was fine for a blog header.
The final version (at the top of this page) strips back even more, focusing solely on the elements that show how the client’s model improves predictions of a patient’s response to a drug (either no cancer remaining, or residual disease).
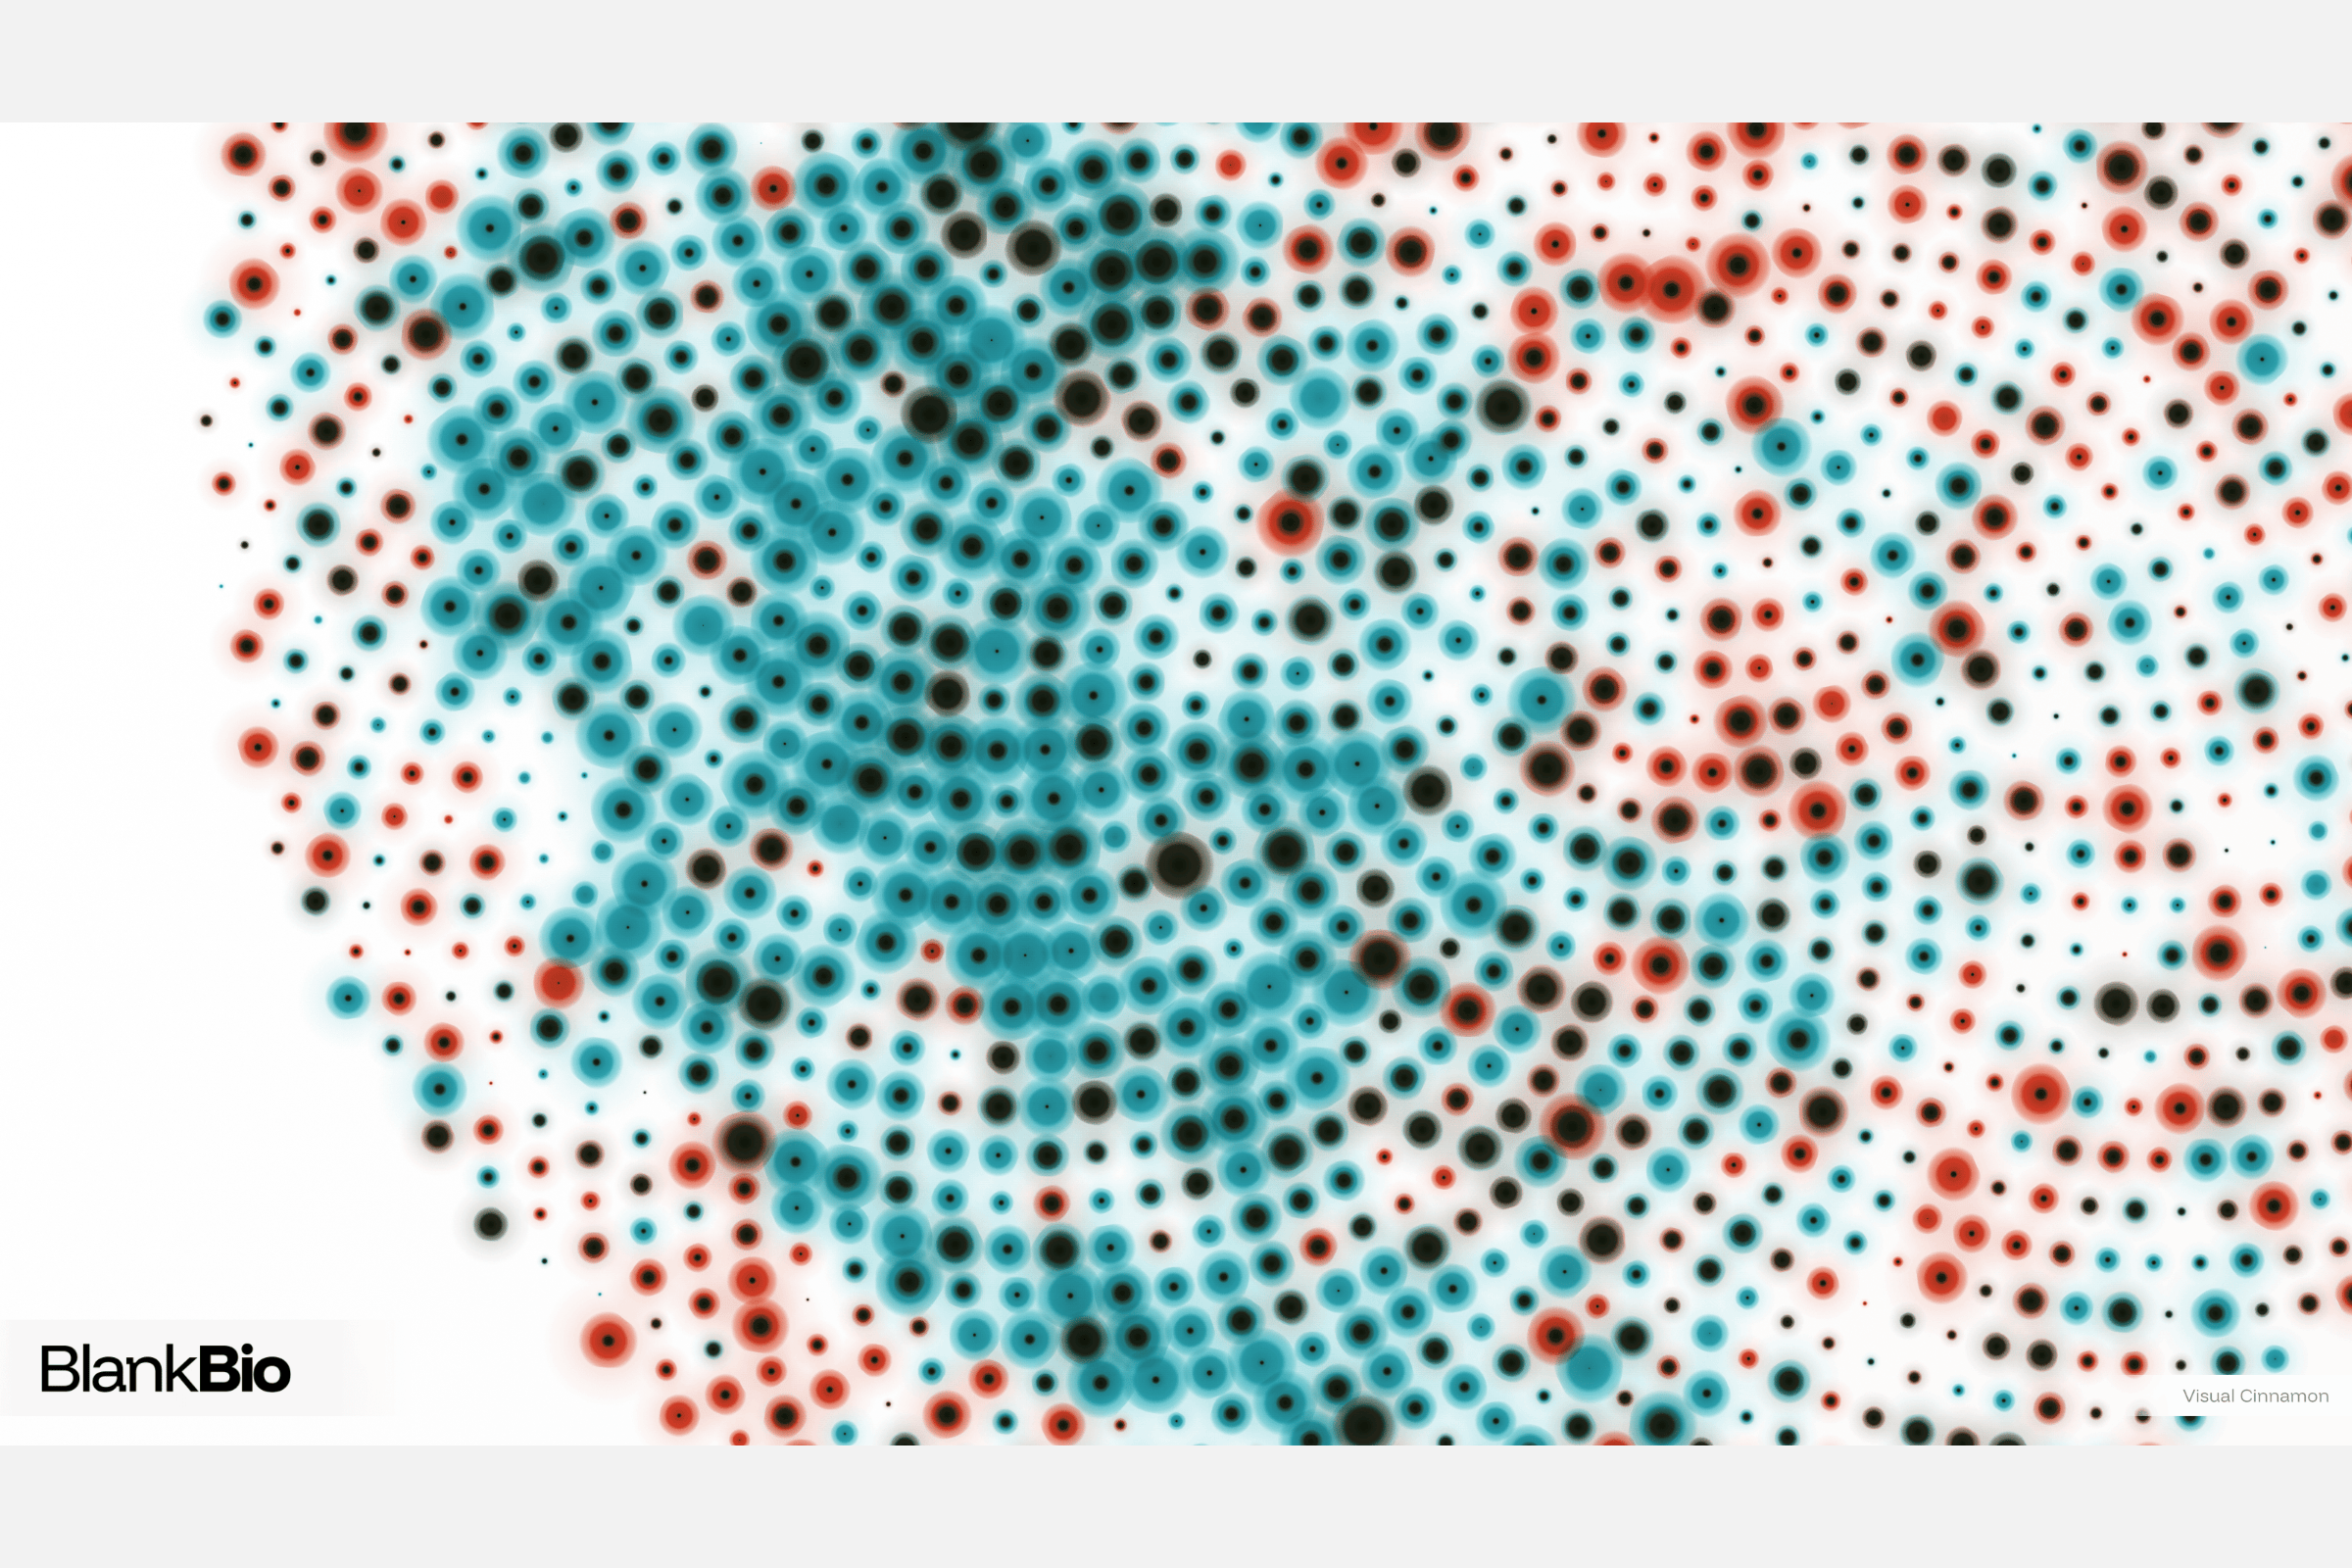
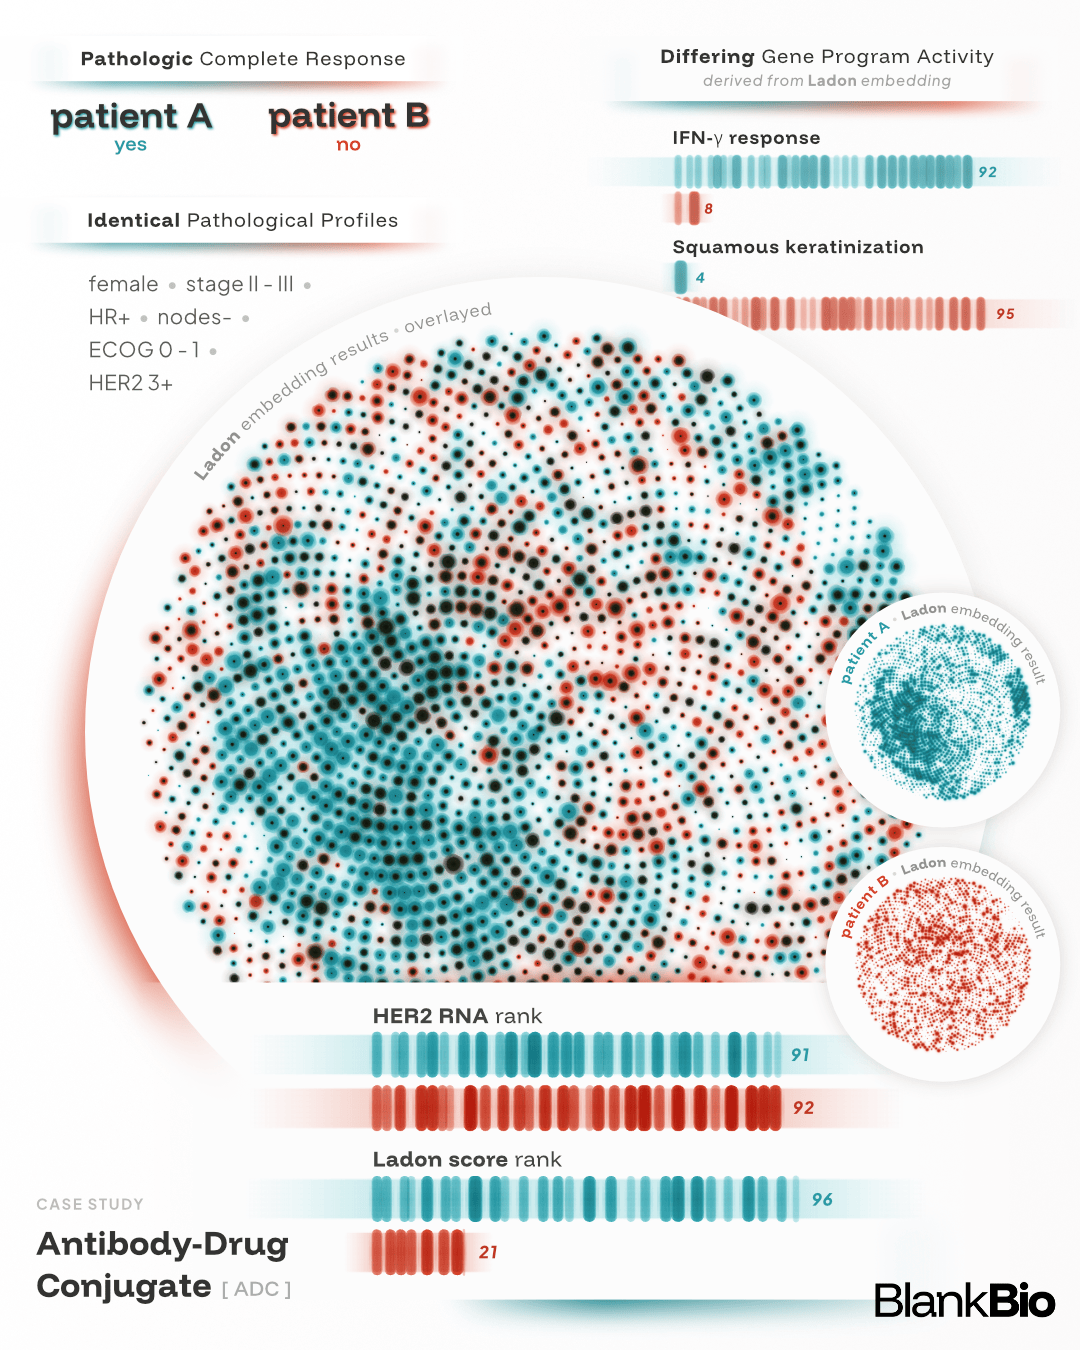
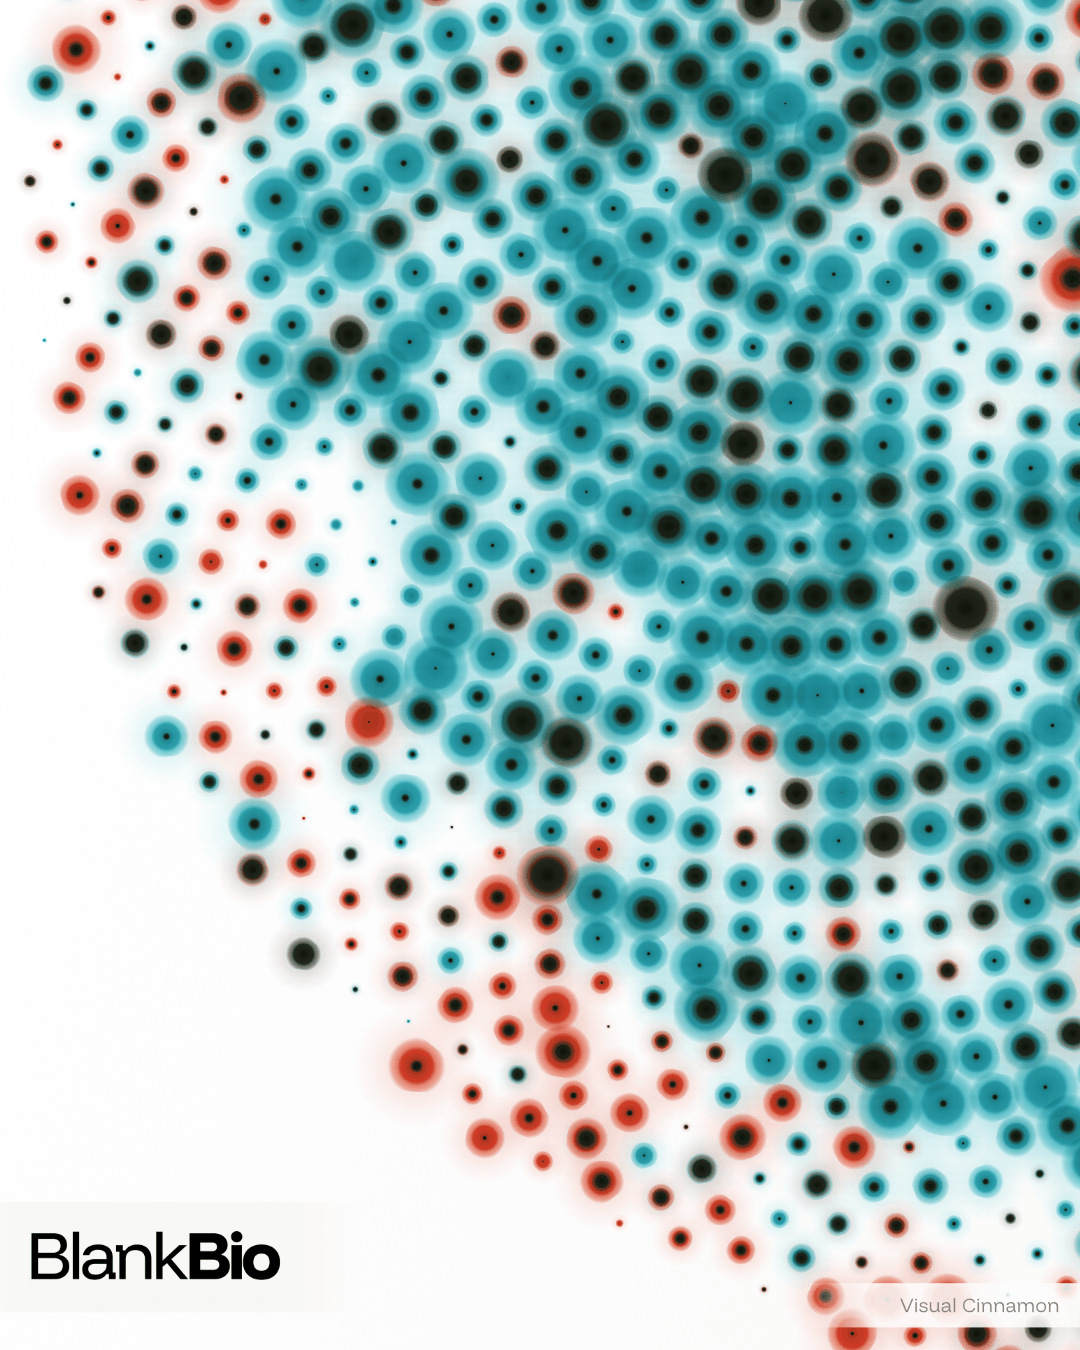
In addition to the main infographic, I created a more abstract, art-driven version focusing solely on the central circular visual, along with two portrait-style layouts tailored for mobile and social media.