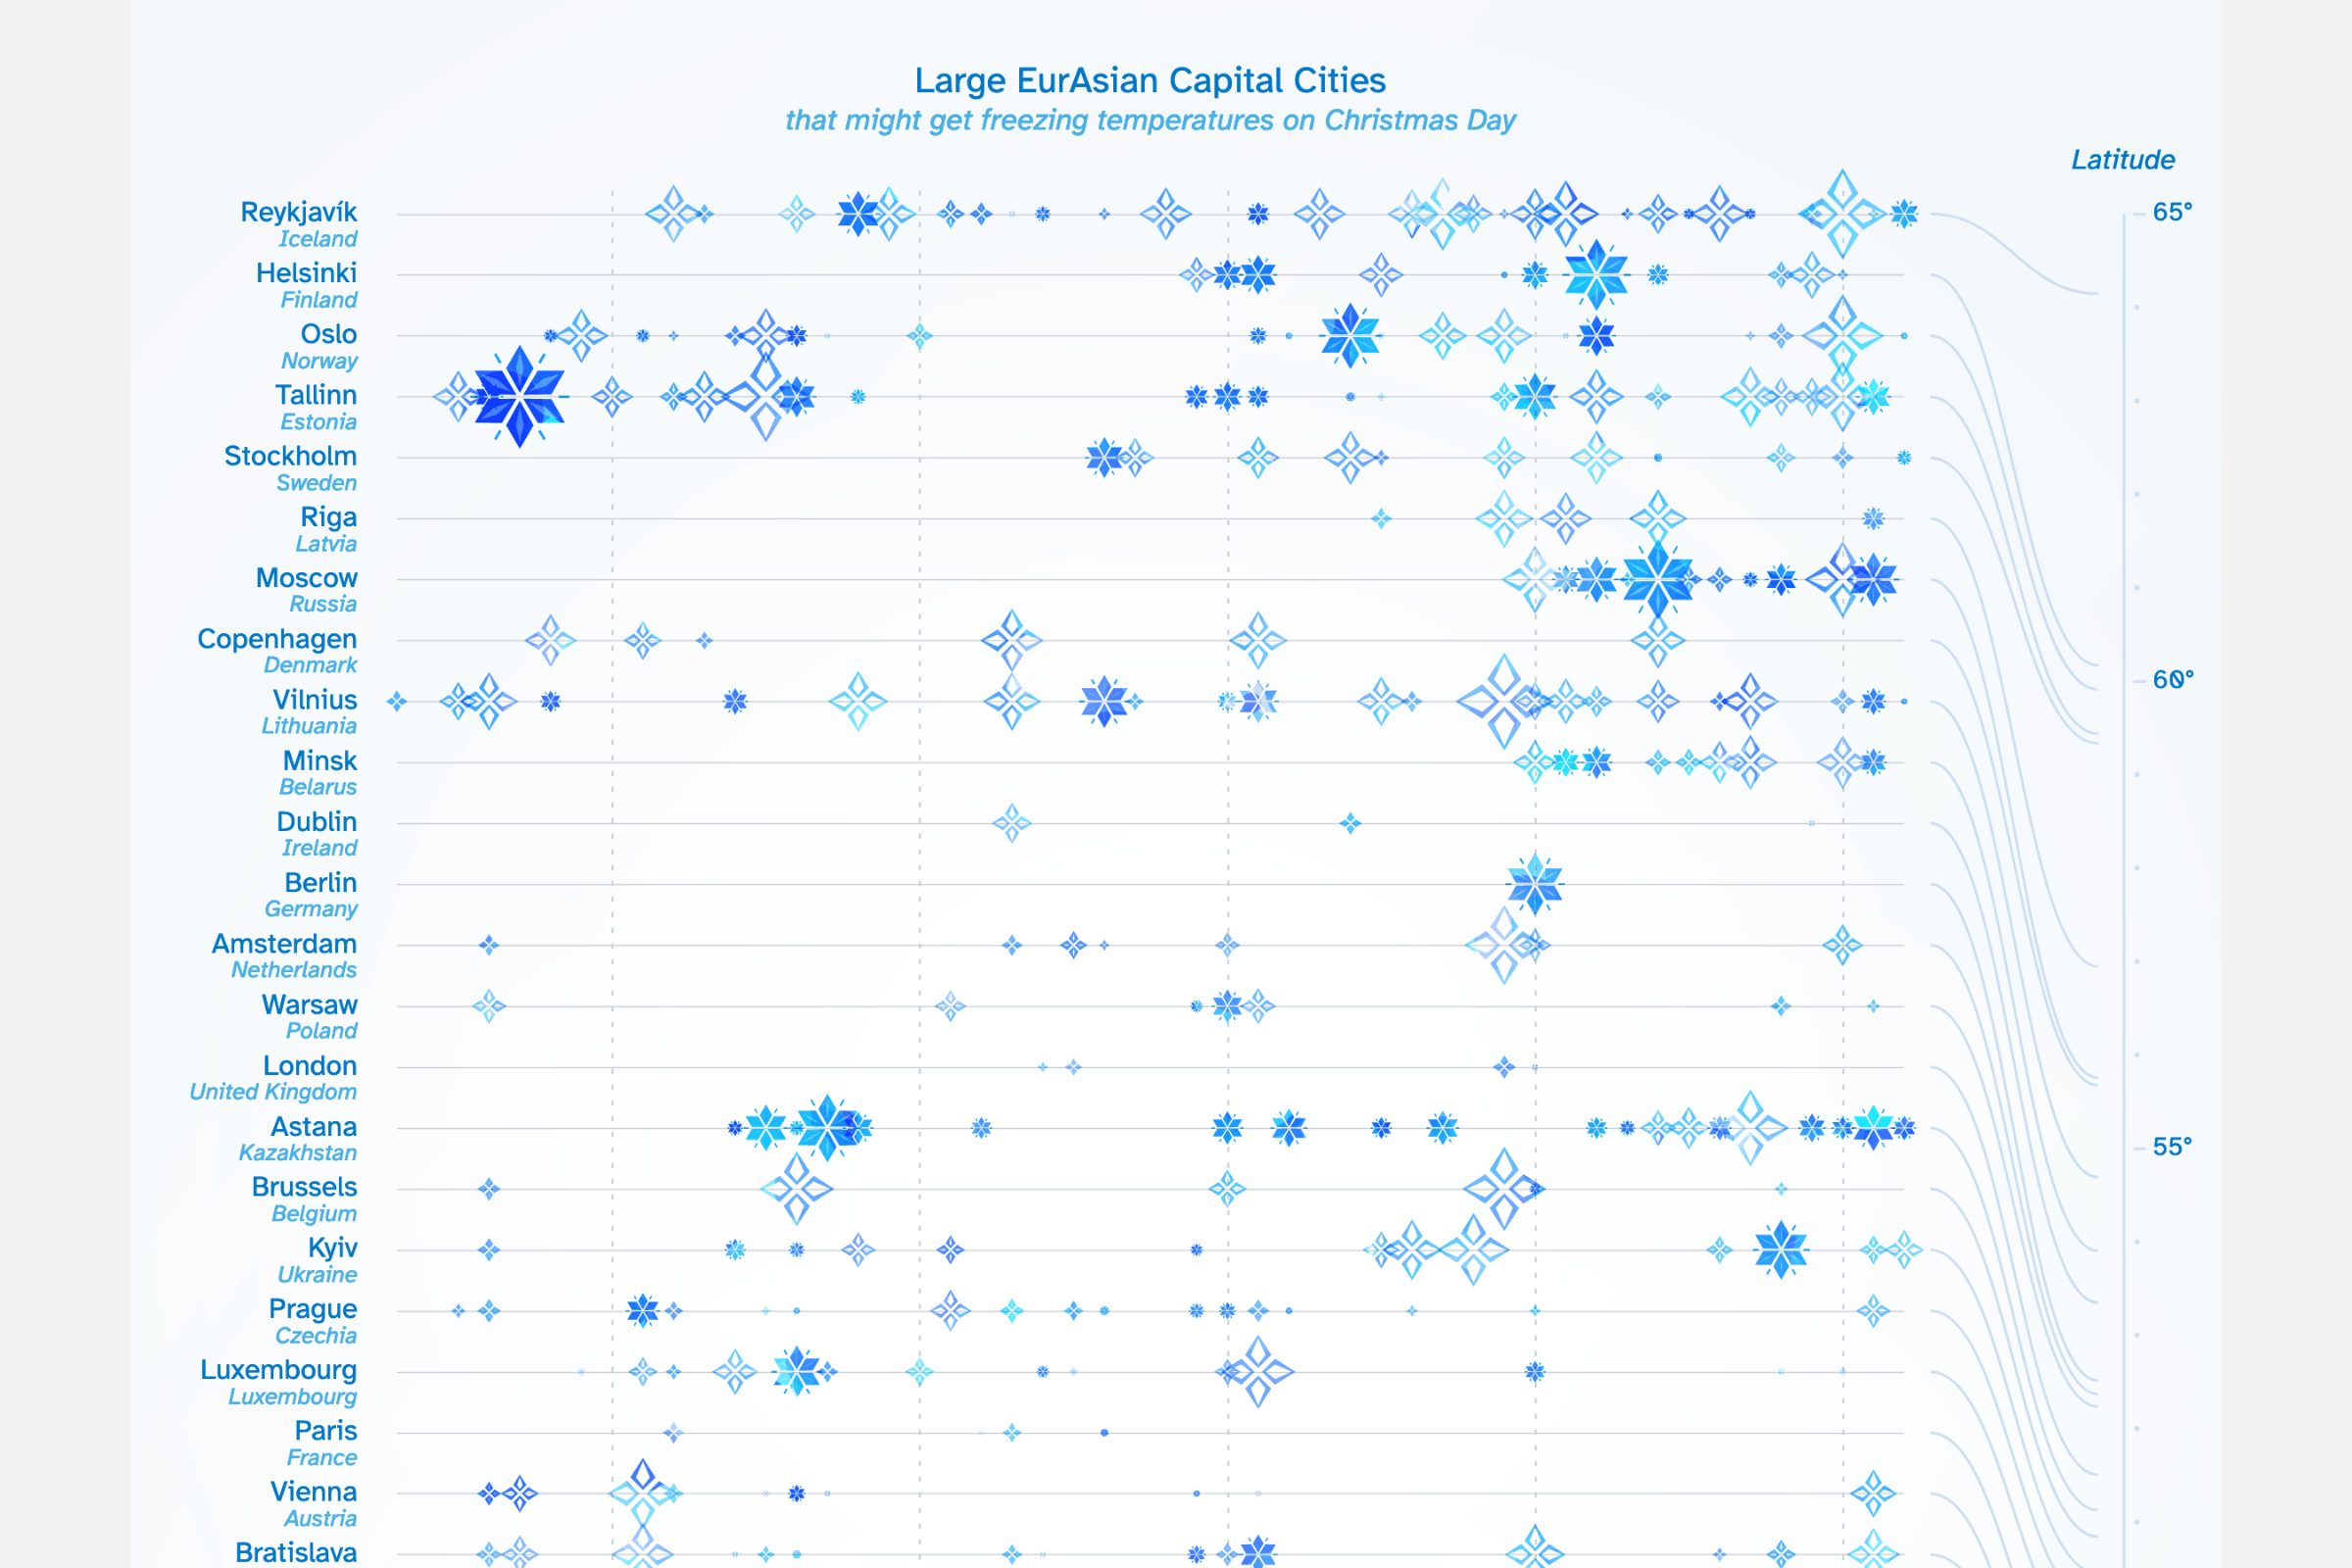
I’ve had this idea in mind to create a data visualization-inspired Christmas card to send out to all the people I’ve collaborated with since the first year I started Visual Cinnamon. And then it took seven whole years before I finally took the time to create the first! But better late than never. If you’re like me, you’re probably also hoping for a white Christmas. And so, for my (first) Christmas card, I reveal at which large (capital) cities it has snowed on Christmas day across the past 50 years.
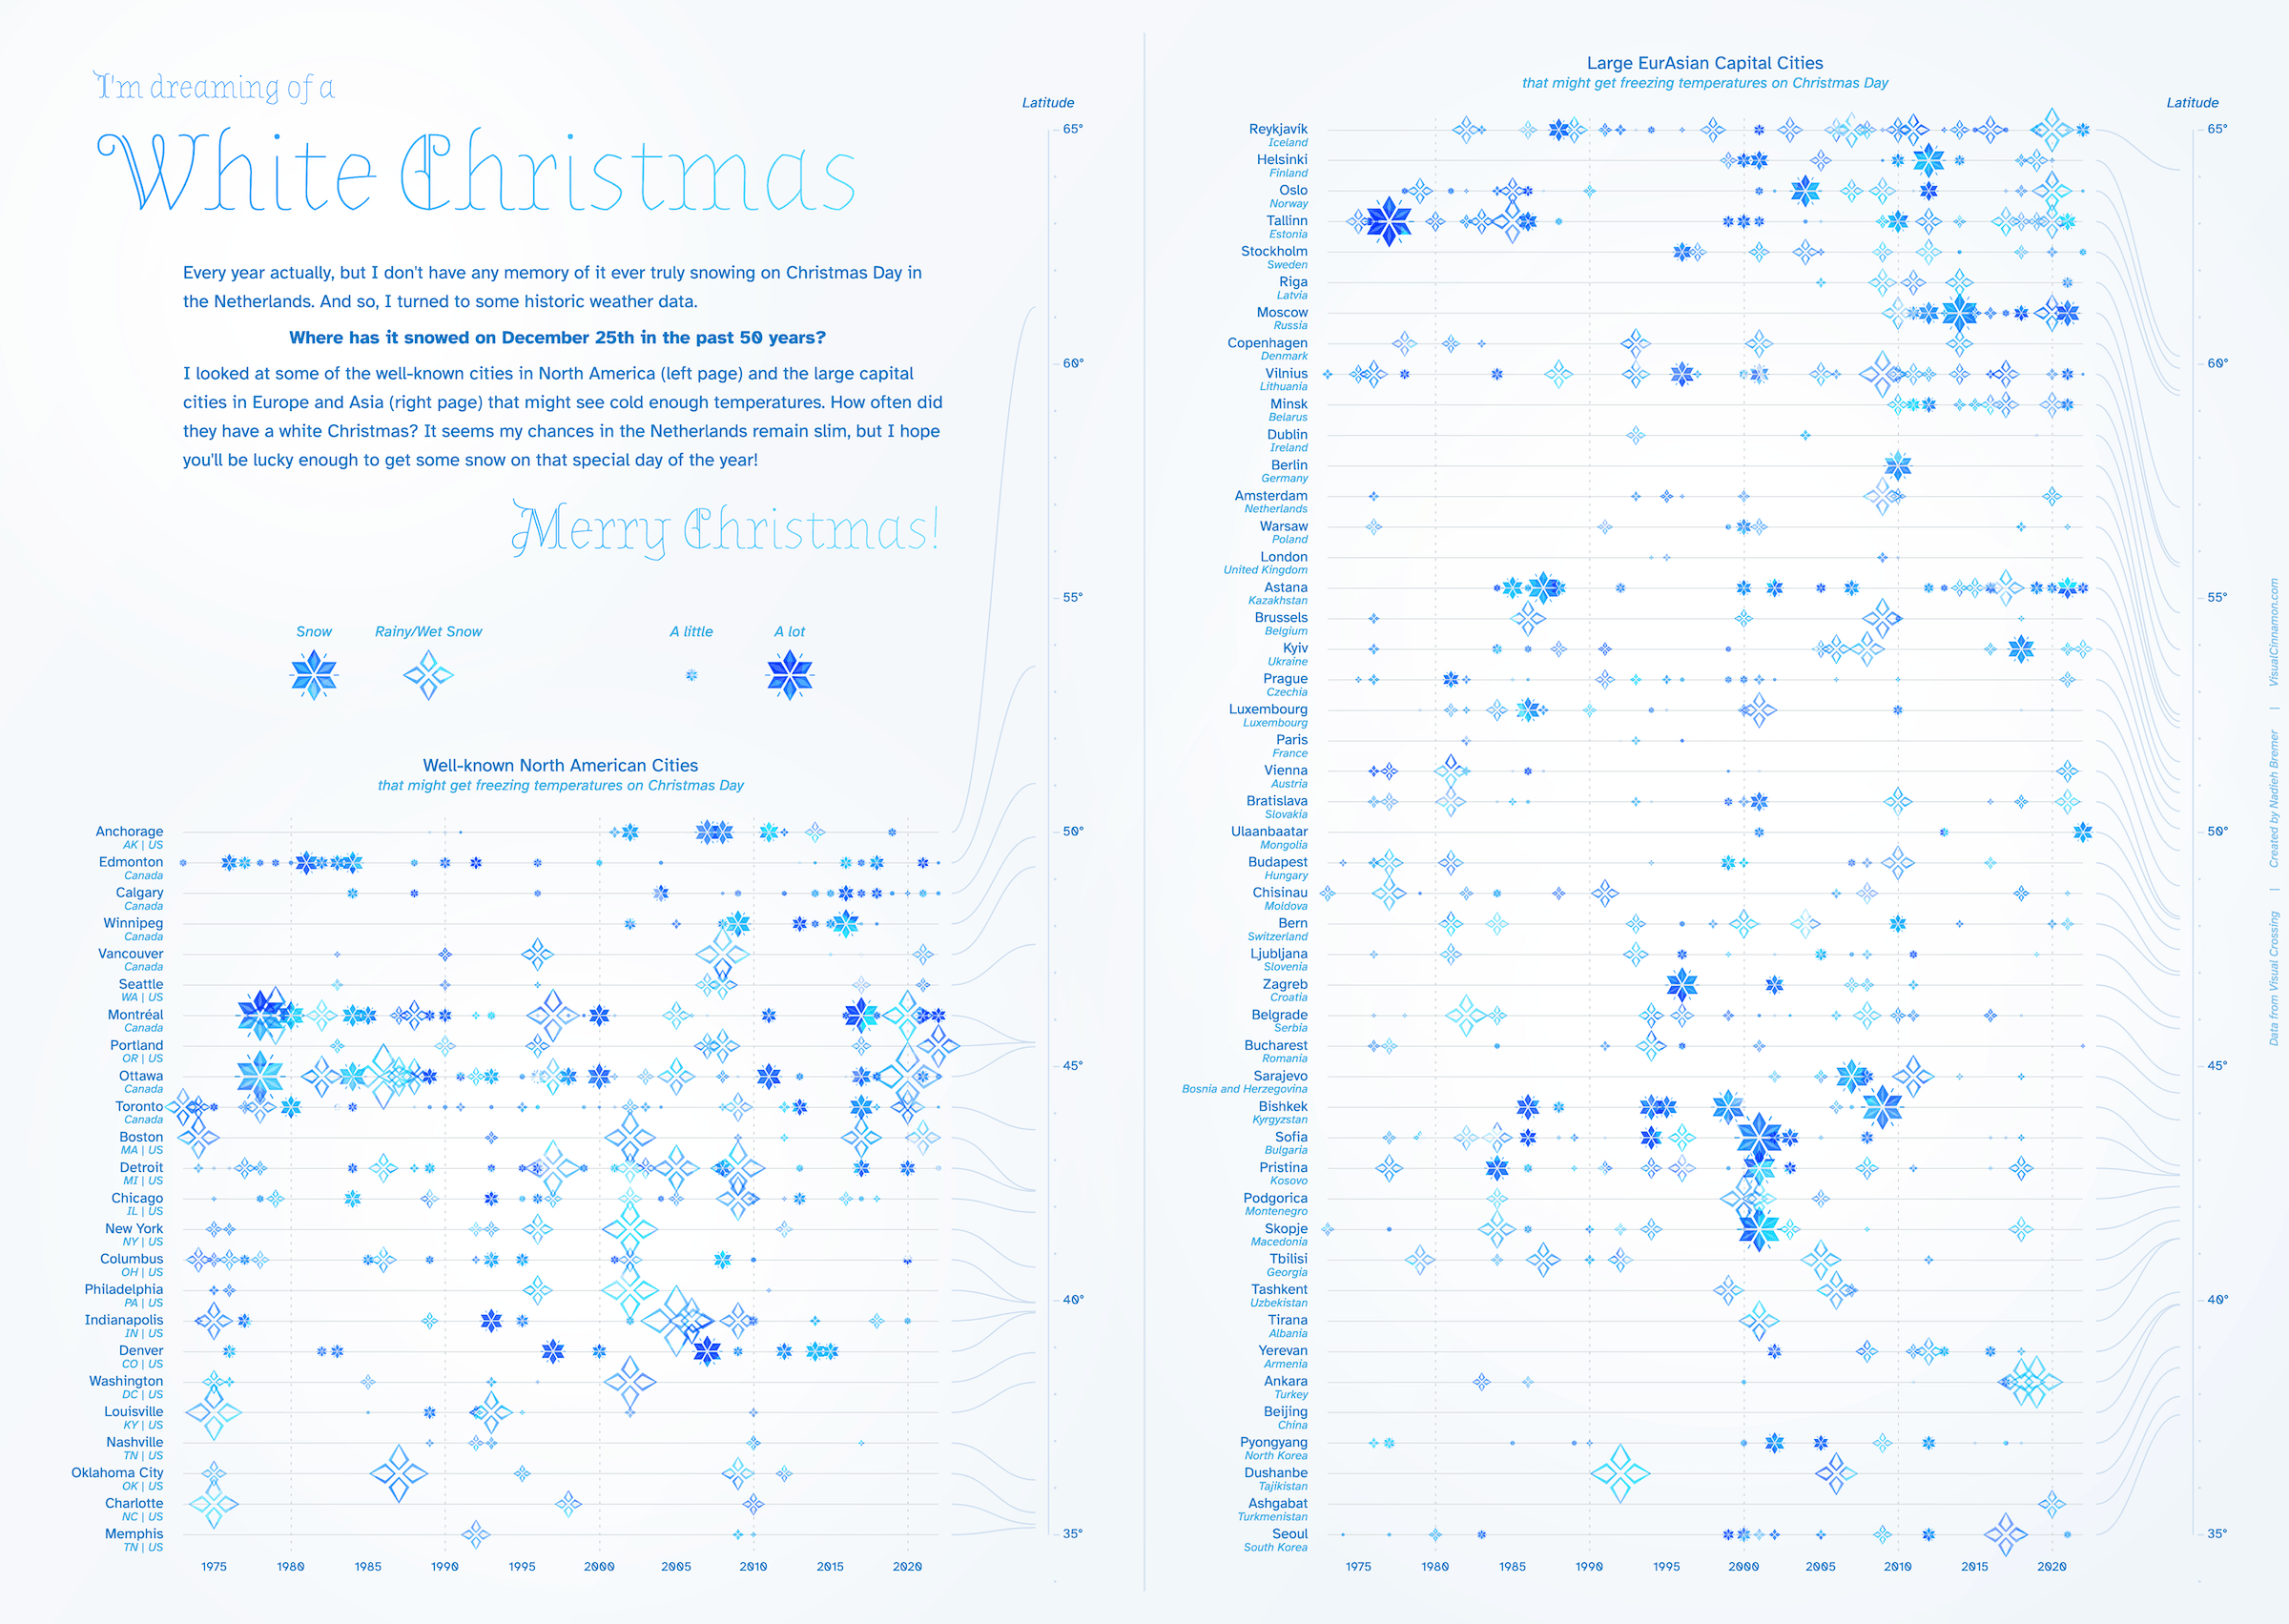
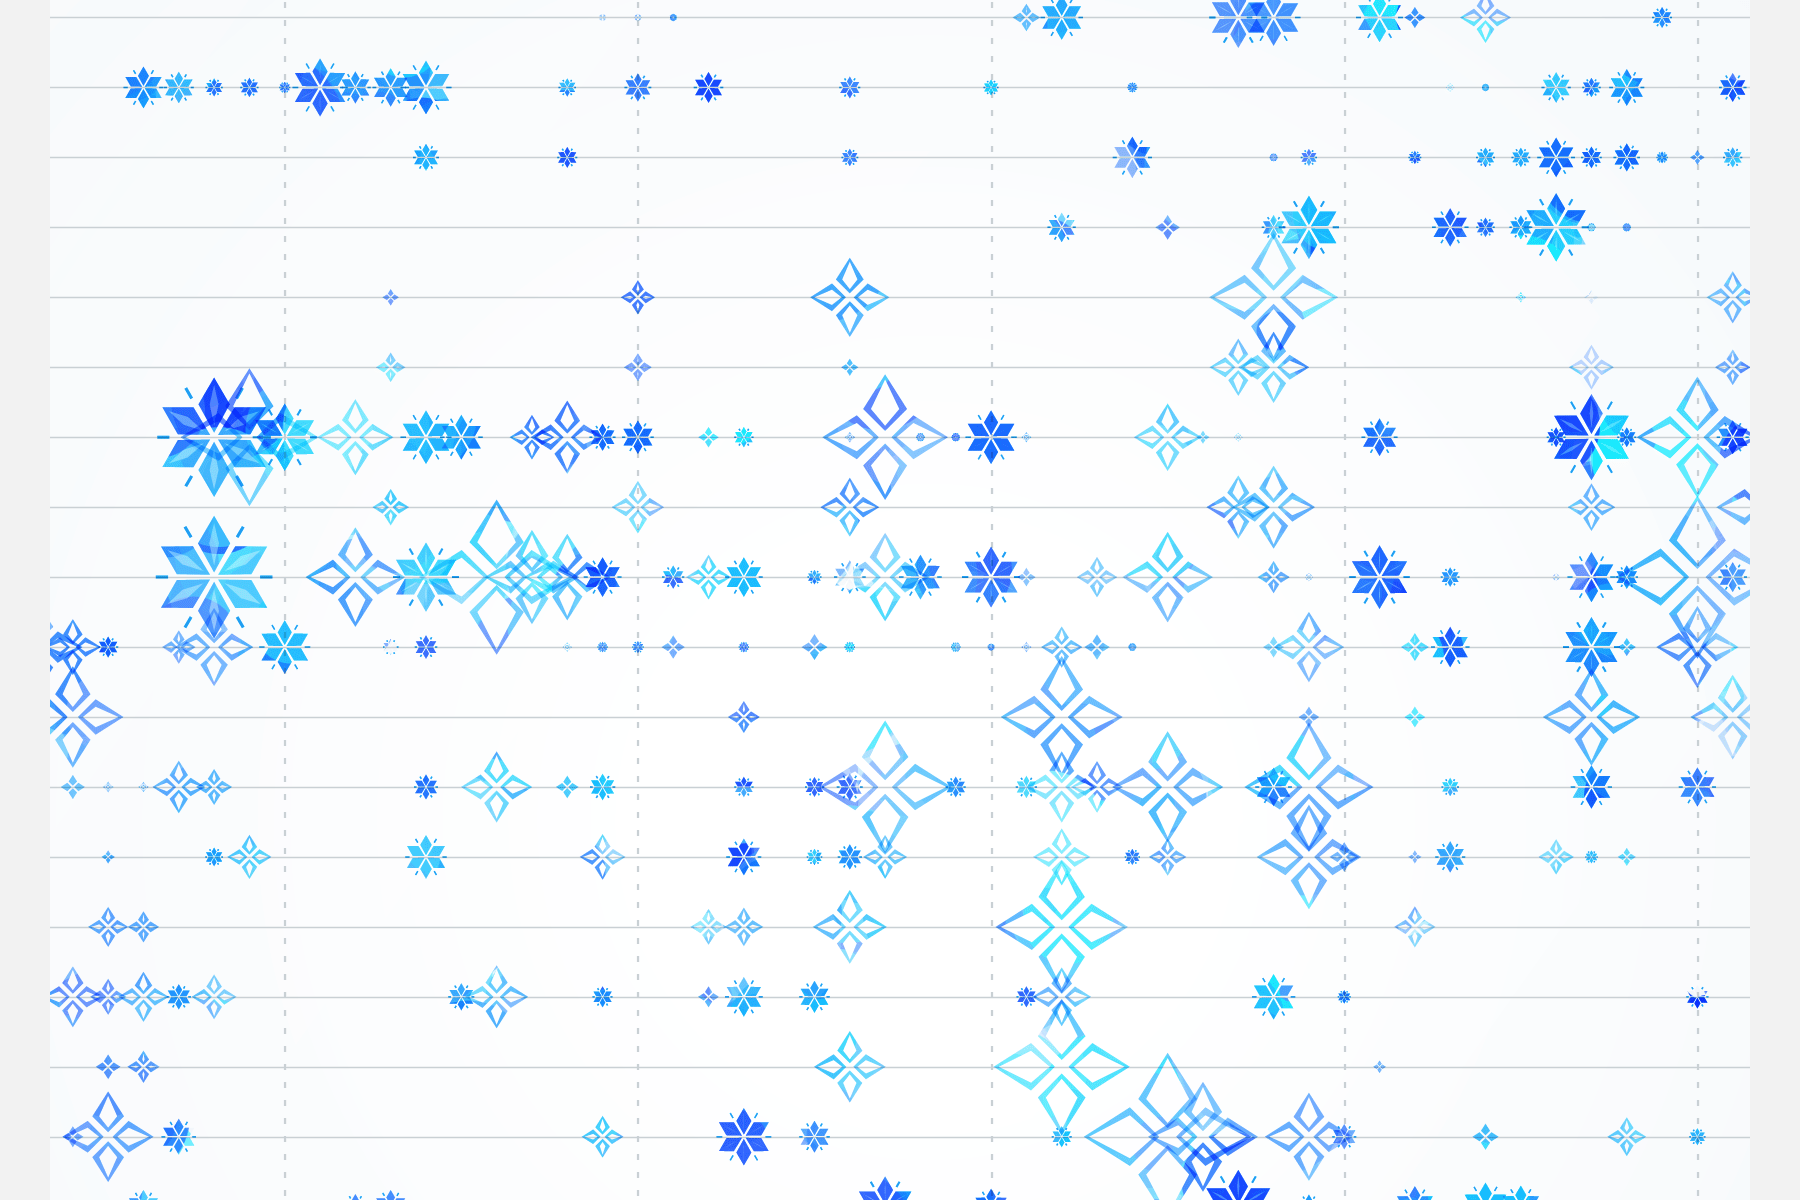
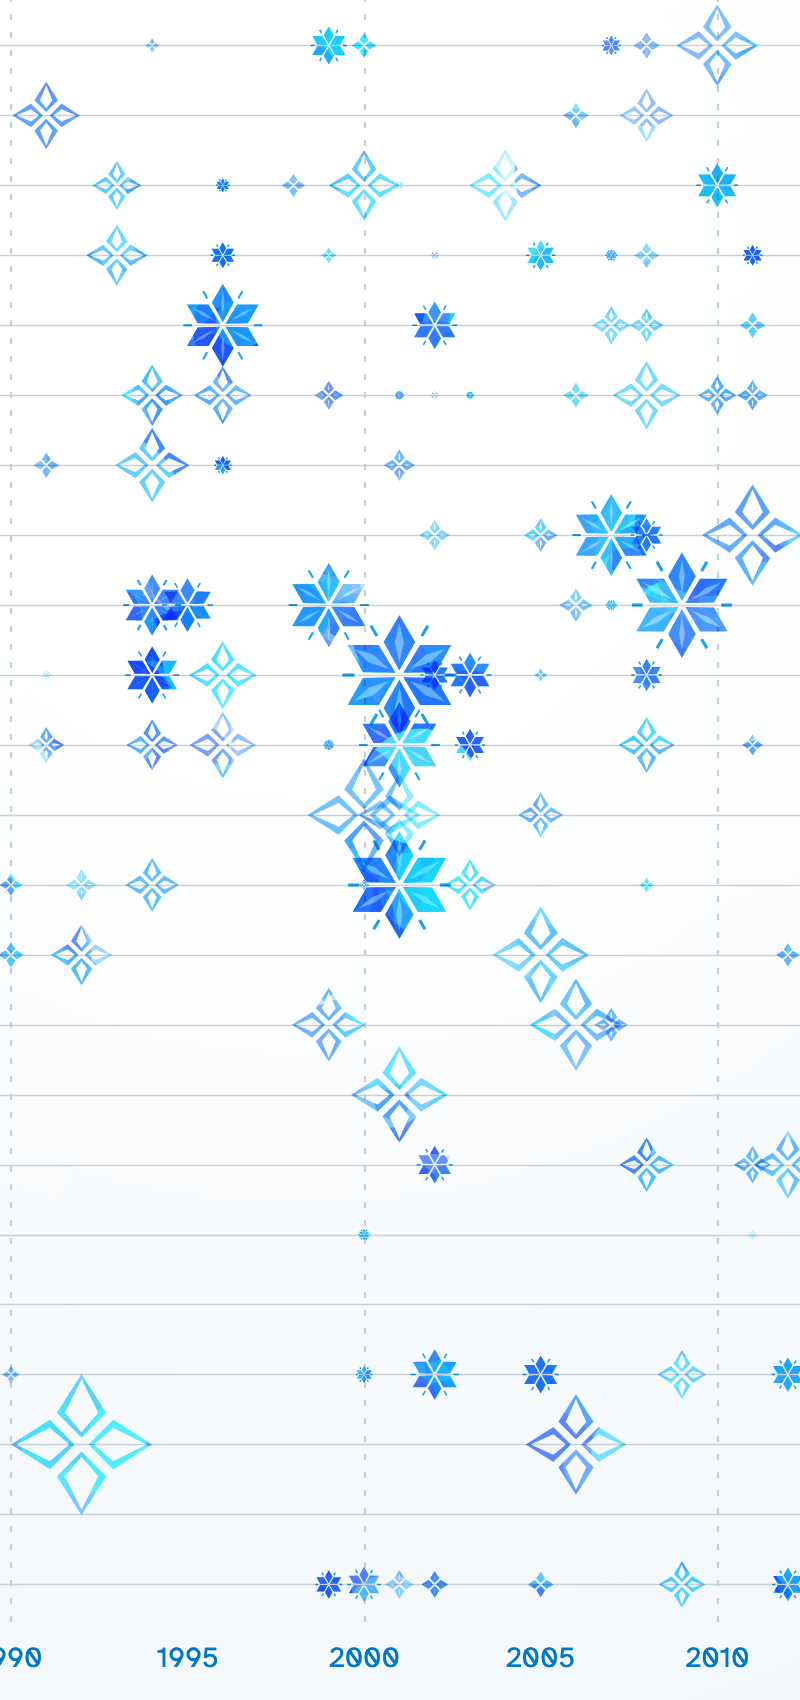
For my first Christmas Card I wanted to create something that would be pretty easy to understand, but also with a bit of creativity. Seeing as how snow is so tied to Christmas, and weather data is straightforward to work with this seemed like a good fit. It would be a “simple” grid, but with each “snow” day represented by a beautiful snowflake.
I initially tried to create 3D crystal-like snowflakes using Three.JS. However, sadly the snowflakes representing the years of snow were too small to see the effect. I therefore reverted back to staying with 2D snowflakes, but using some color effects and color blending to make them look a little more interesting.
I added a little bit of interactivity to the online version that makes it easier to see the year and city attached to each snowflake.