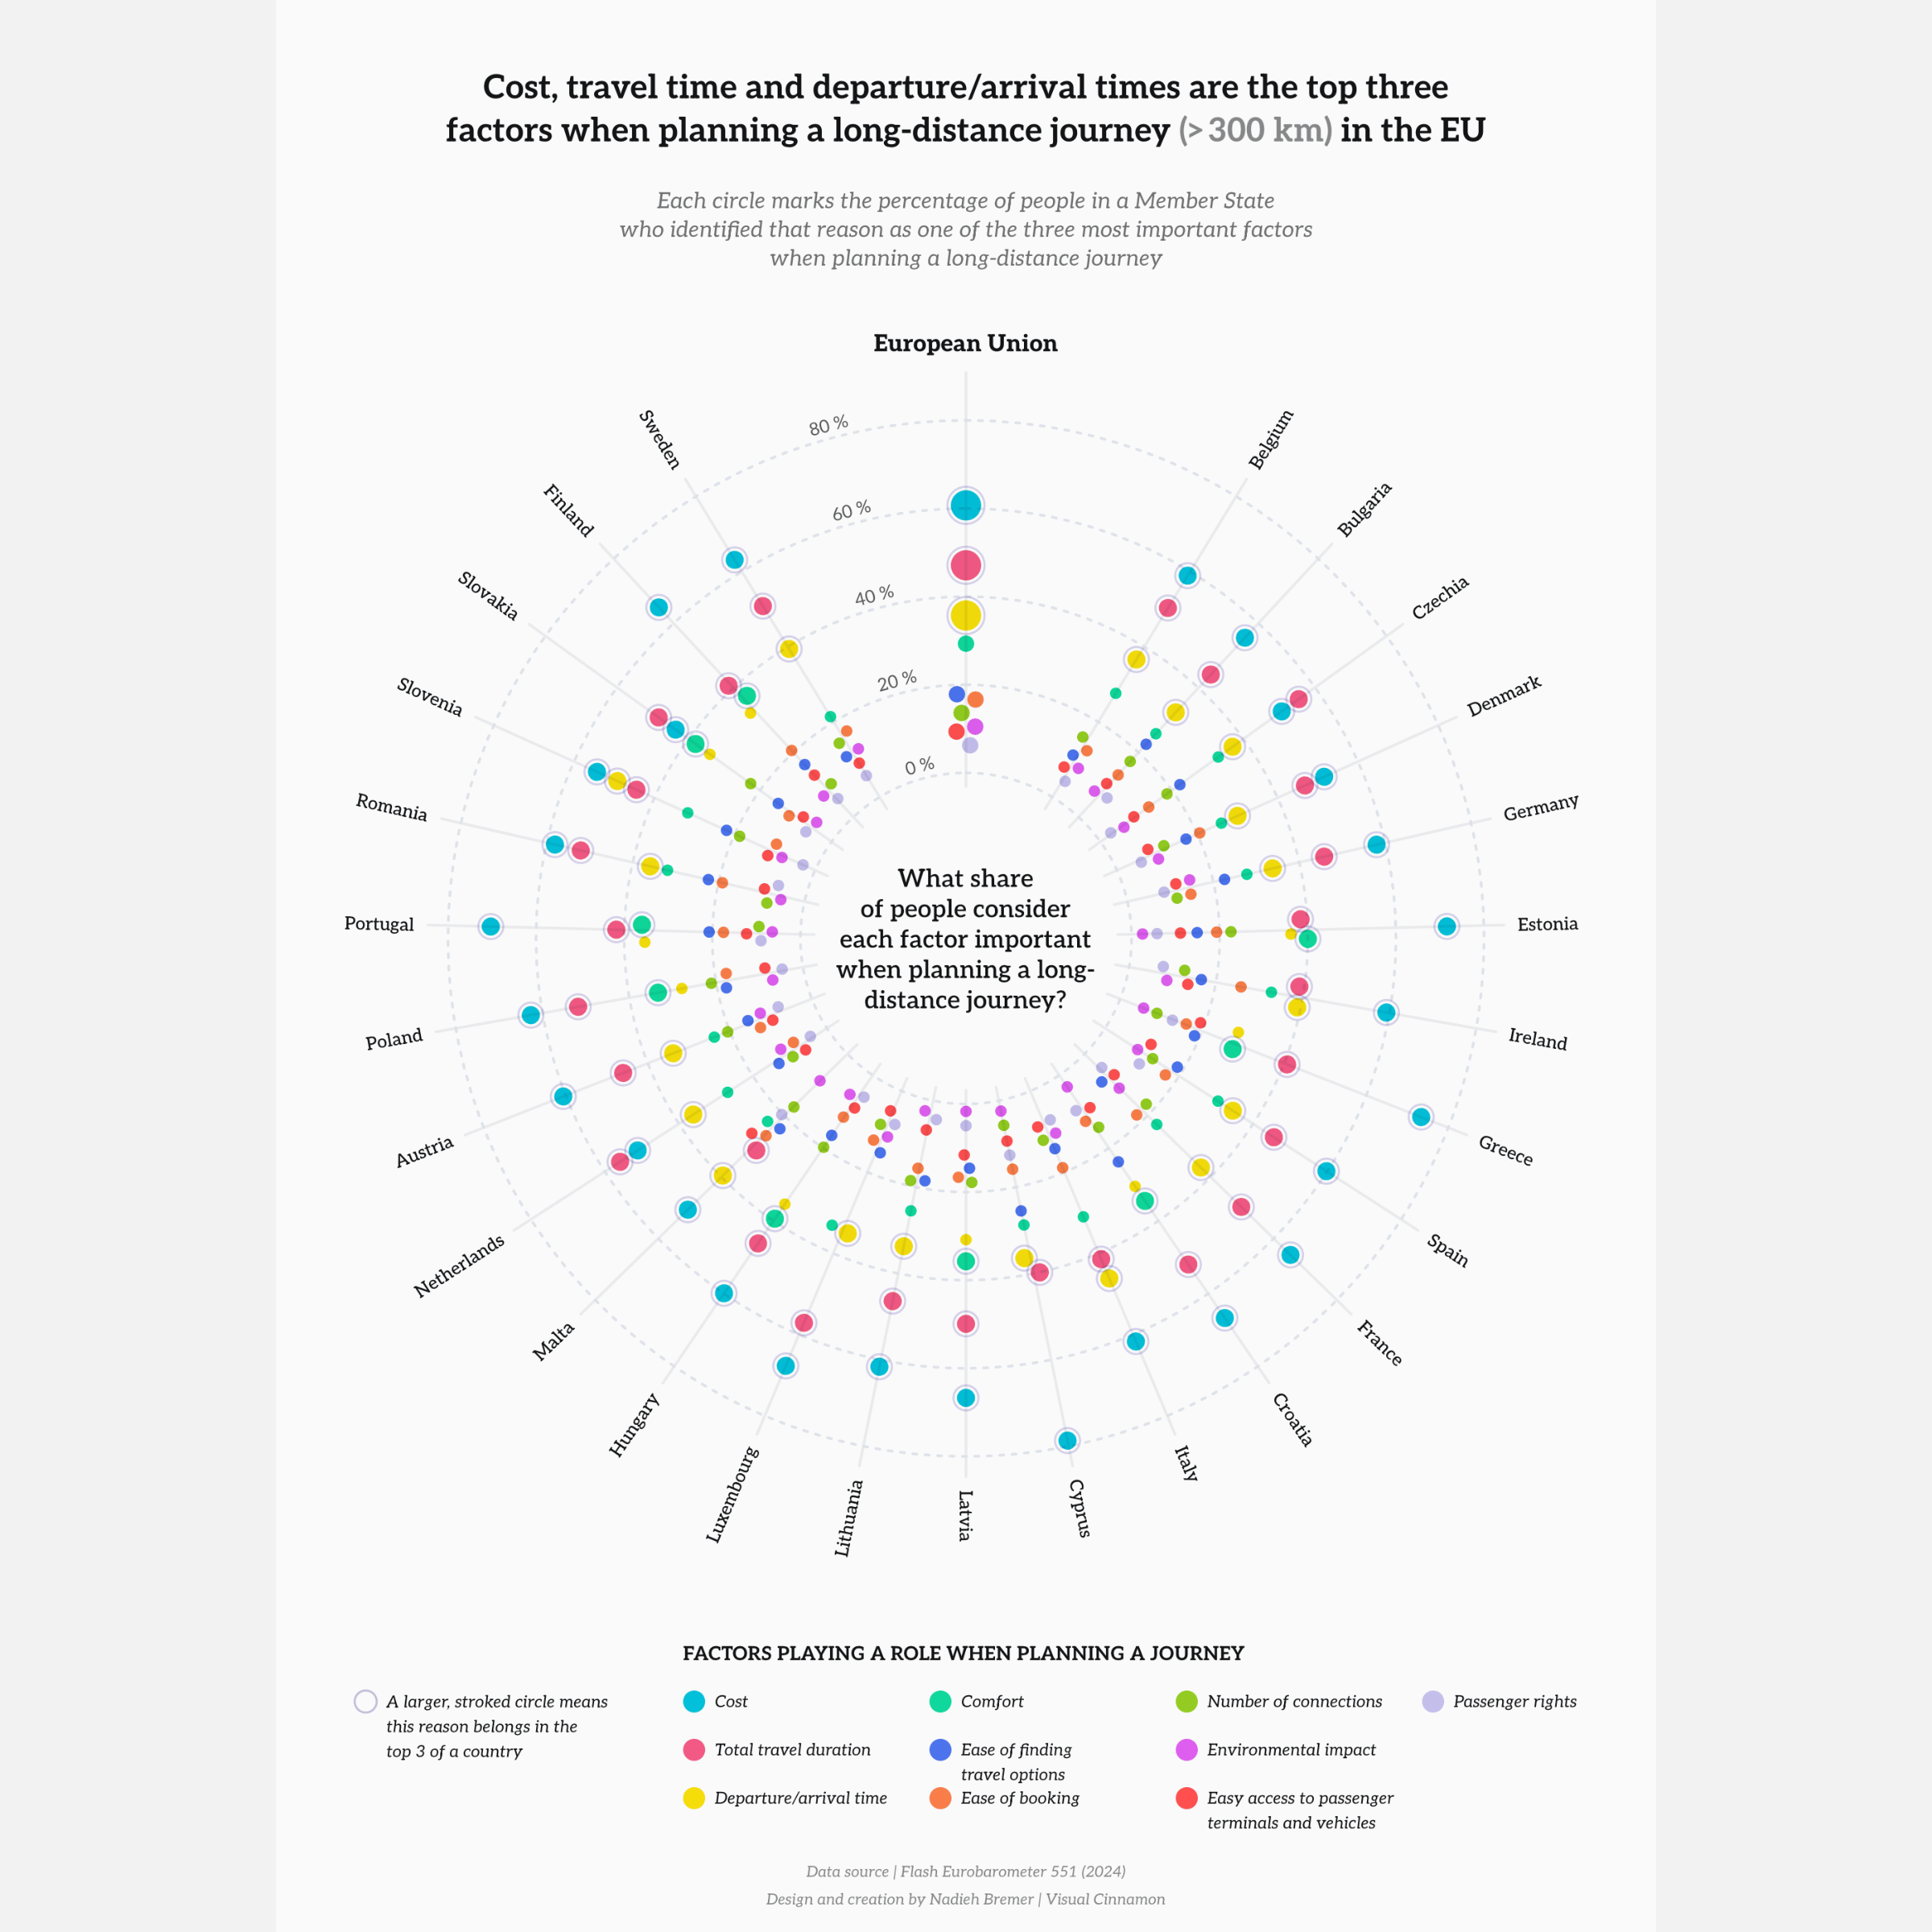
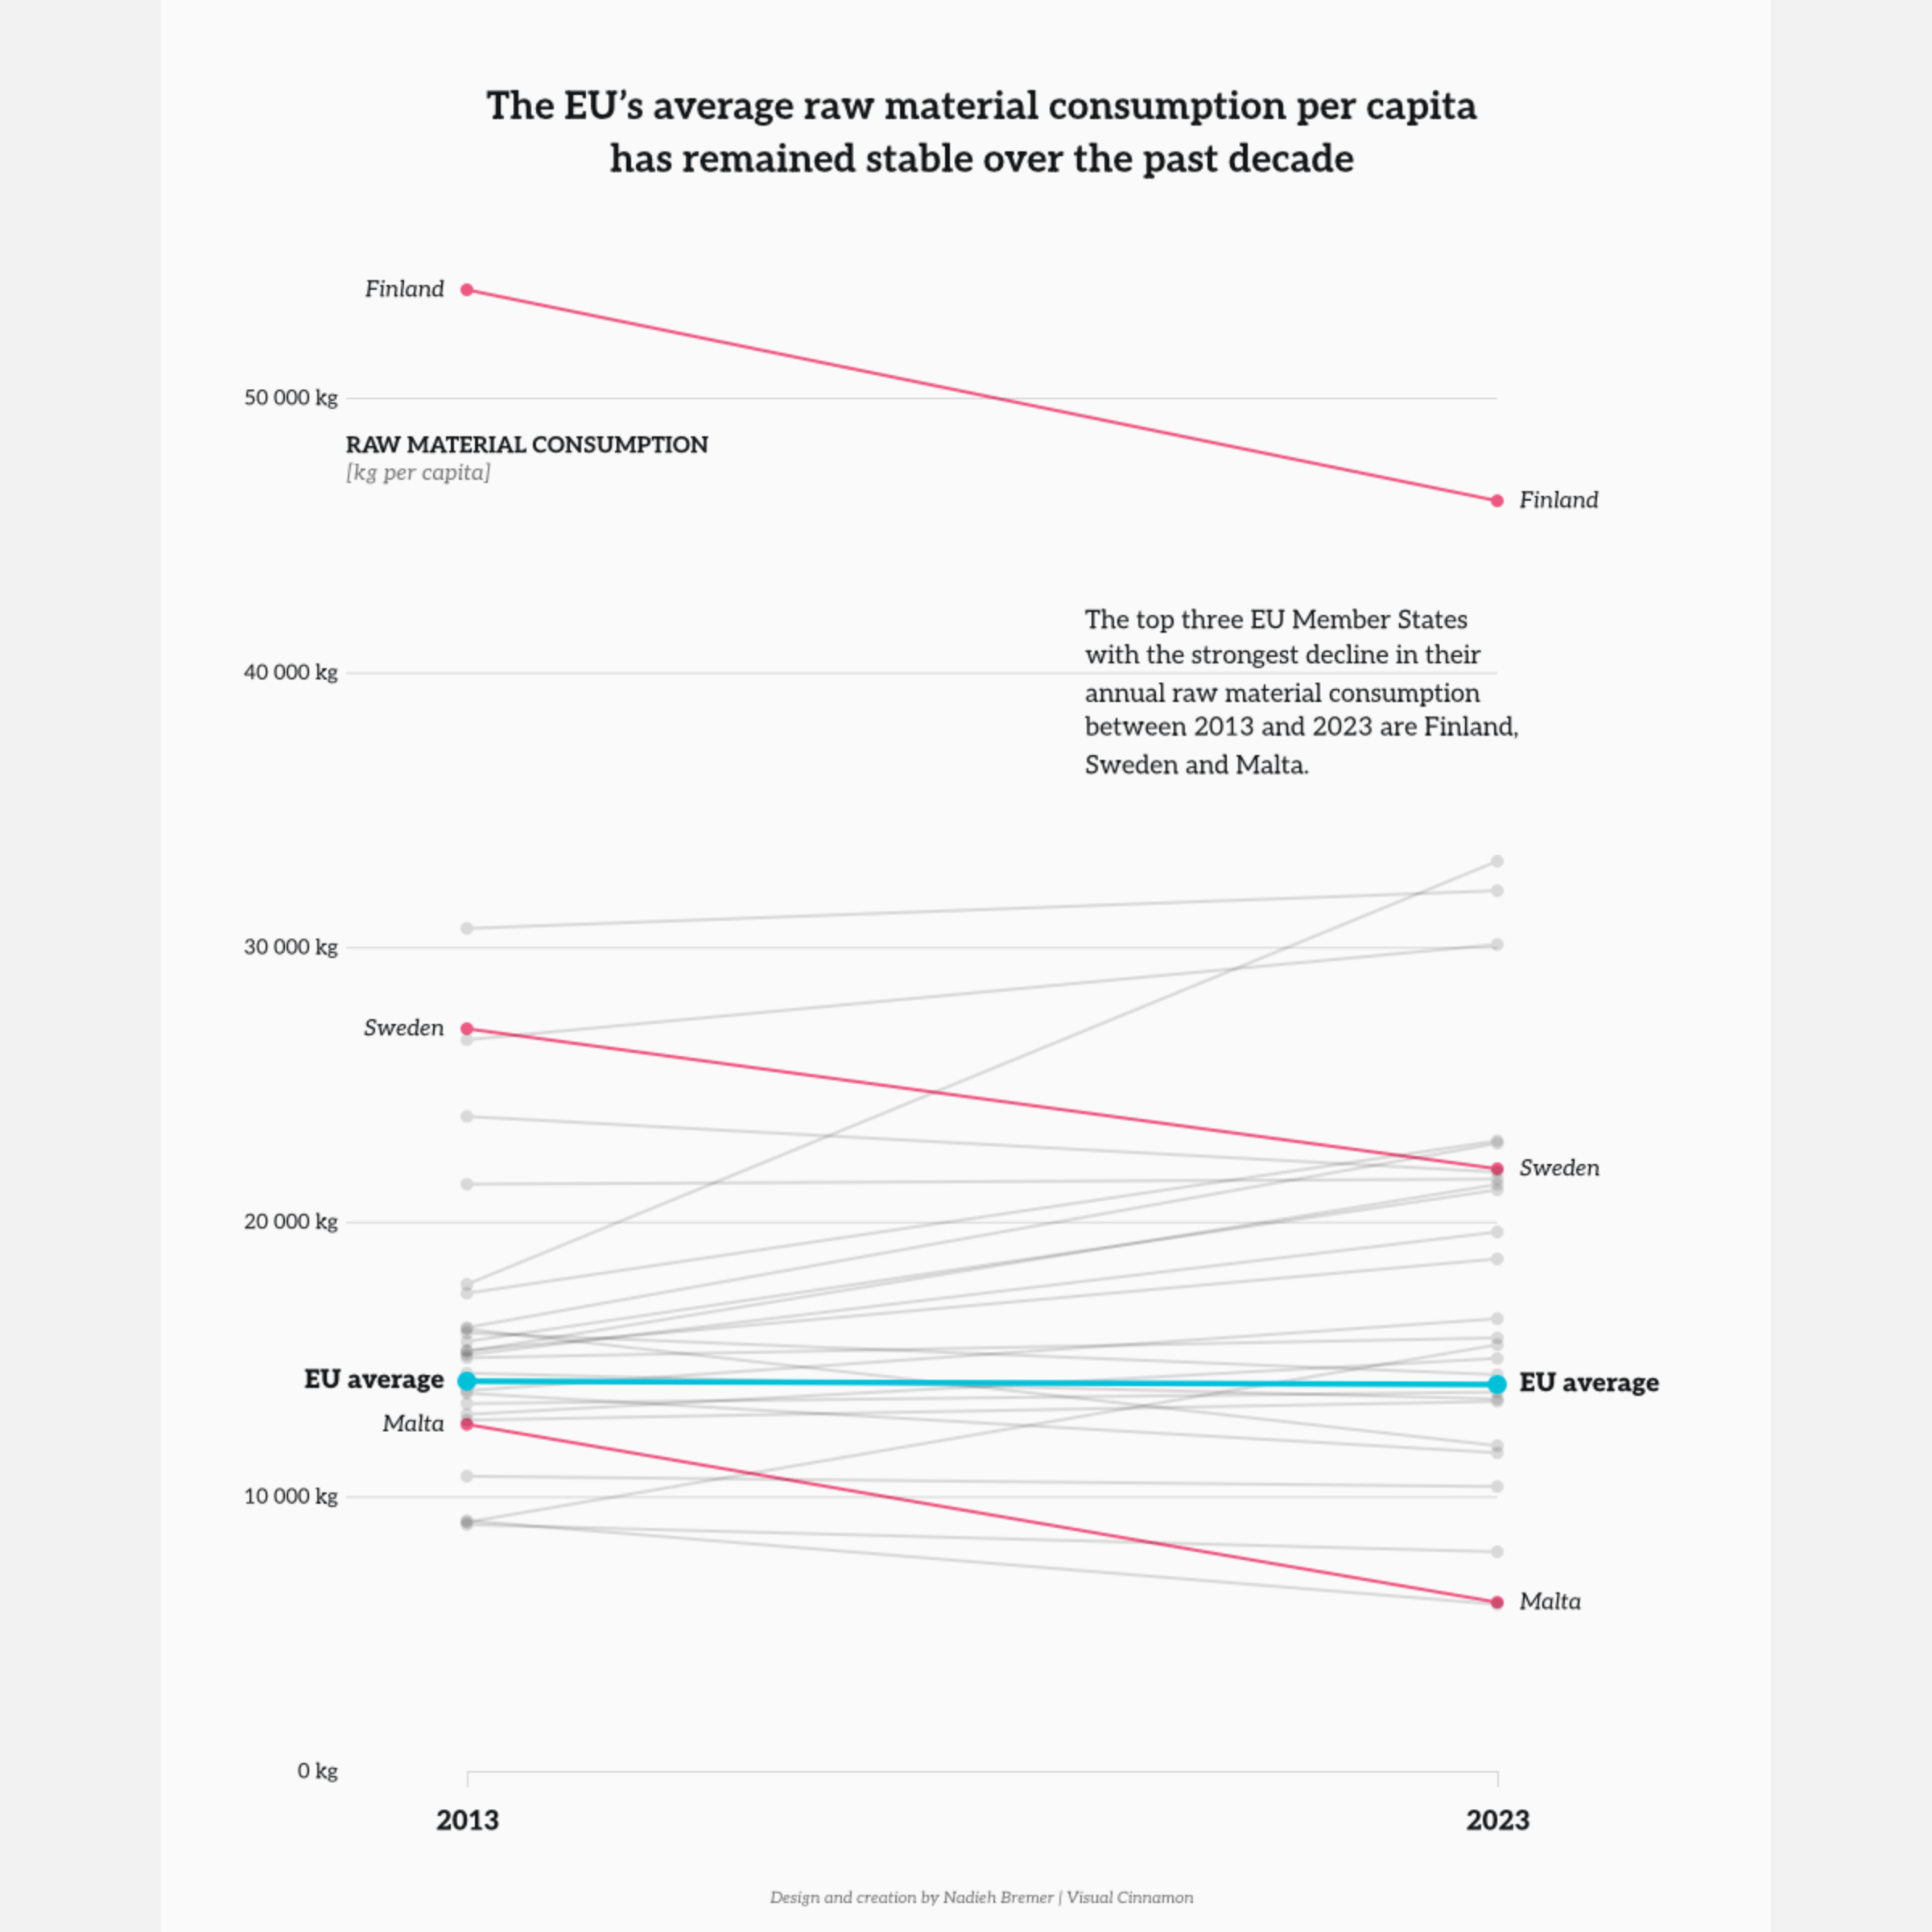
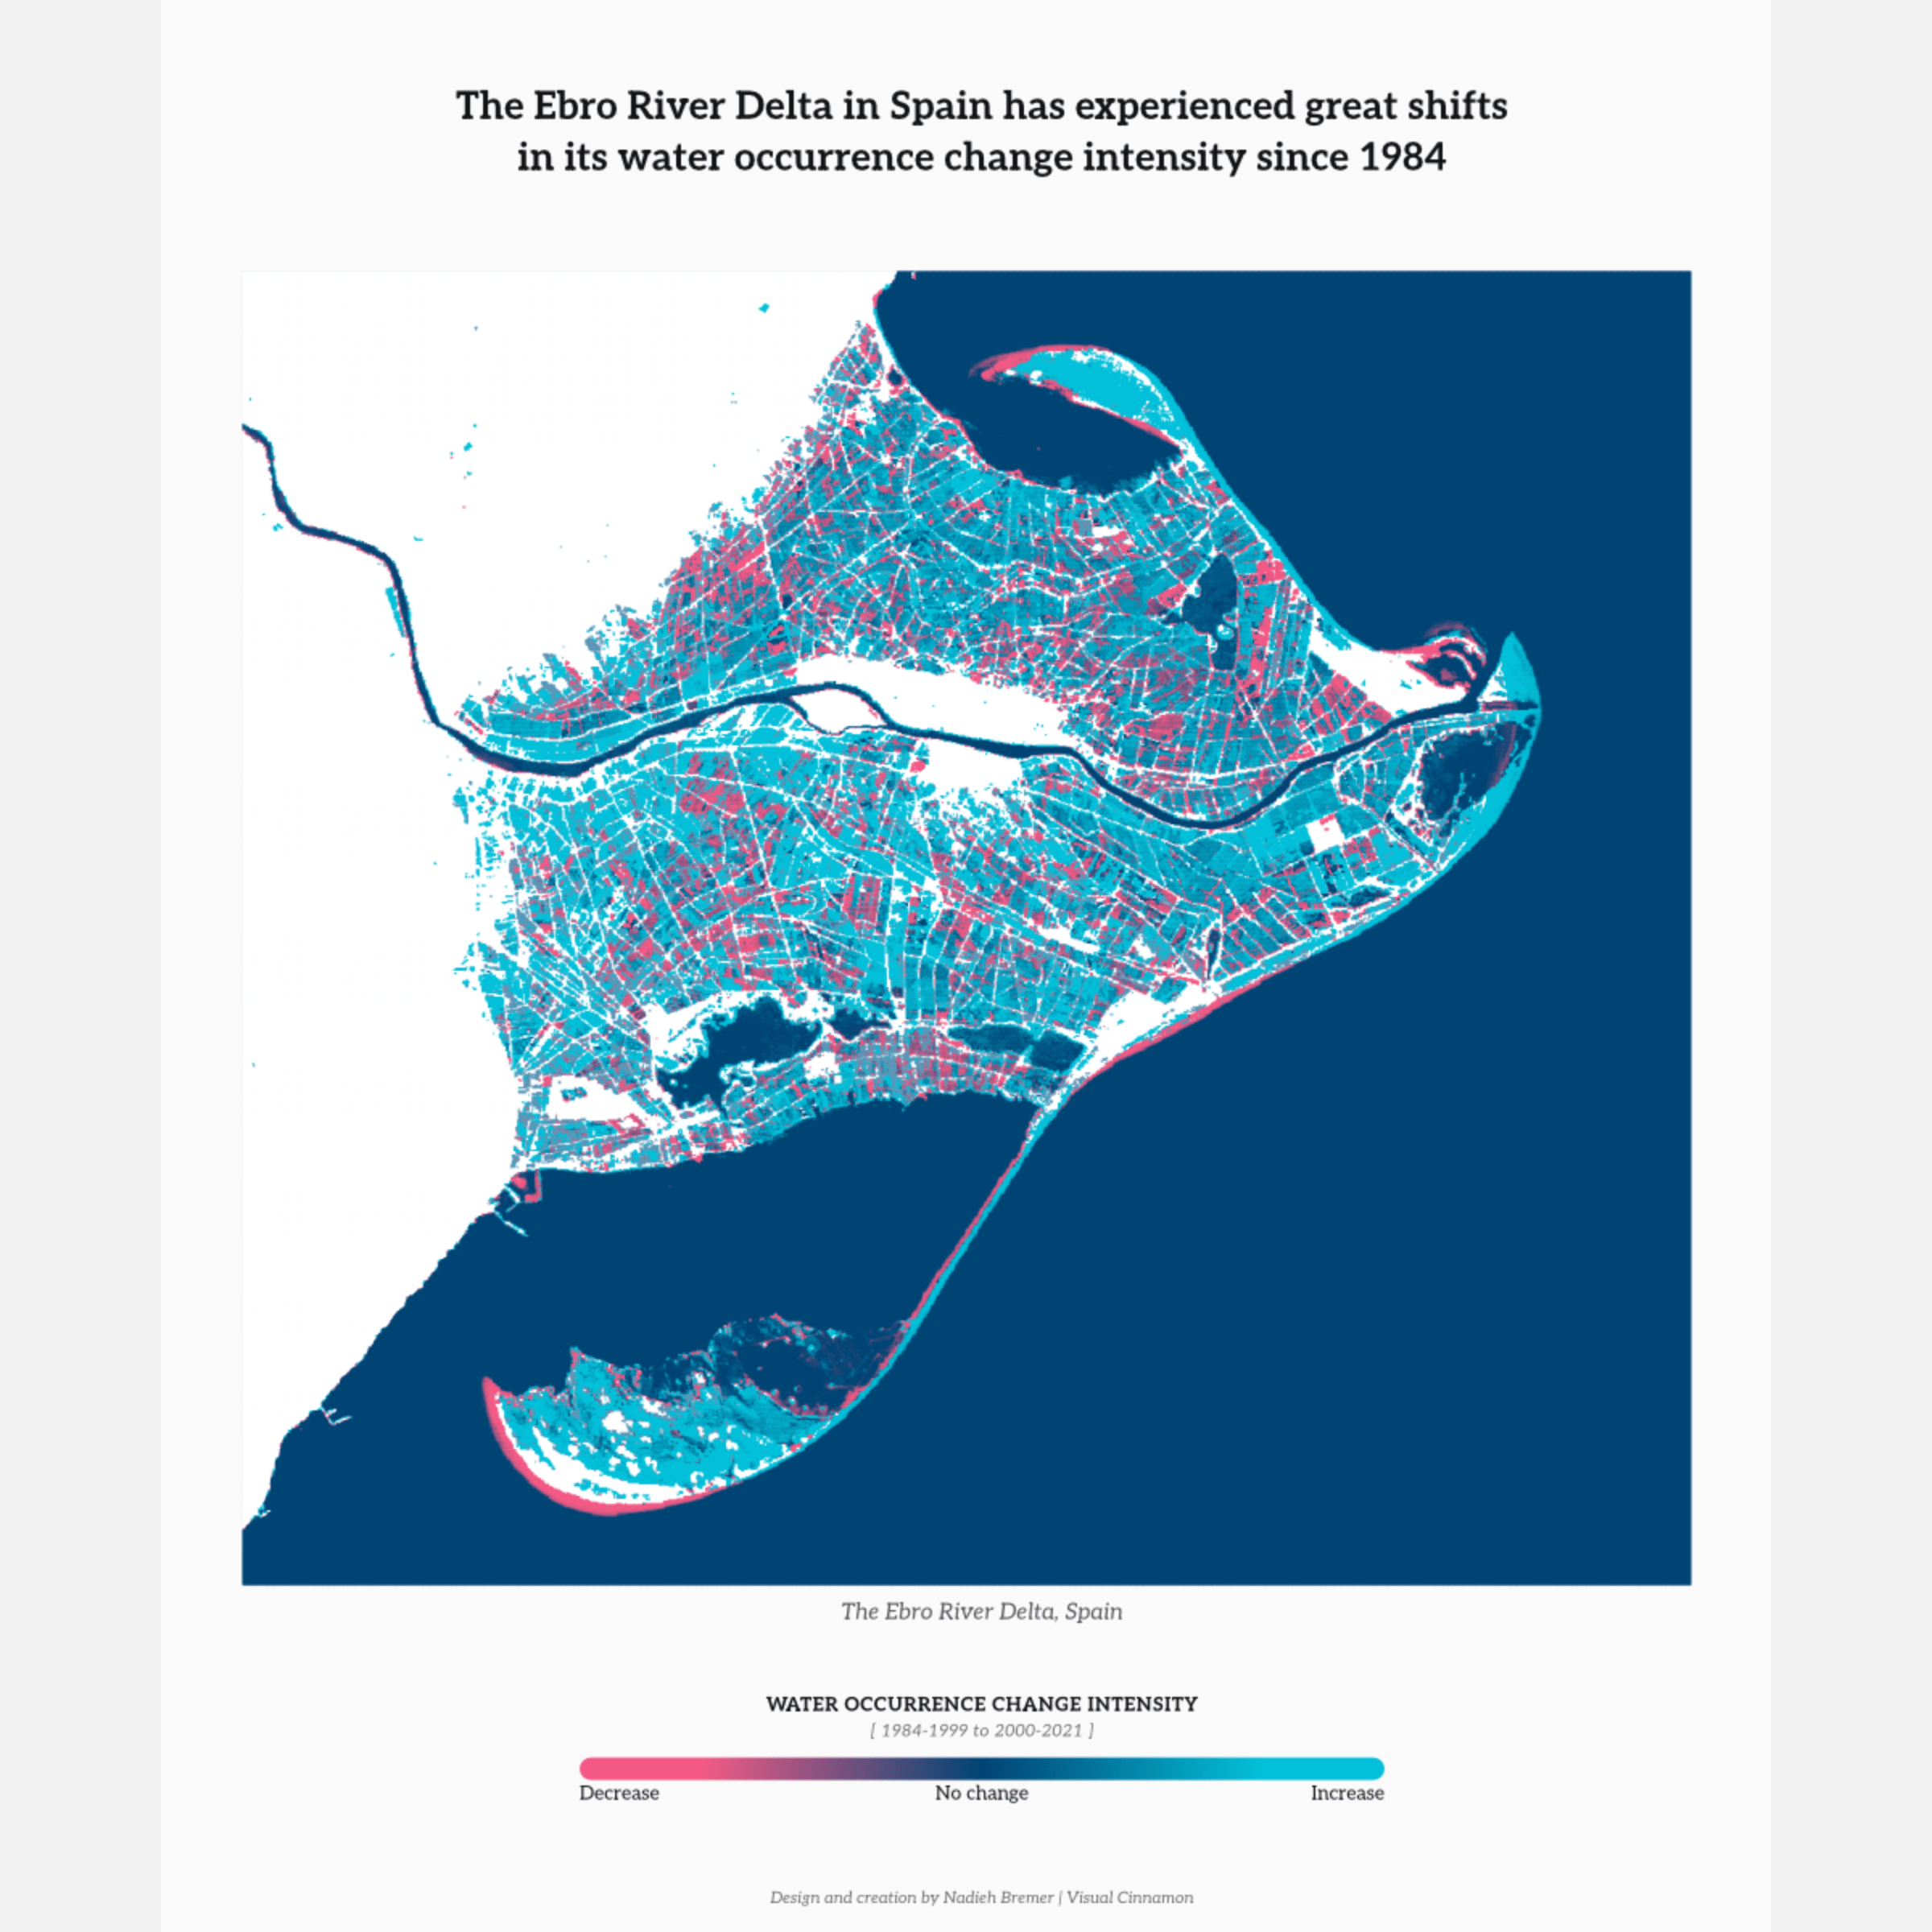
The Publications Office of the European Union asked me to create the data visualizations to accompany three of their monthly Data Stories, creating three relatively straightforward visuals per story. Each story focuses on a different topic relevant to the EU, and the visualizations are designed to be both informative and engaging, helping to communicate key insights from the data. During 2025 I created three stories: the first story focused on the future, looking at the “2025–2027 Horizon Europe strategic plan,” the second had a whimsical air as it explored leisure time across the EU, and the third took a deep dive into health and well-being statistics. For the first half of 2026, I created two more stories: about travel patterns in the EU and one about the adoption of AI.
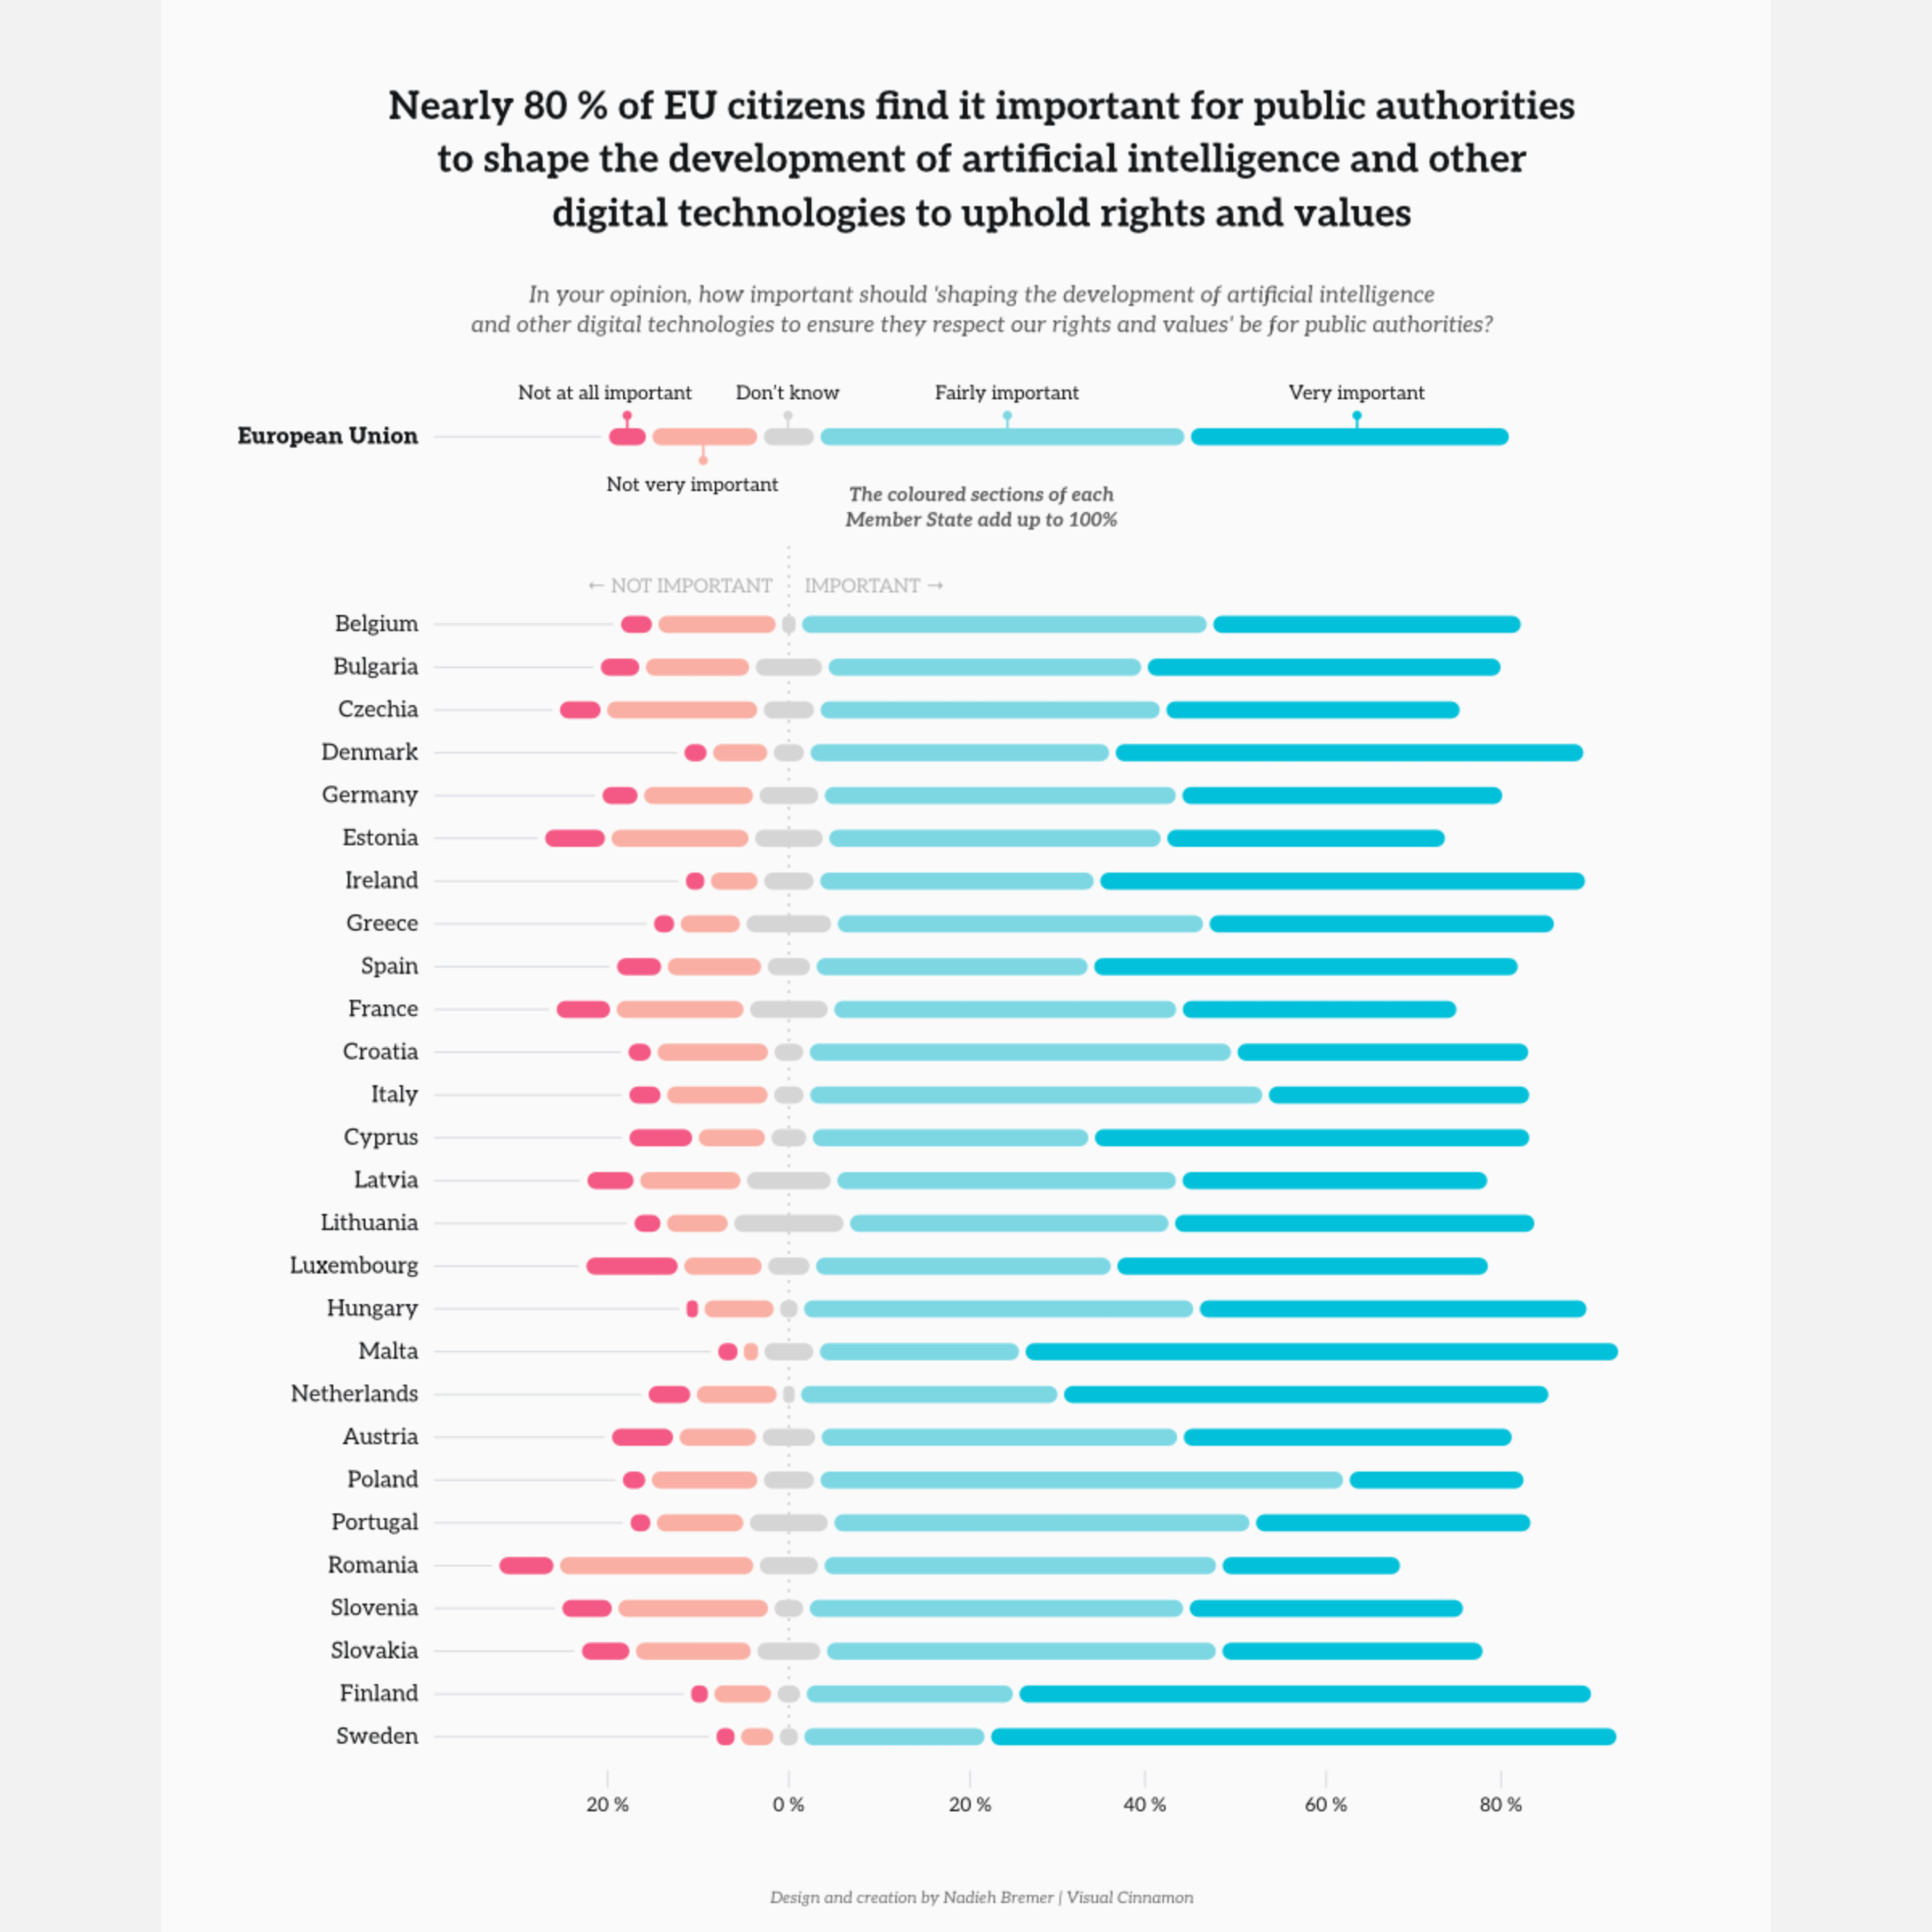
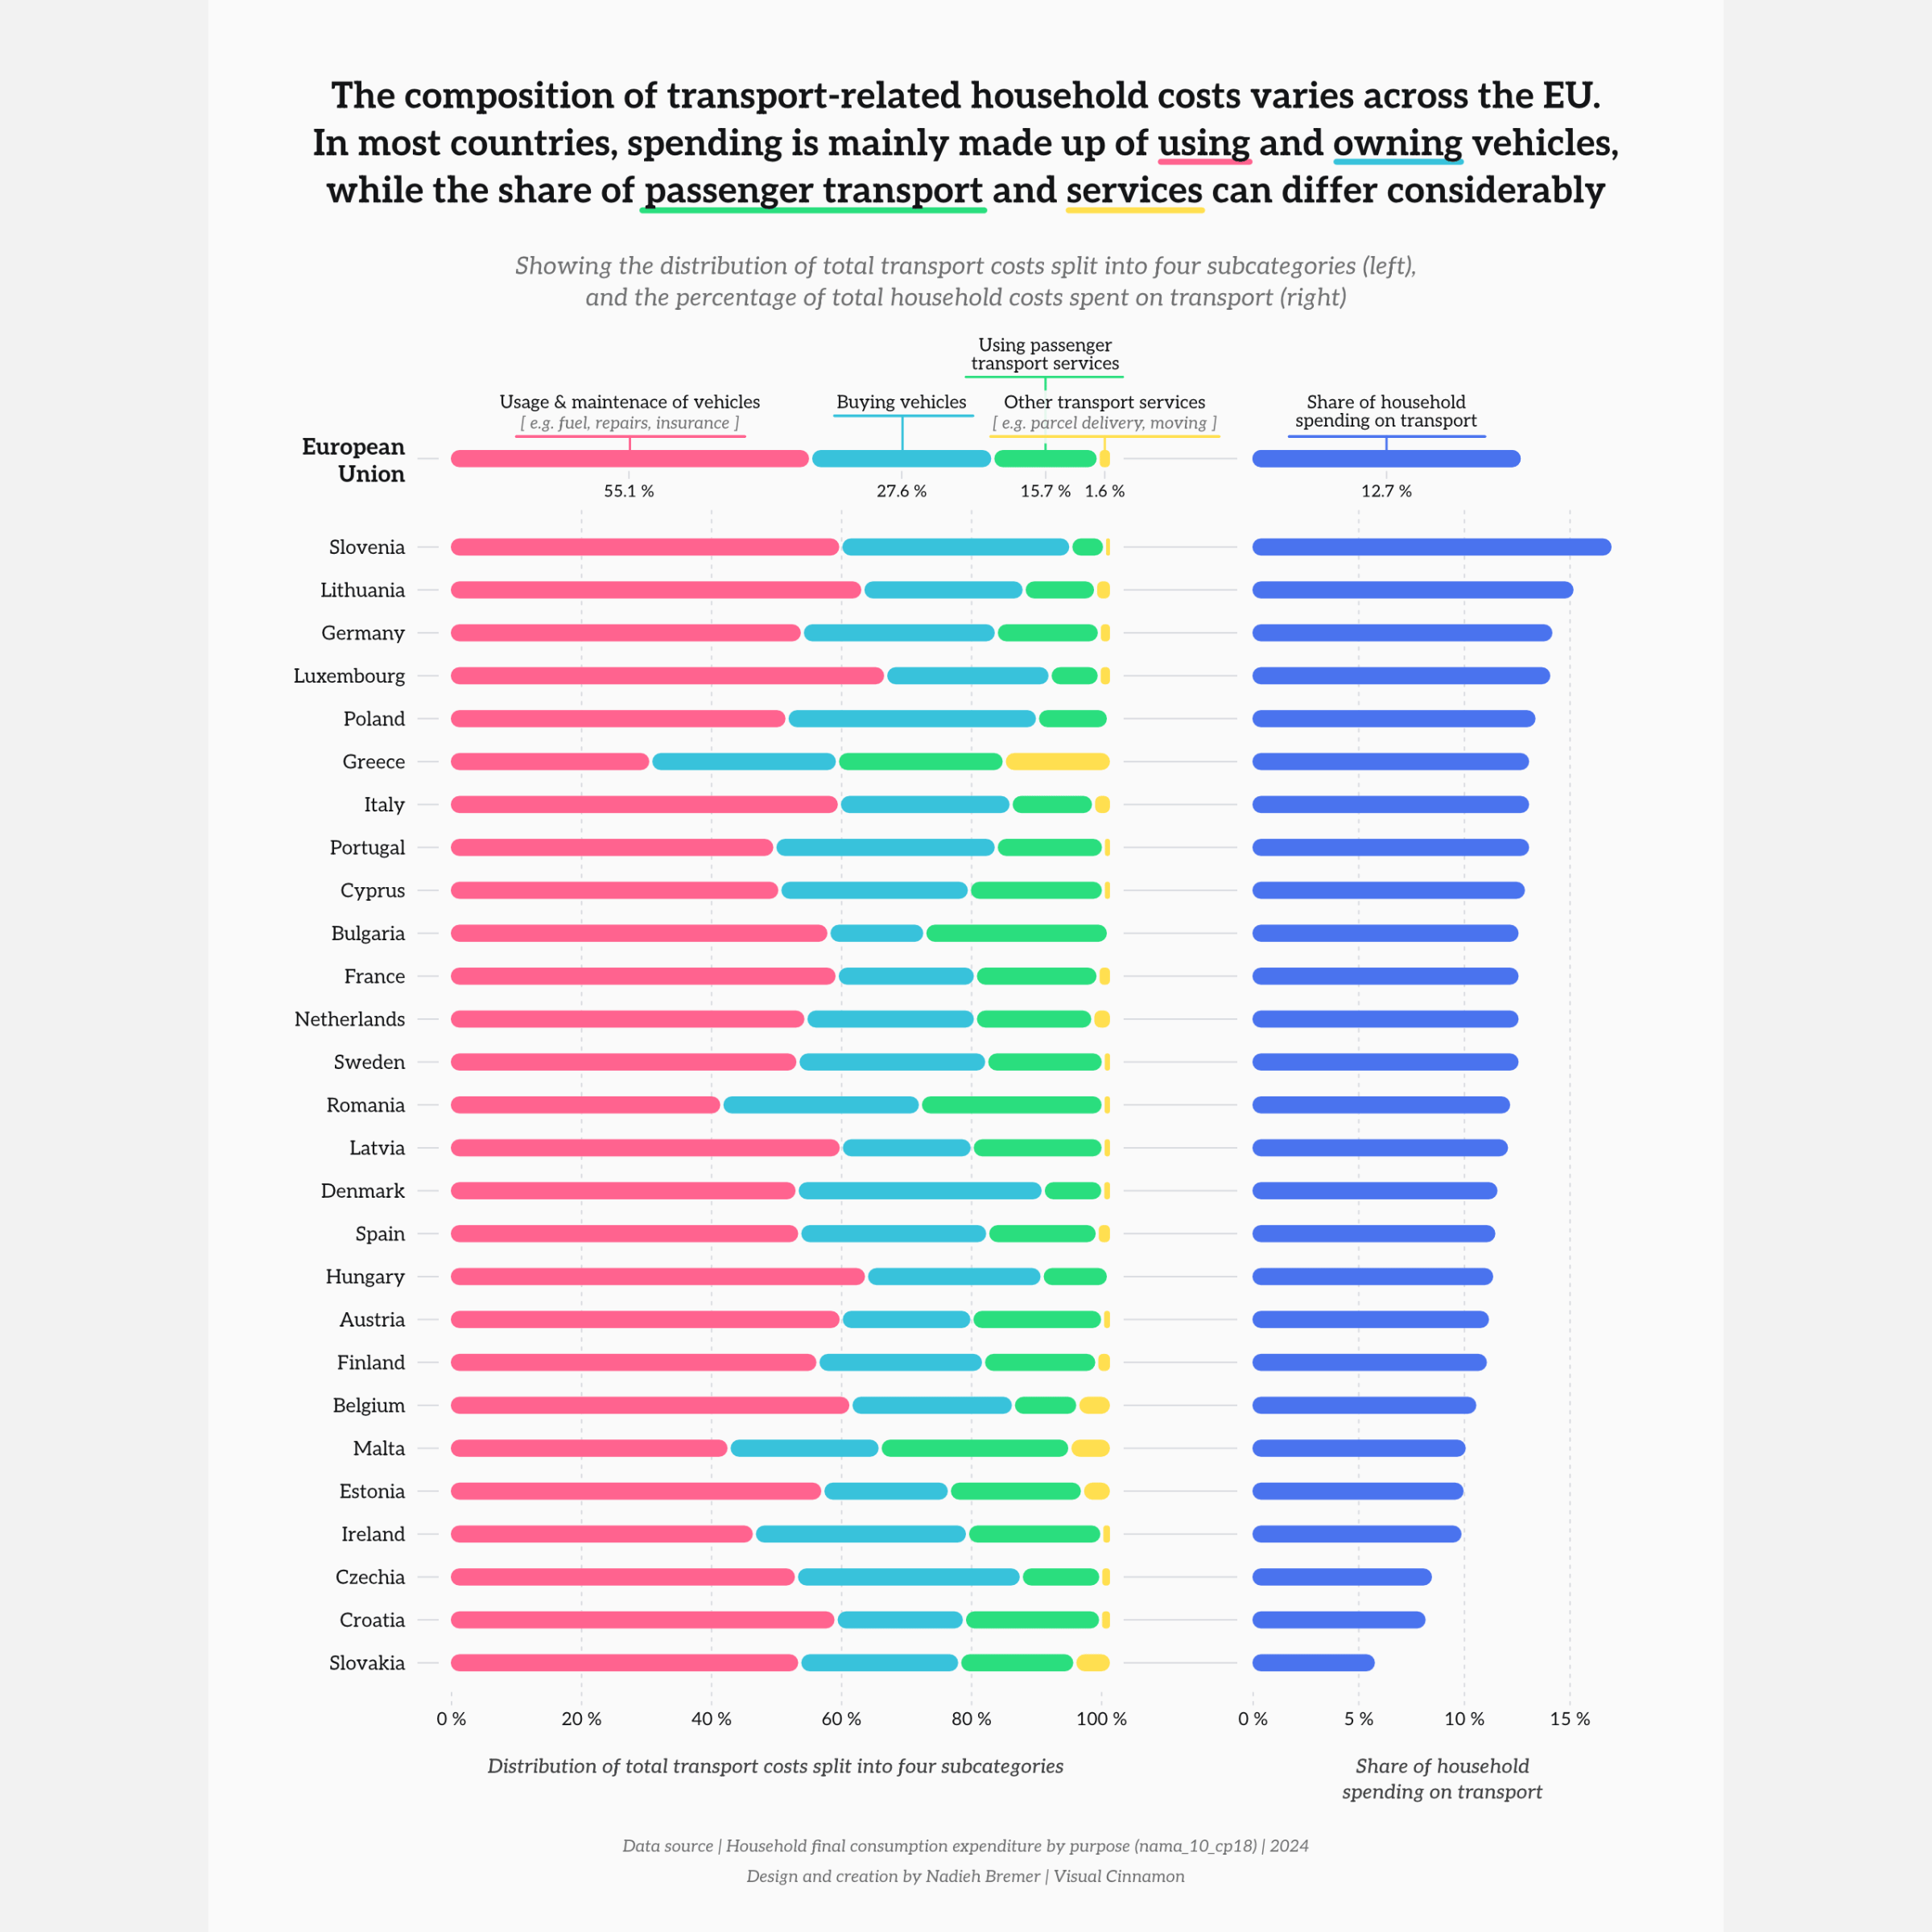
Each Data Story consists of three sections, three deep dives, for which I created one static visualization per section. Although the EU Publications Office asks several data visualization experts to contribute to their Data Stories, all of which can use their own style, colors and fonts, I created a cohesive style guide for the first Data Story that I then also applied to the other two stories. This way, all three stories have a consistent look and feel, even though they cover different topics.
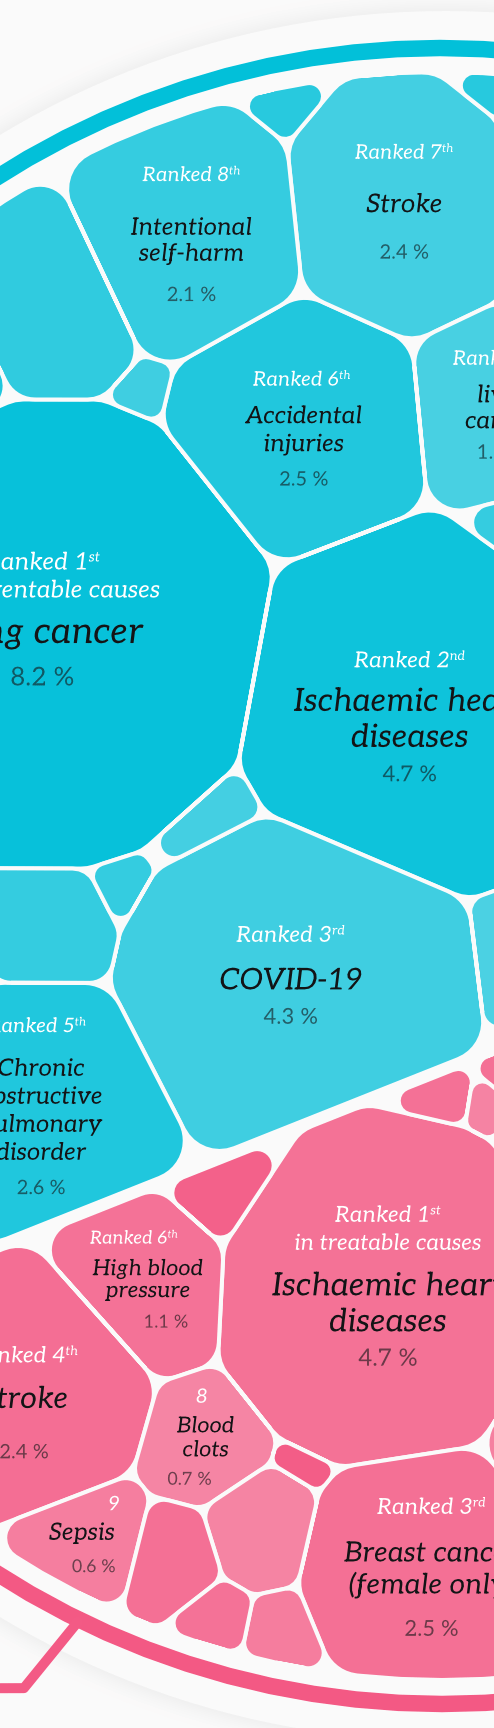
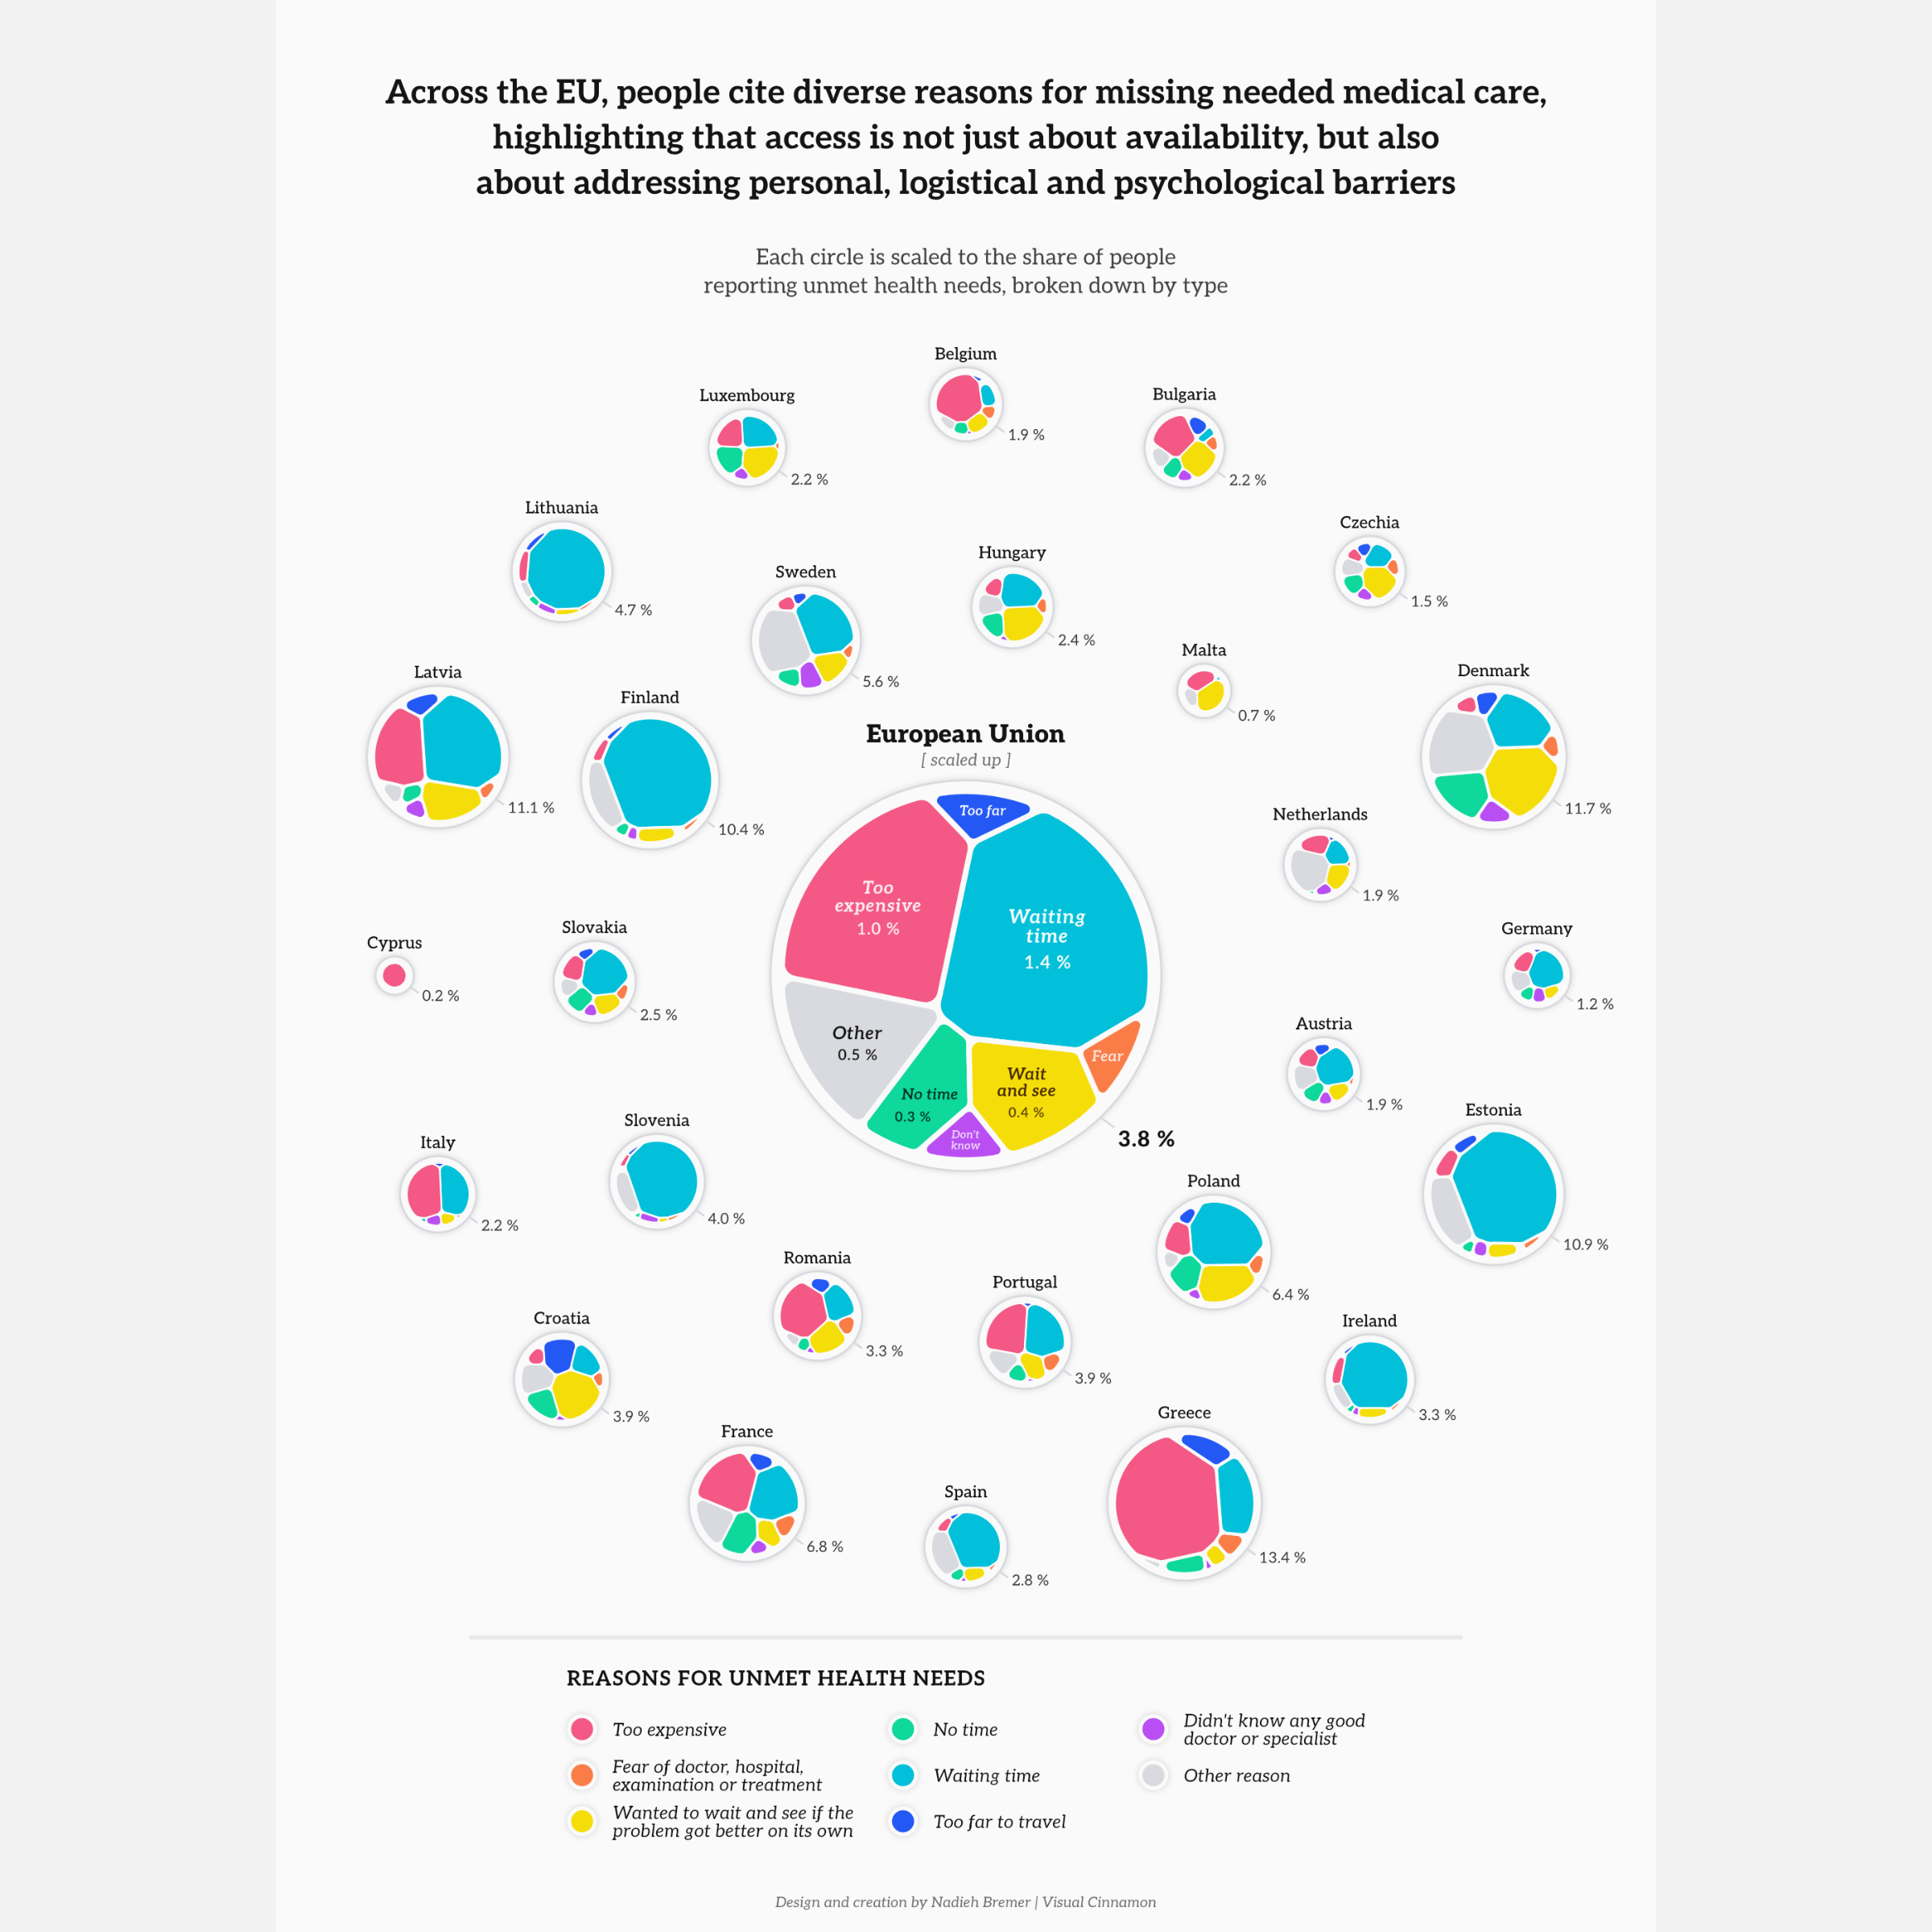
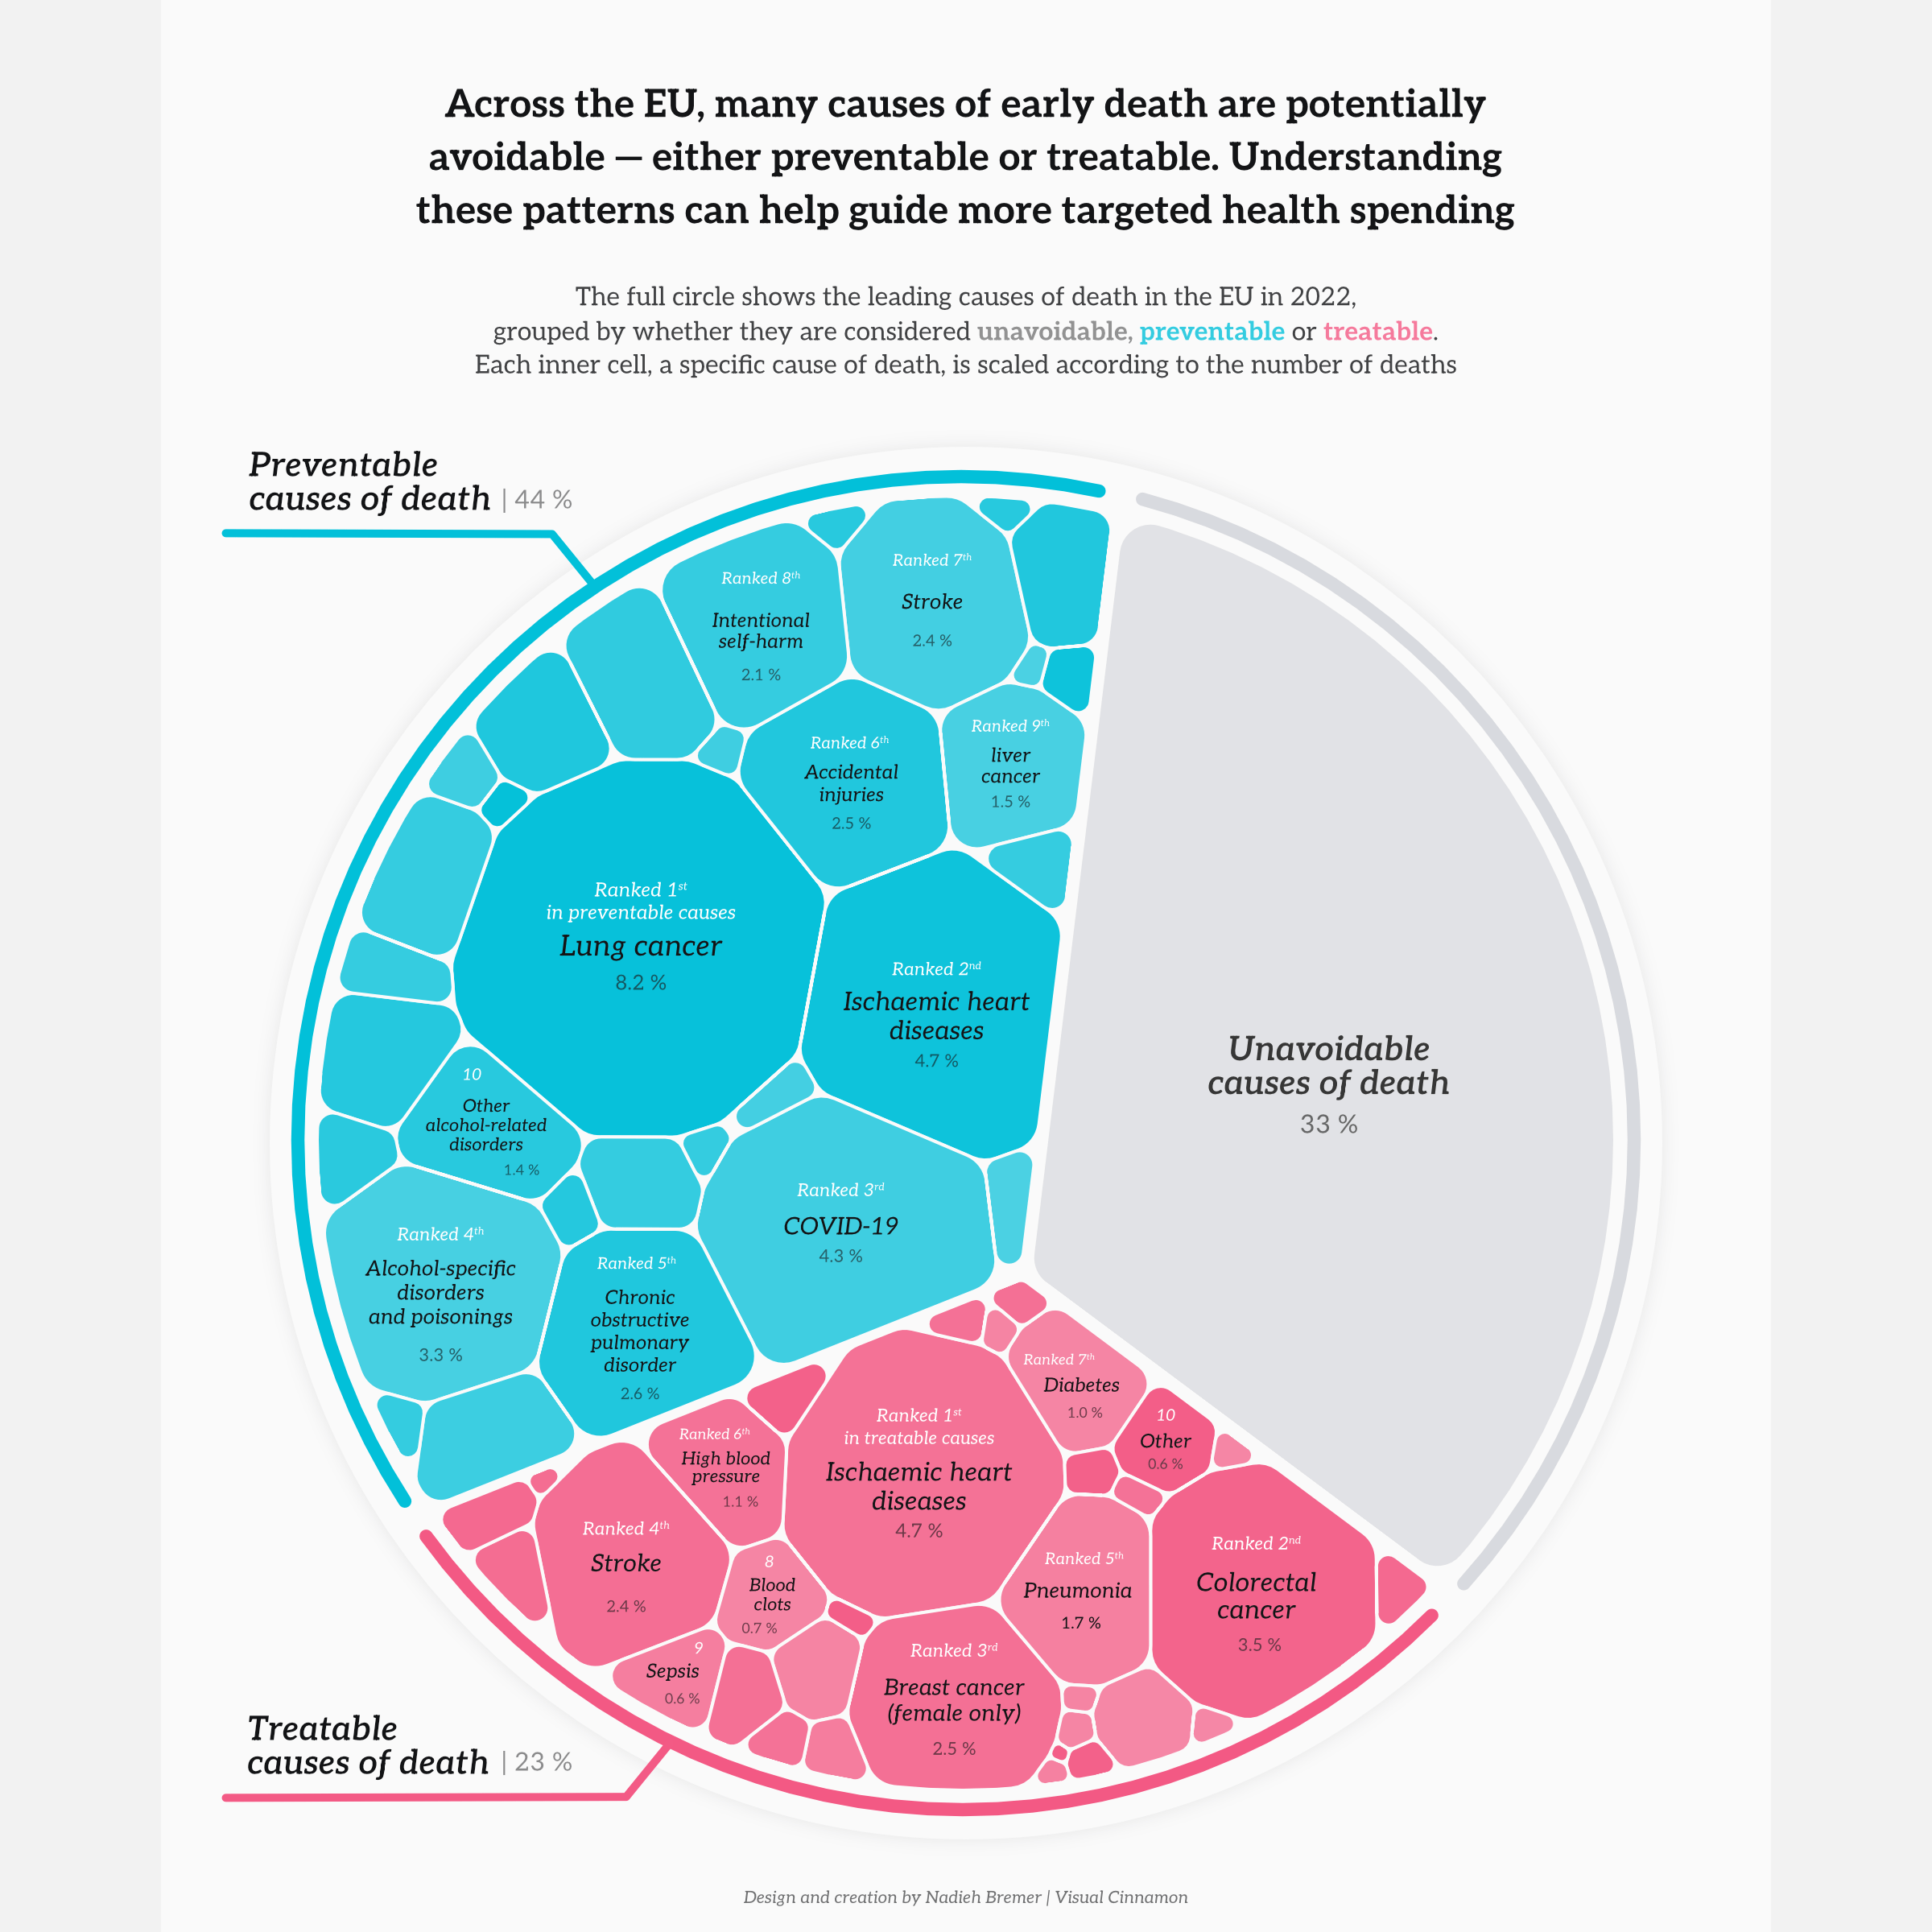
As the budget was more limited, the client didn’t mind if I used the more straightforward charts, such as line charts or bar charts. However, I wanted to make sure that the visualizations were not only informative but also visually appealing and engaging. Therefore, I strove to still incorporate more creative elements into some of the designs, such as more unique chart types that would also work better to convey the information (like the various voronoi treemaps of the third Data Story in 2025). This approach helped to make the visualizations stand out and capture the attention of the audience.
For 2025 I created three Data Stories:
- The first Data Story is titled “A Promising Horizon: How the 2025–2027 Horizon Europe strategic plan will shape Europe’s tomorrow” and uses open data to explore Horizon Europe’s planned investment in the circular economy, space and artificial intelligence. You can read it here.
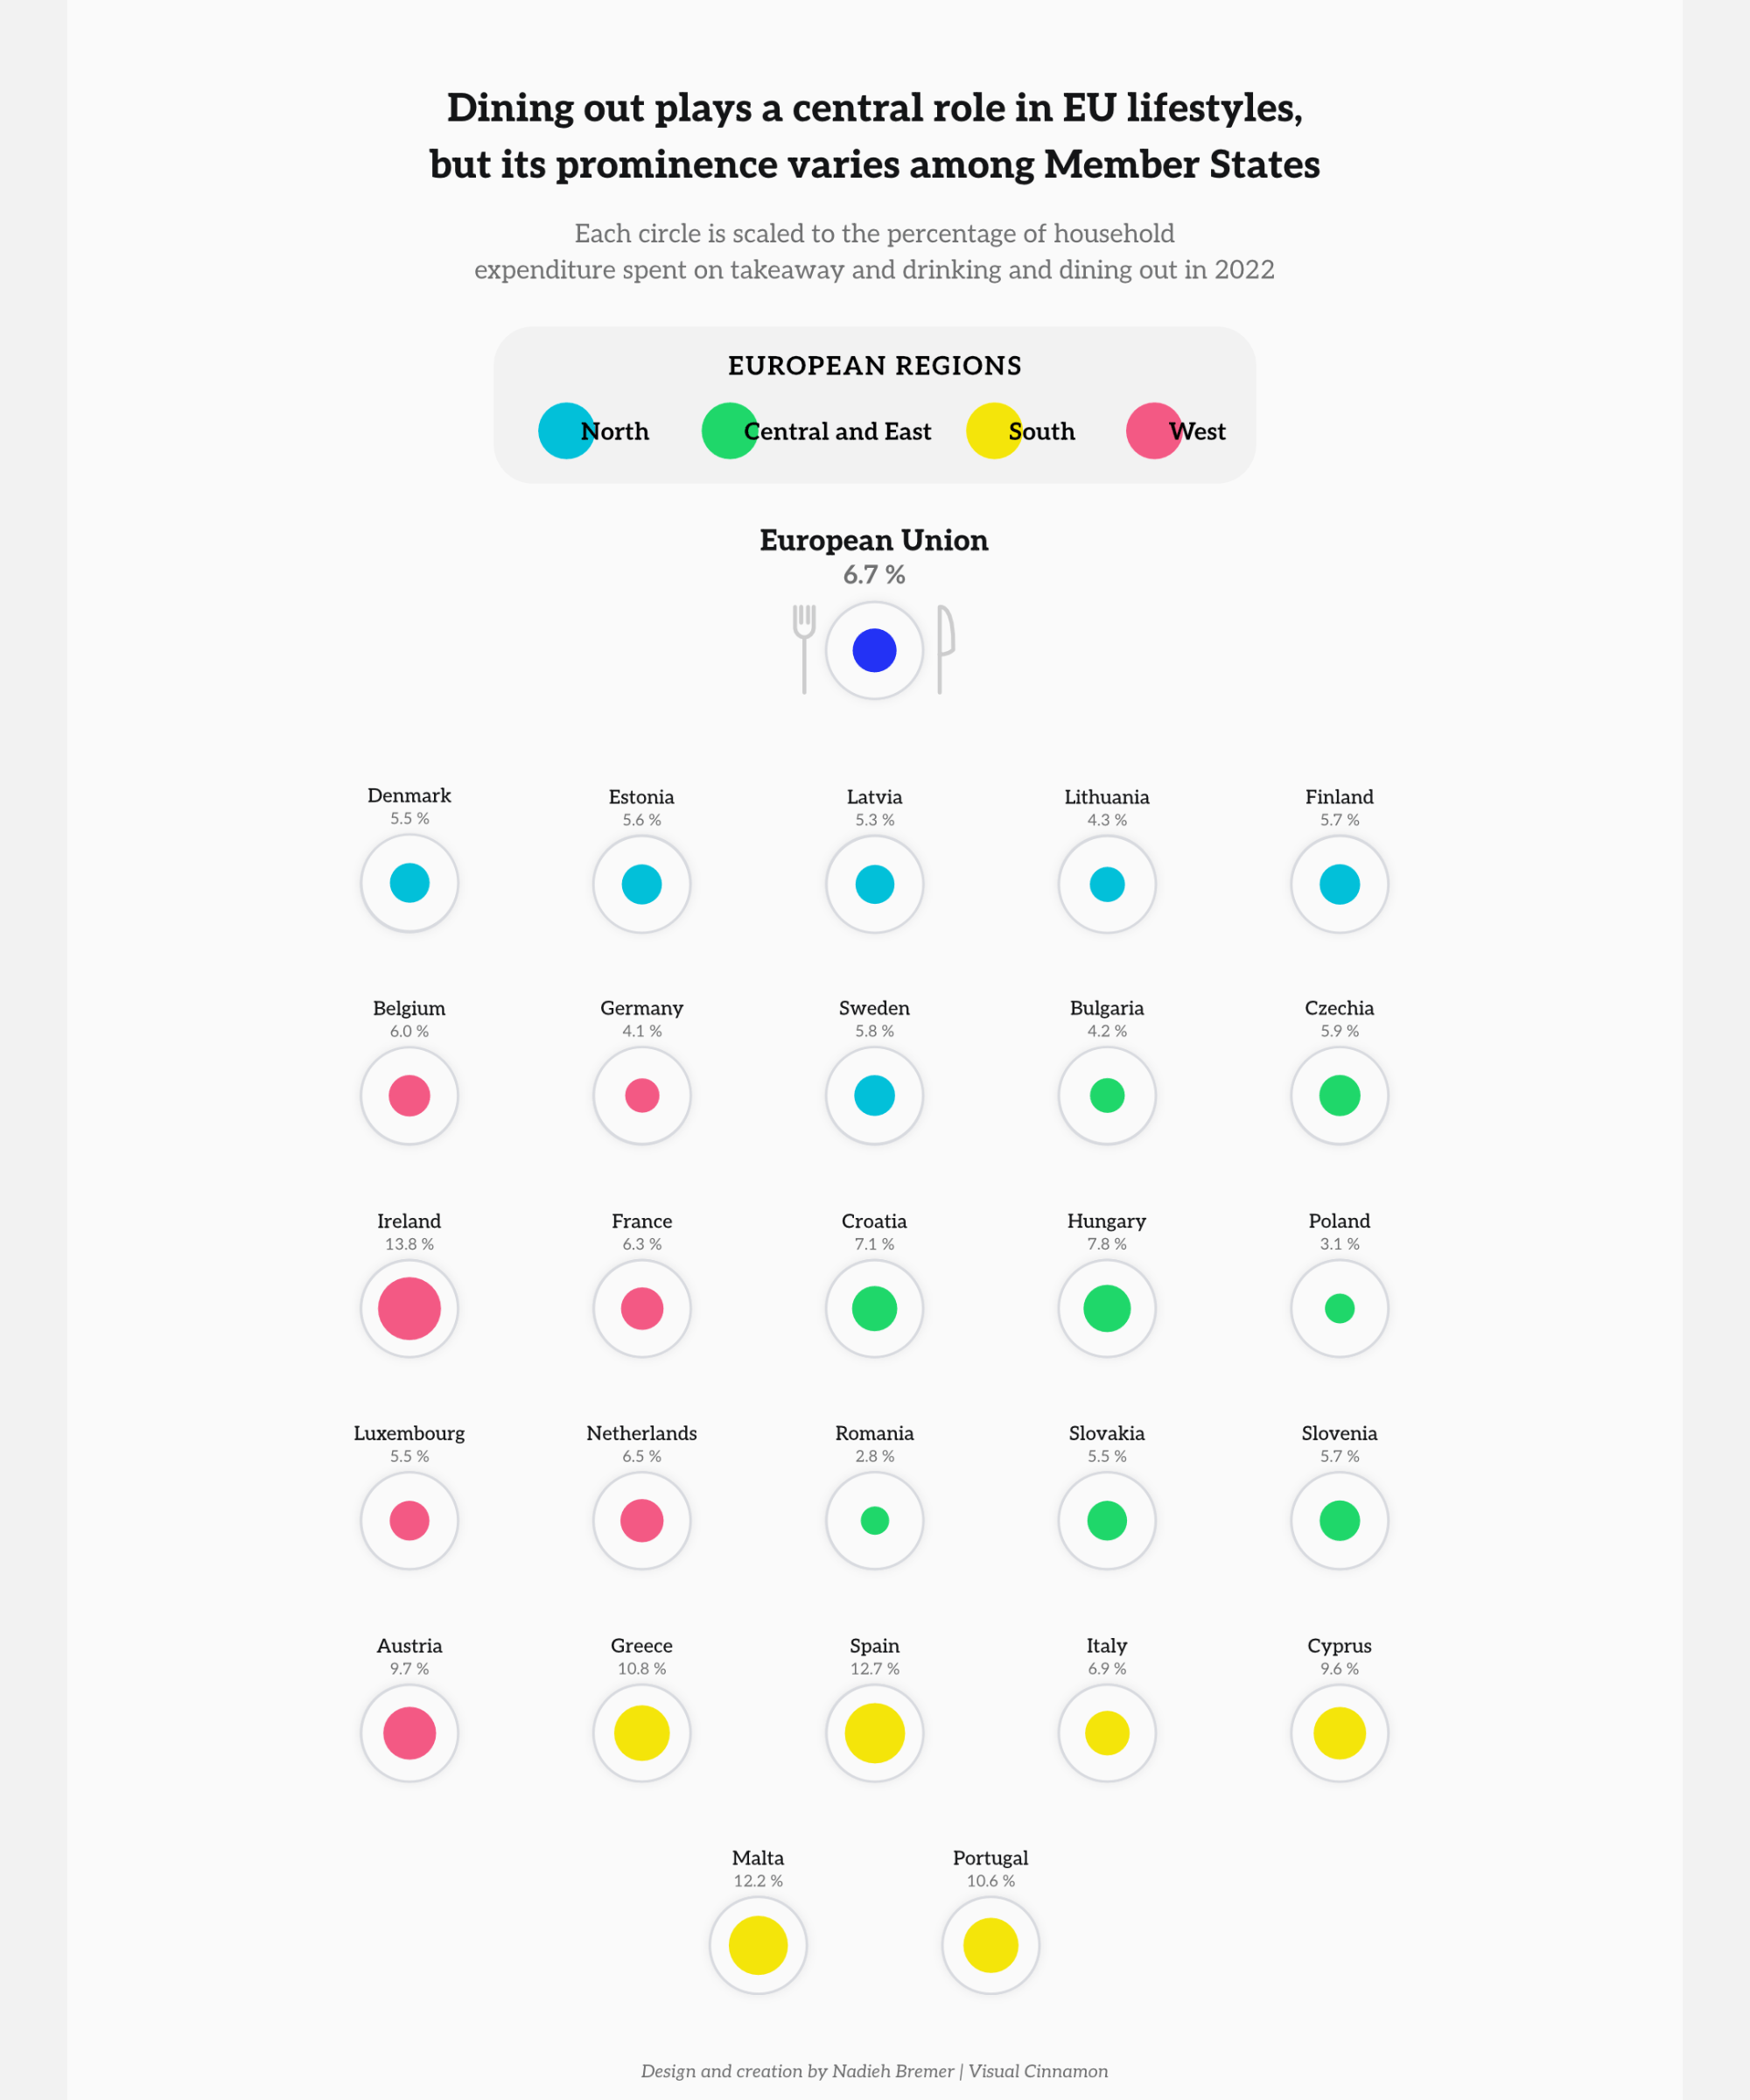
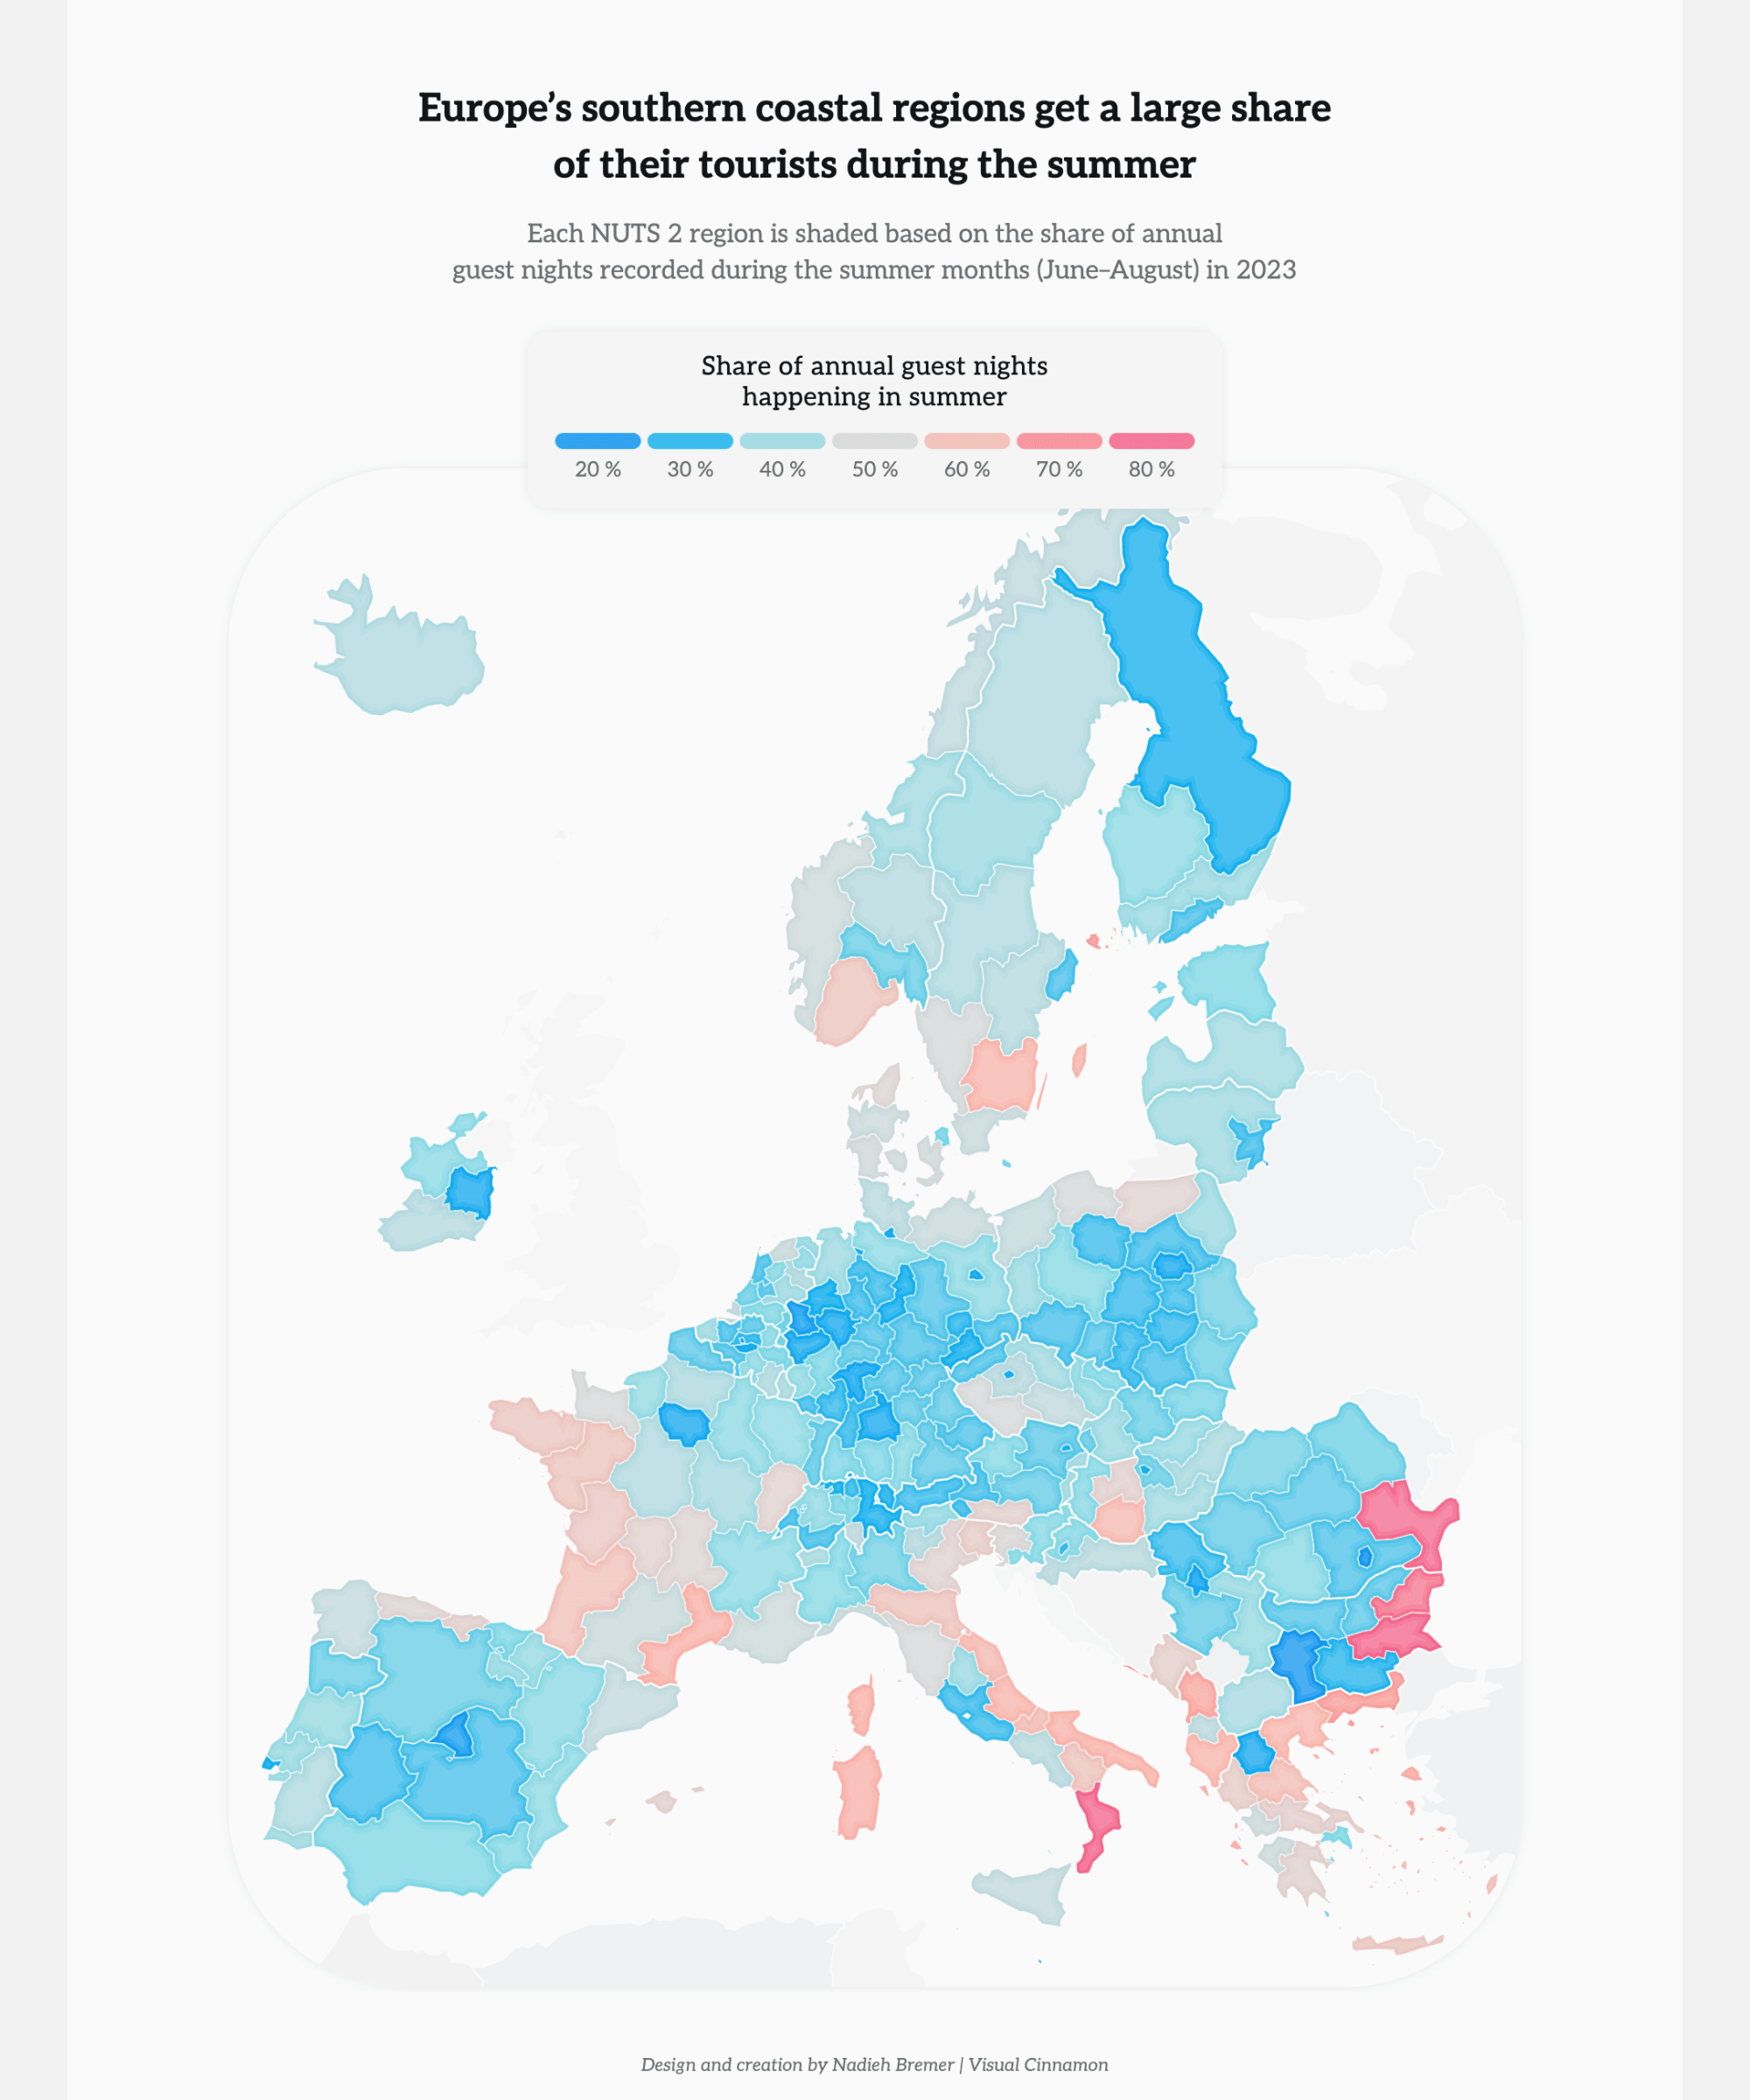
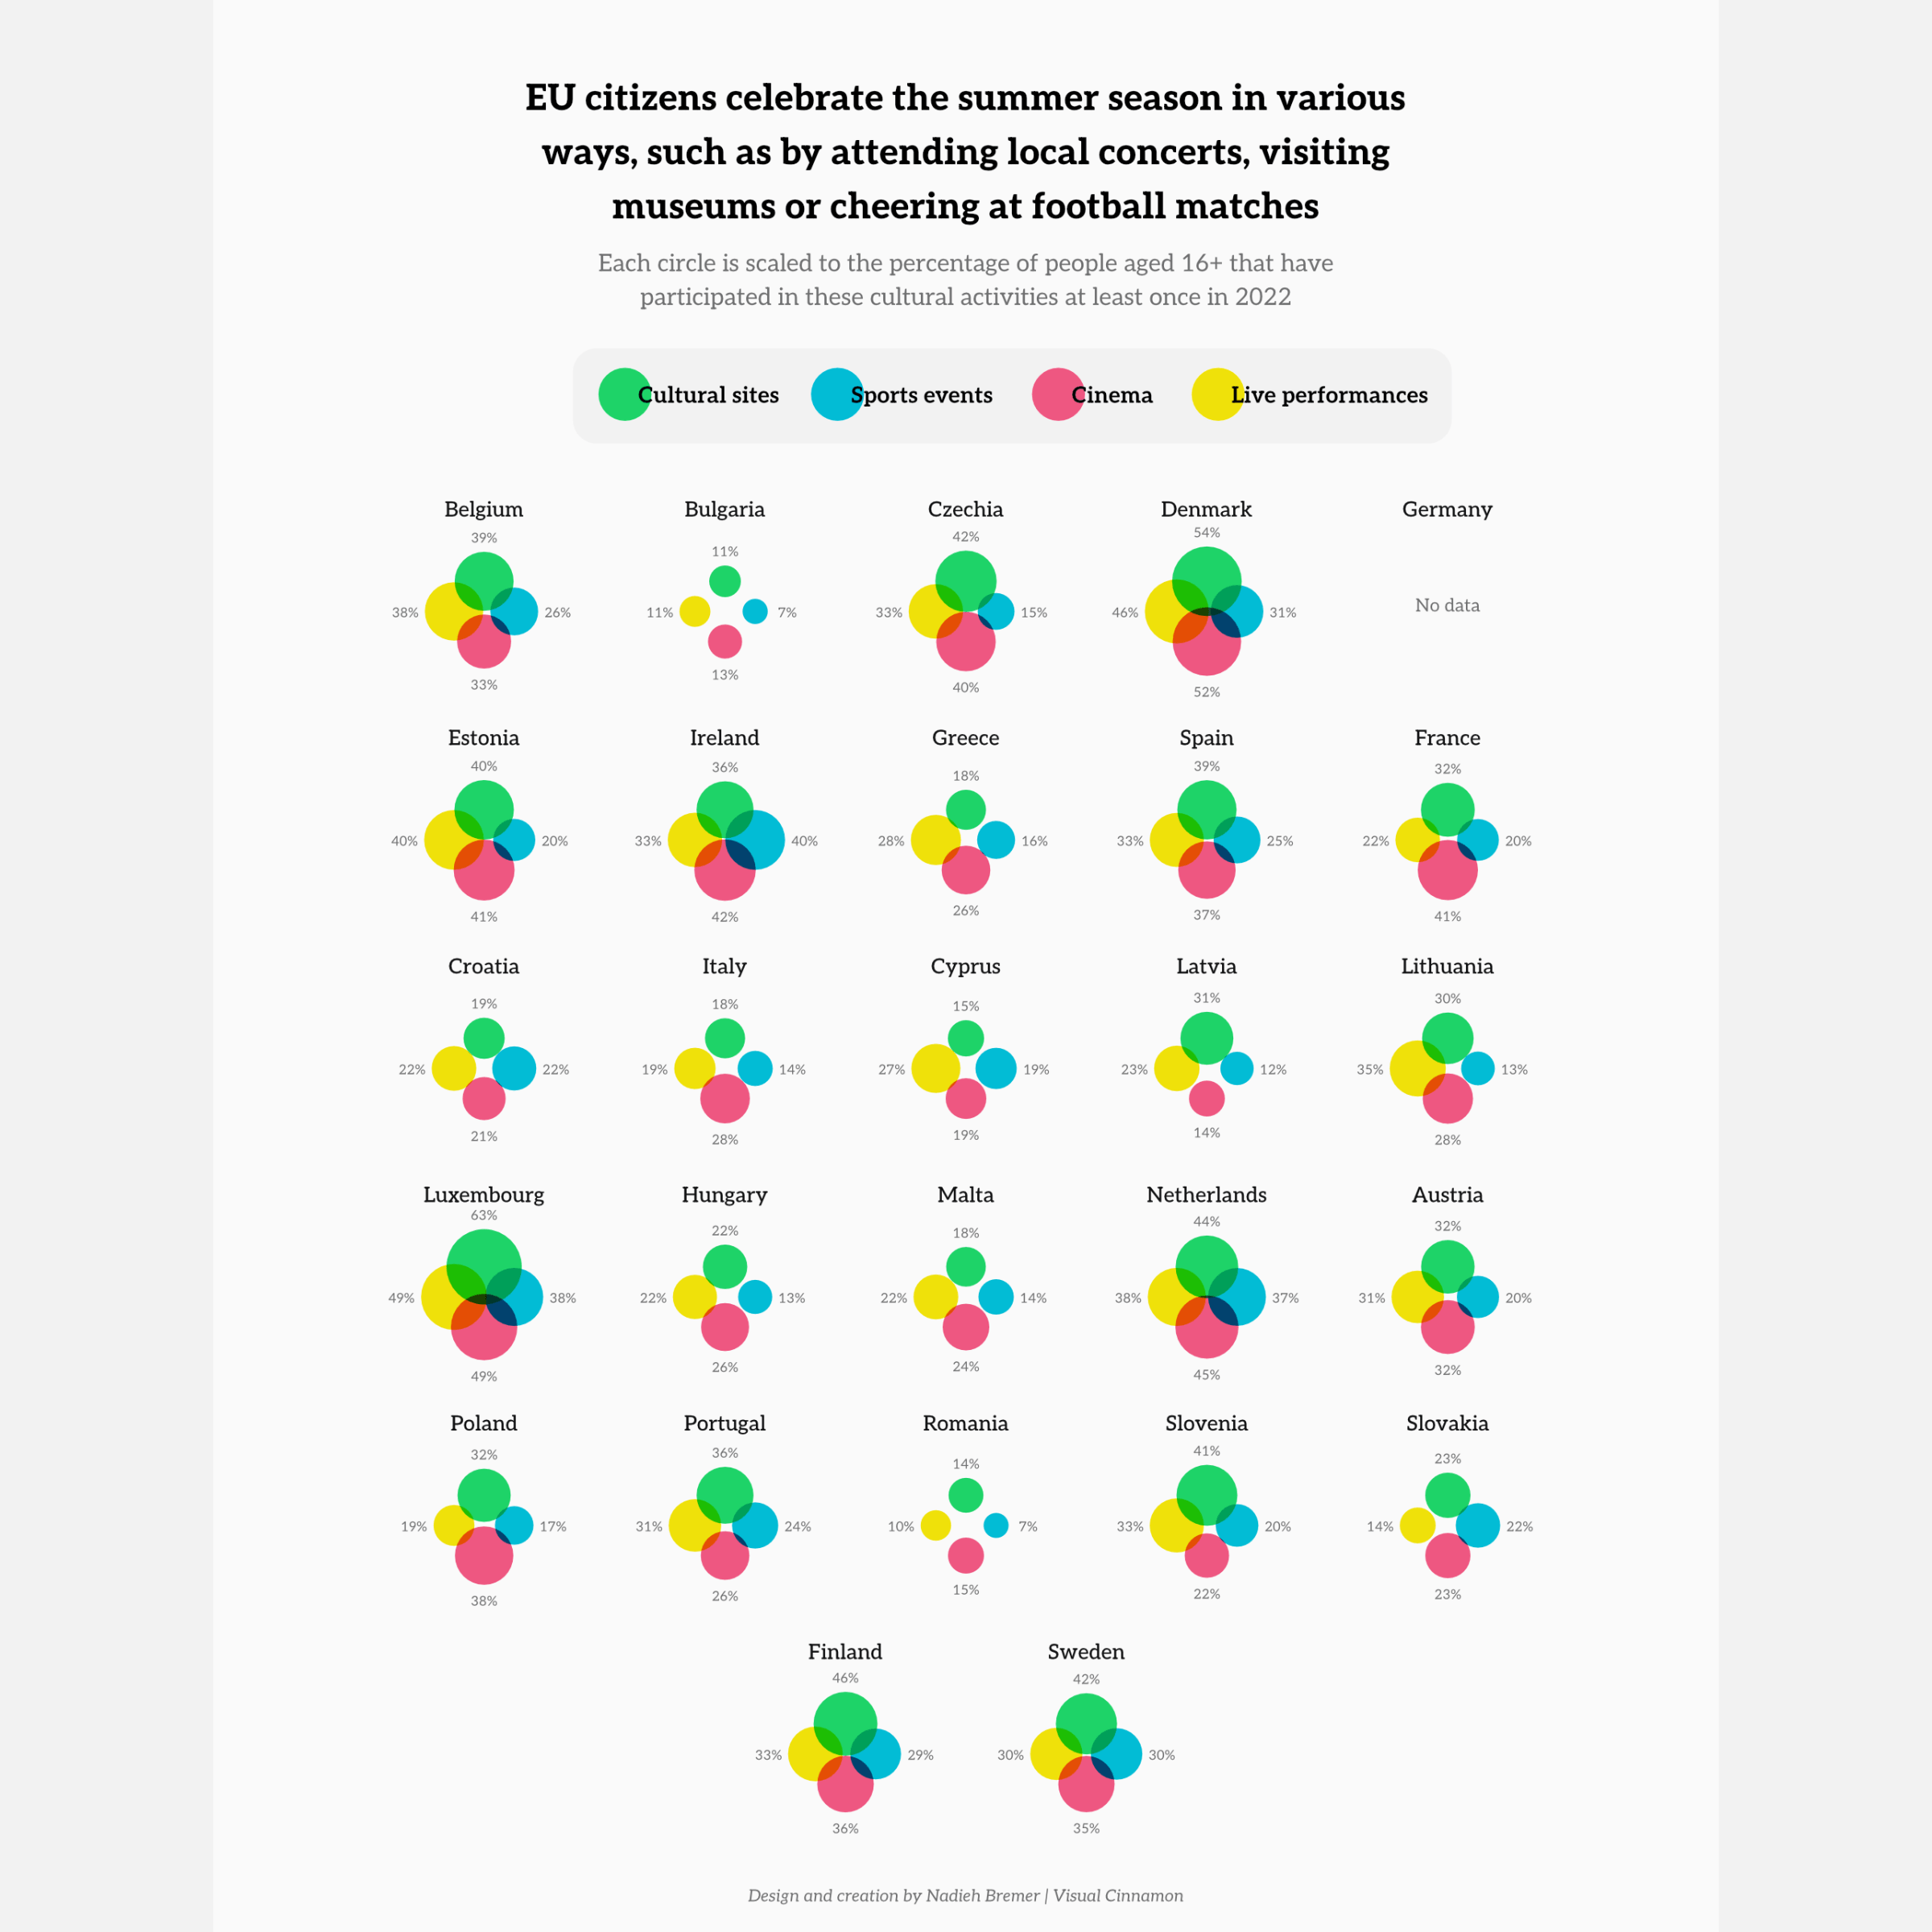
- The second Data Story is titled “Leisure in Europe: Insights from open data” where open data reveals patterns of dining out, cultural participation and seasonal travel in Europe. You can read it here.
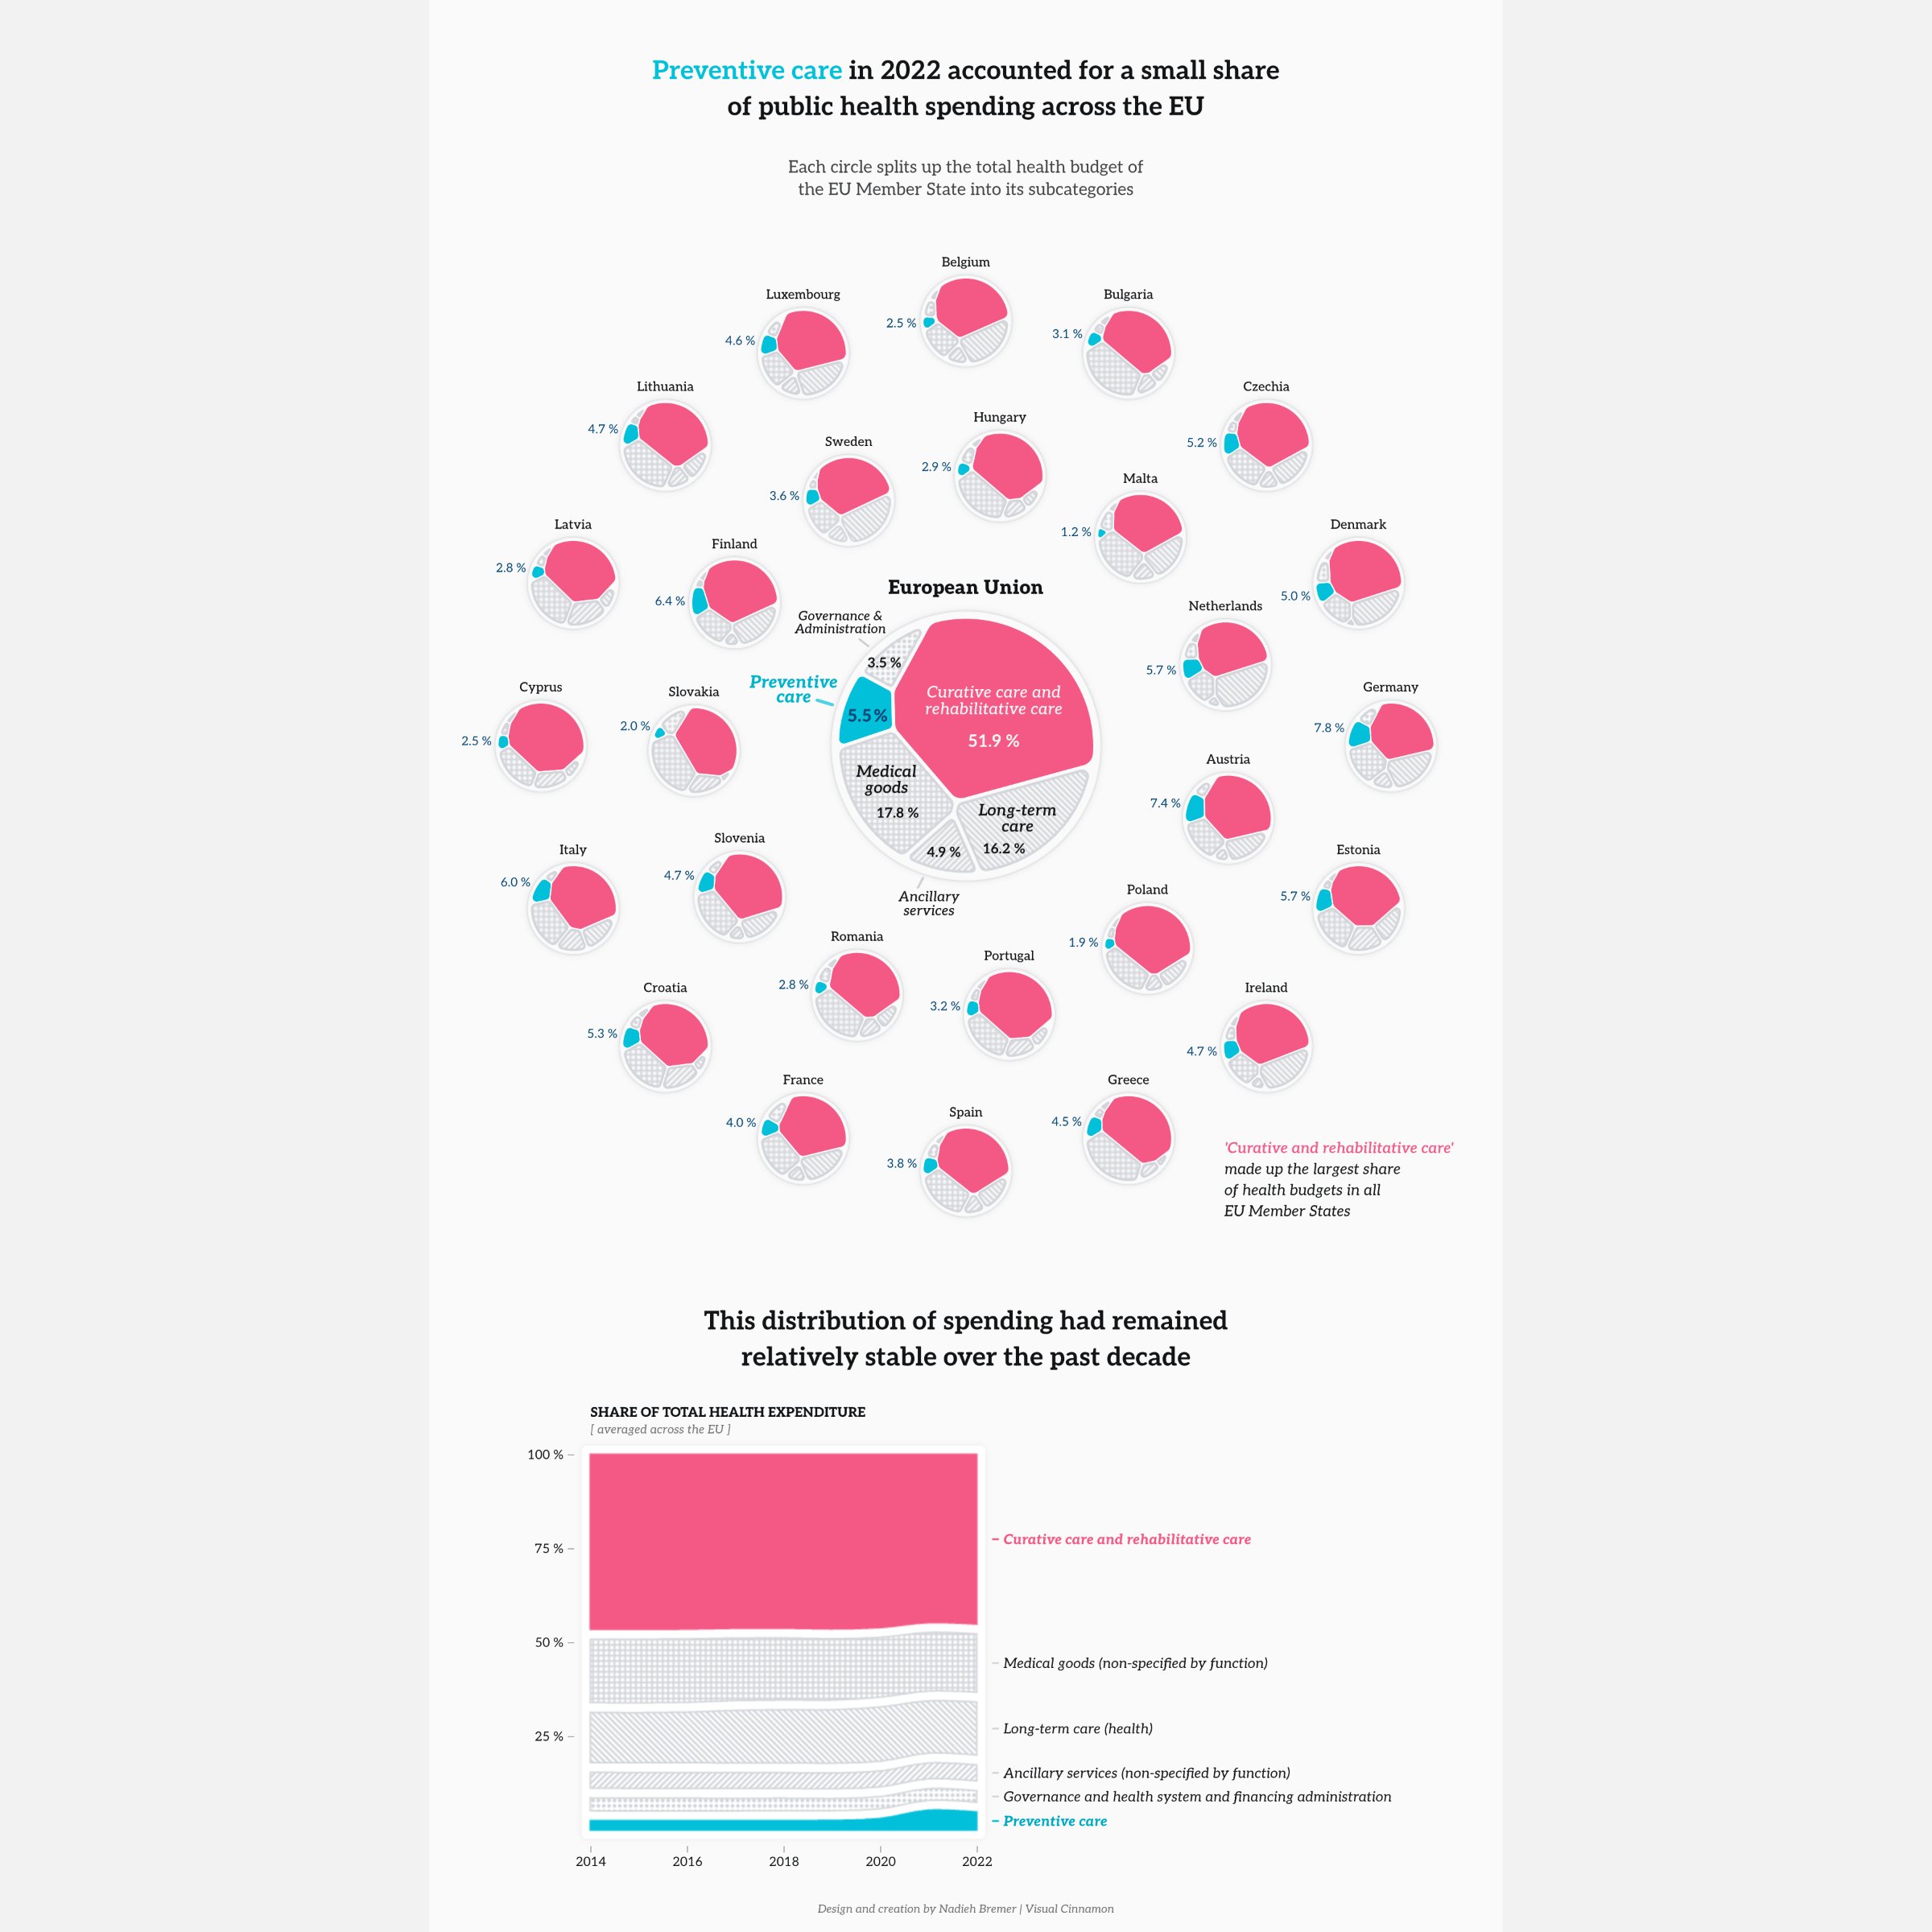
- And the third Data Story is titled “Health and well-being in the EU: Investing where it matters” and is a data-driven look at prevention spending, disease burden and access to care across the EU. You can read it here.
For the first half of 2026, I created two more Data Stories:
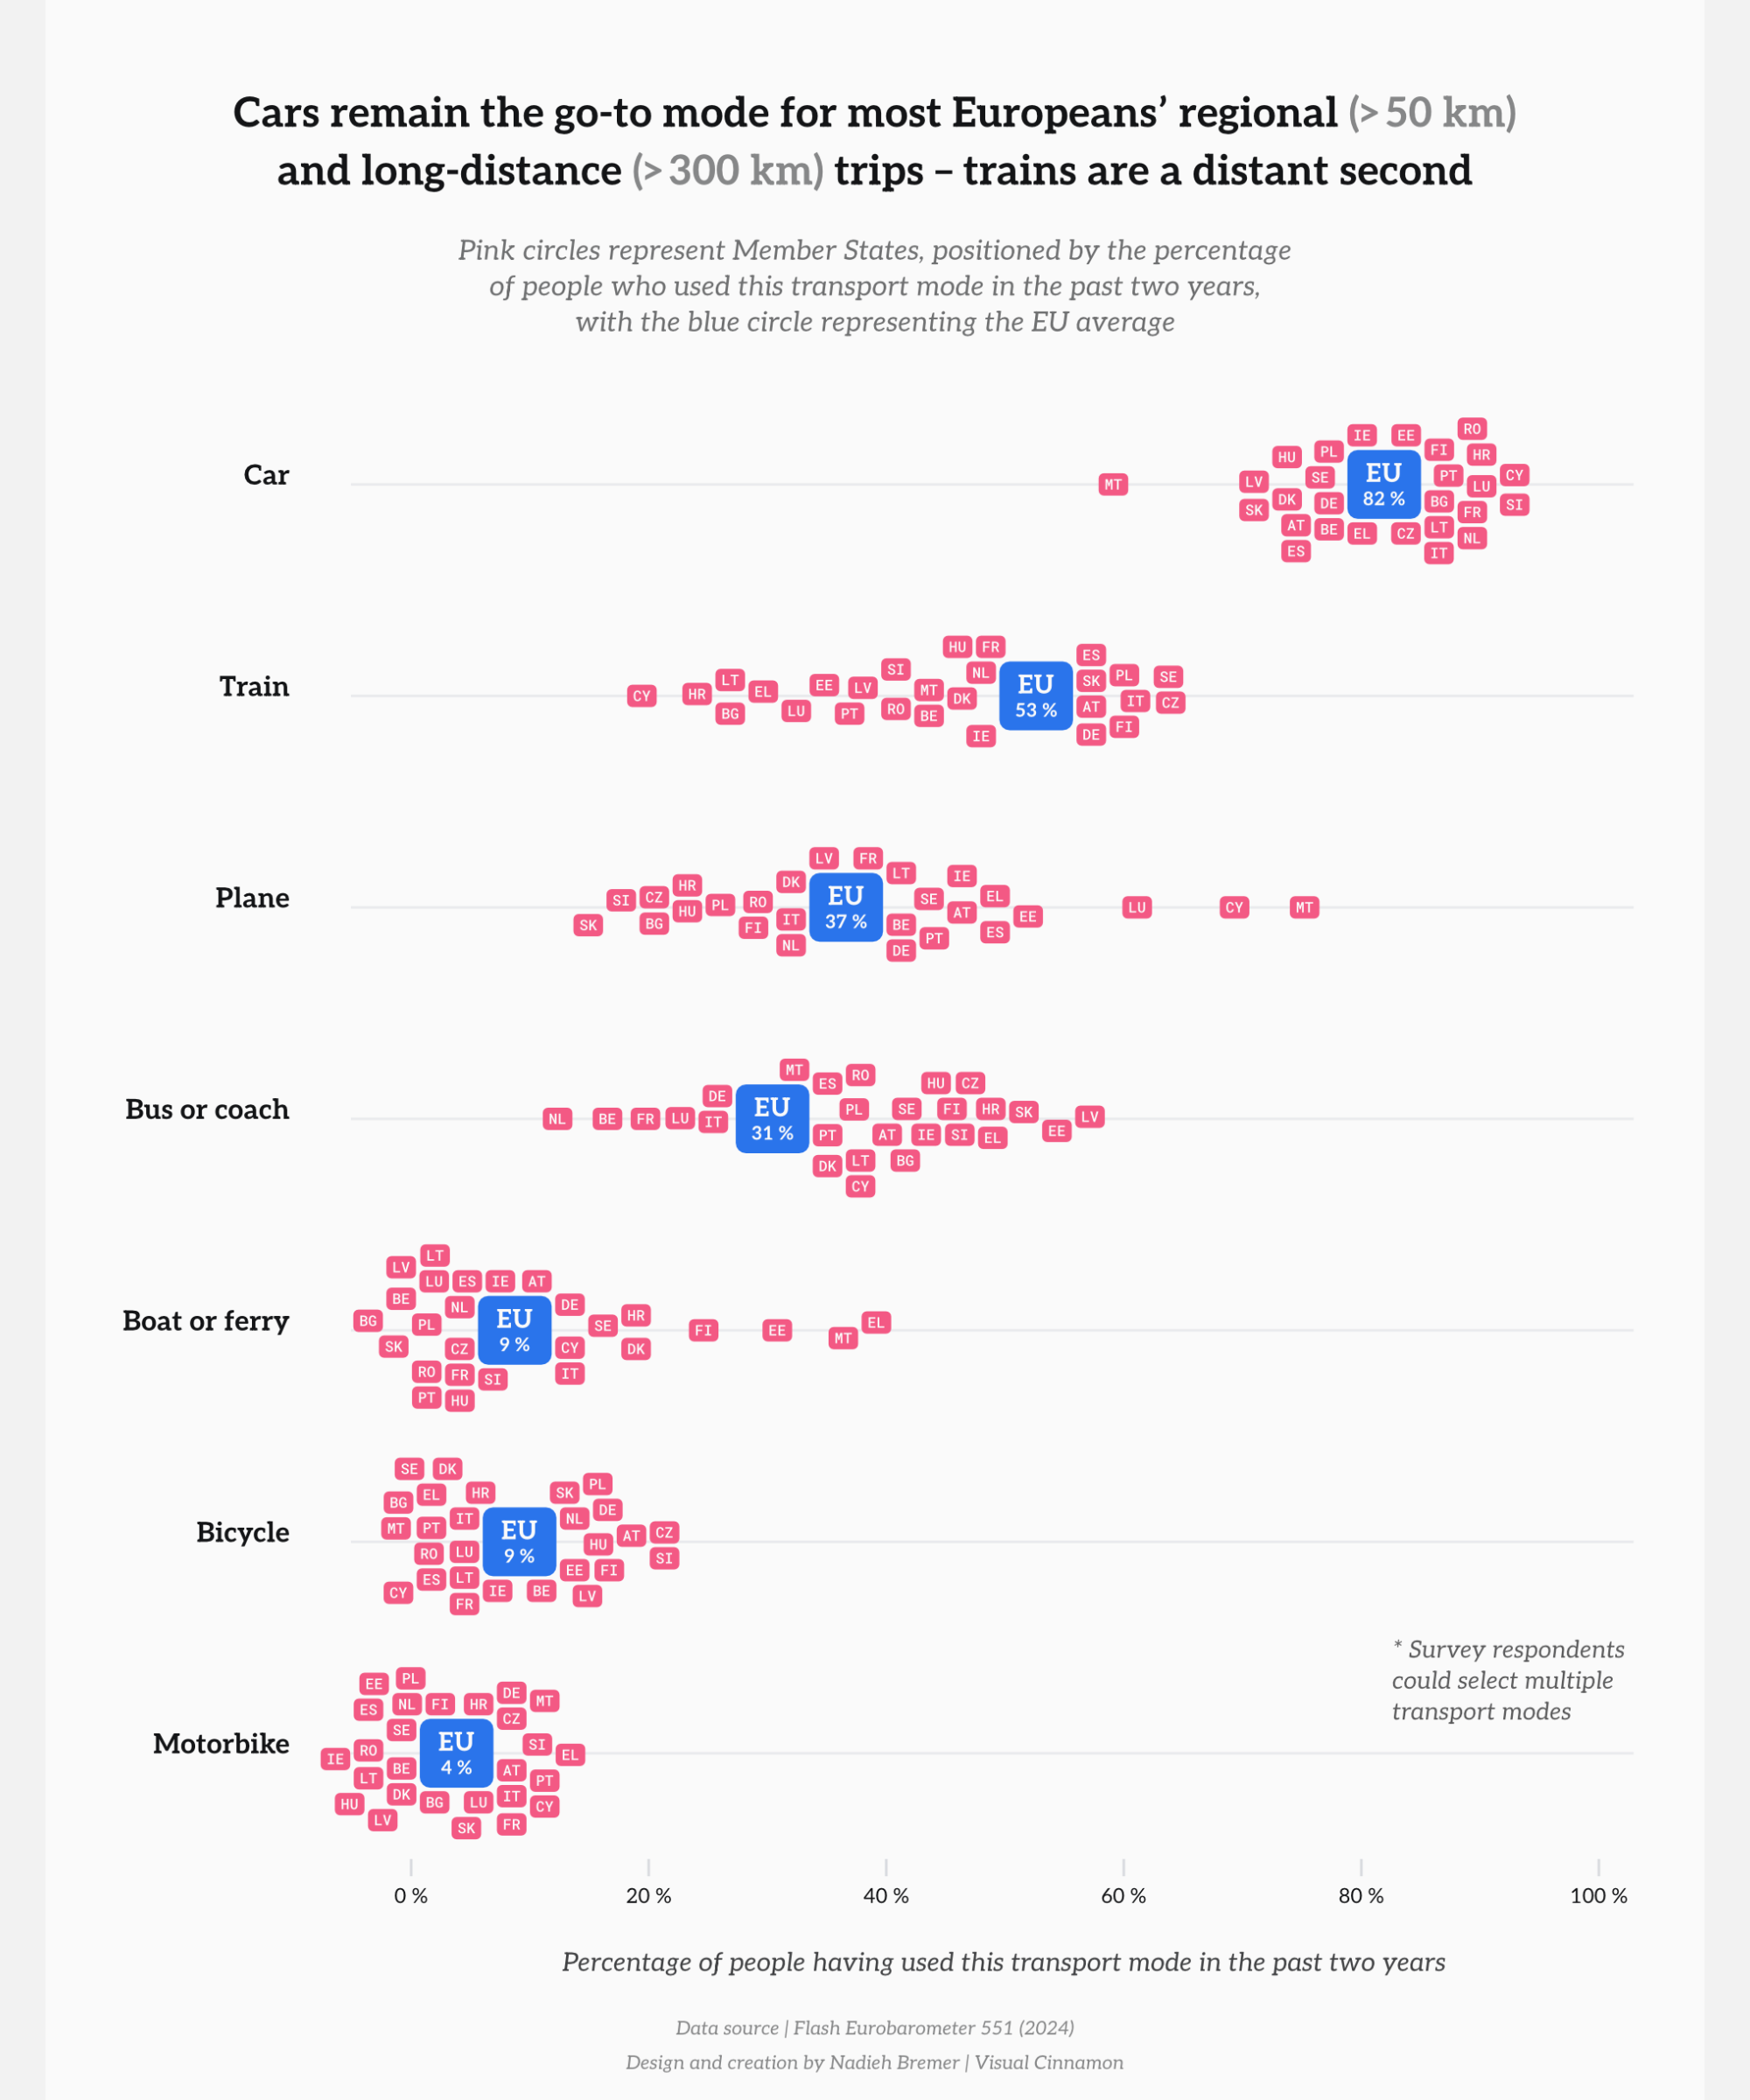
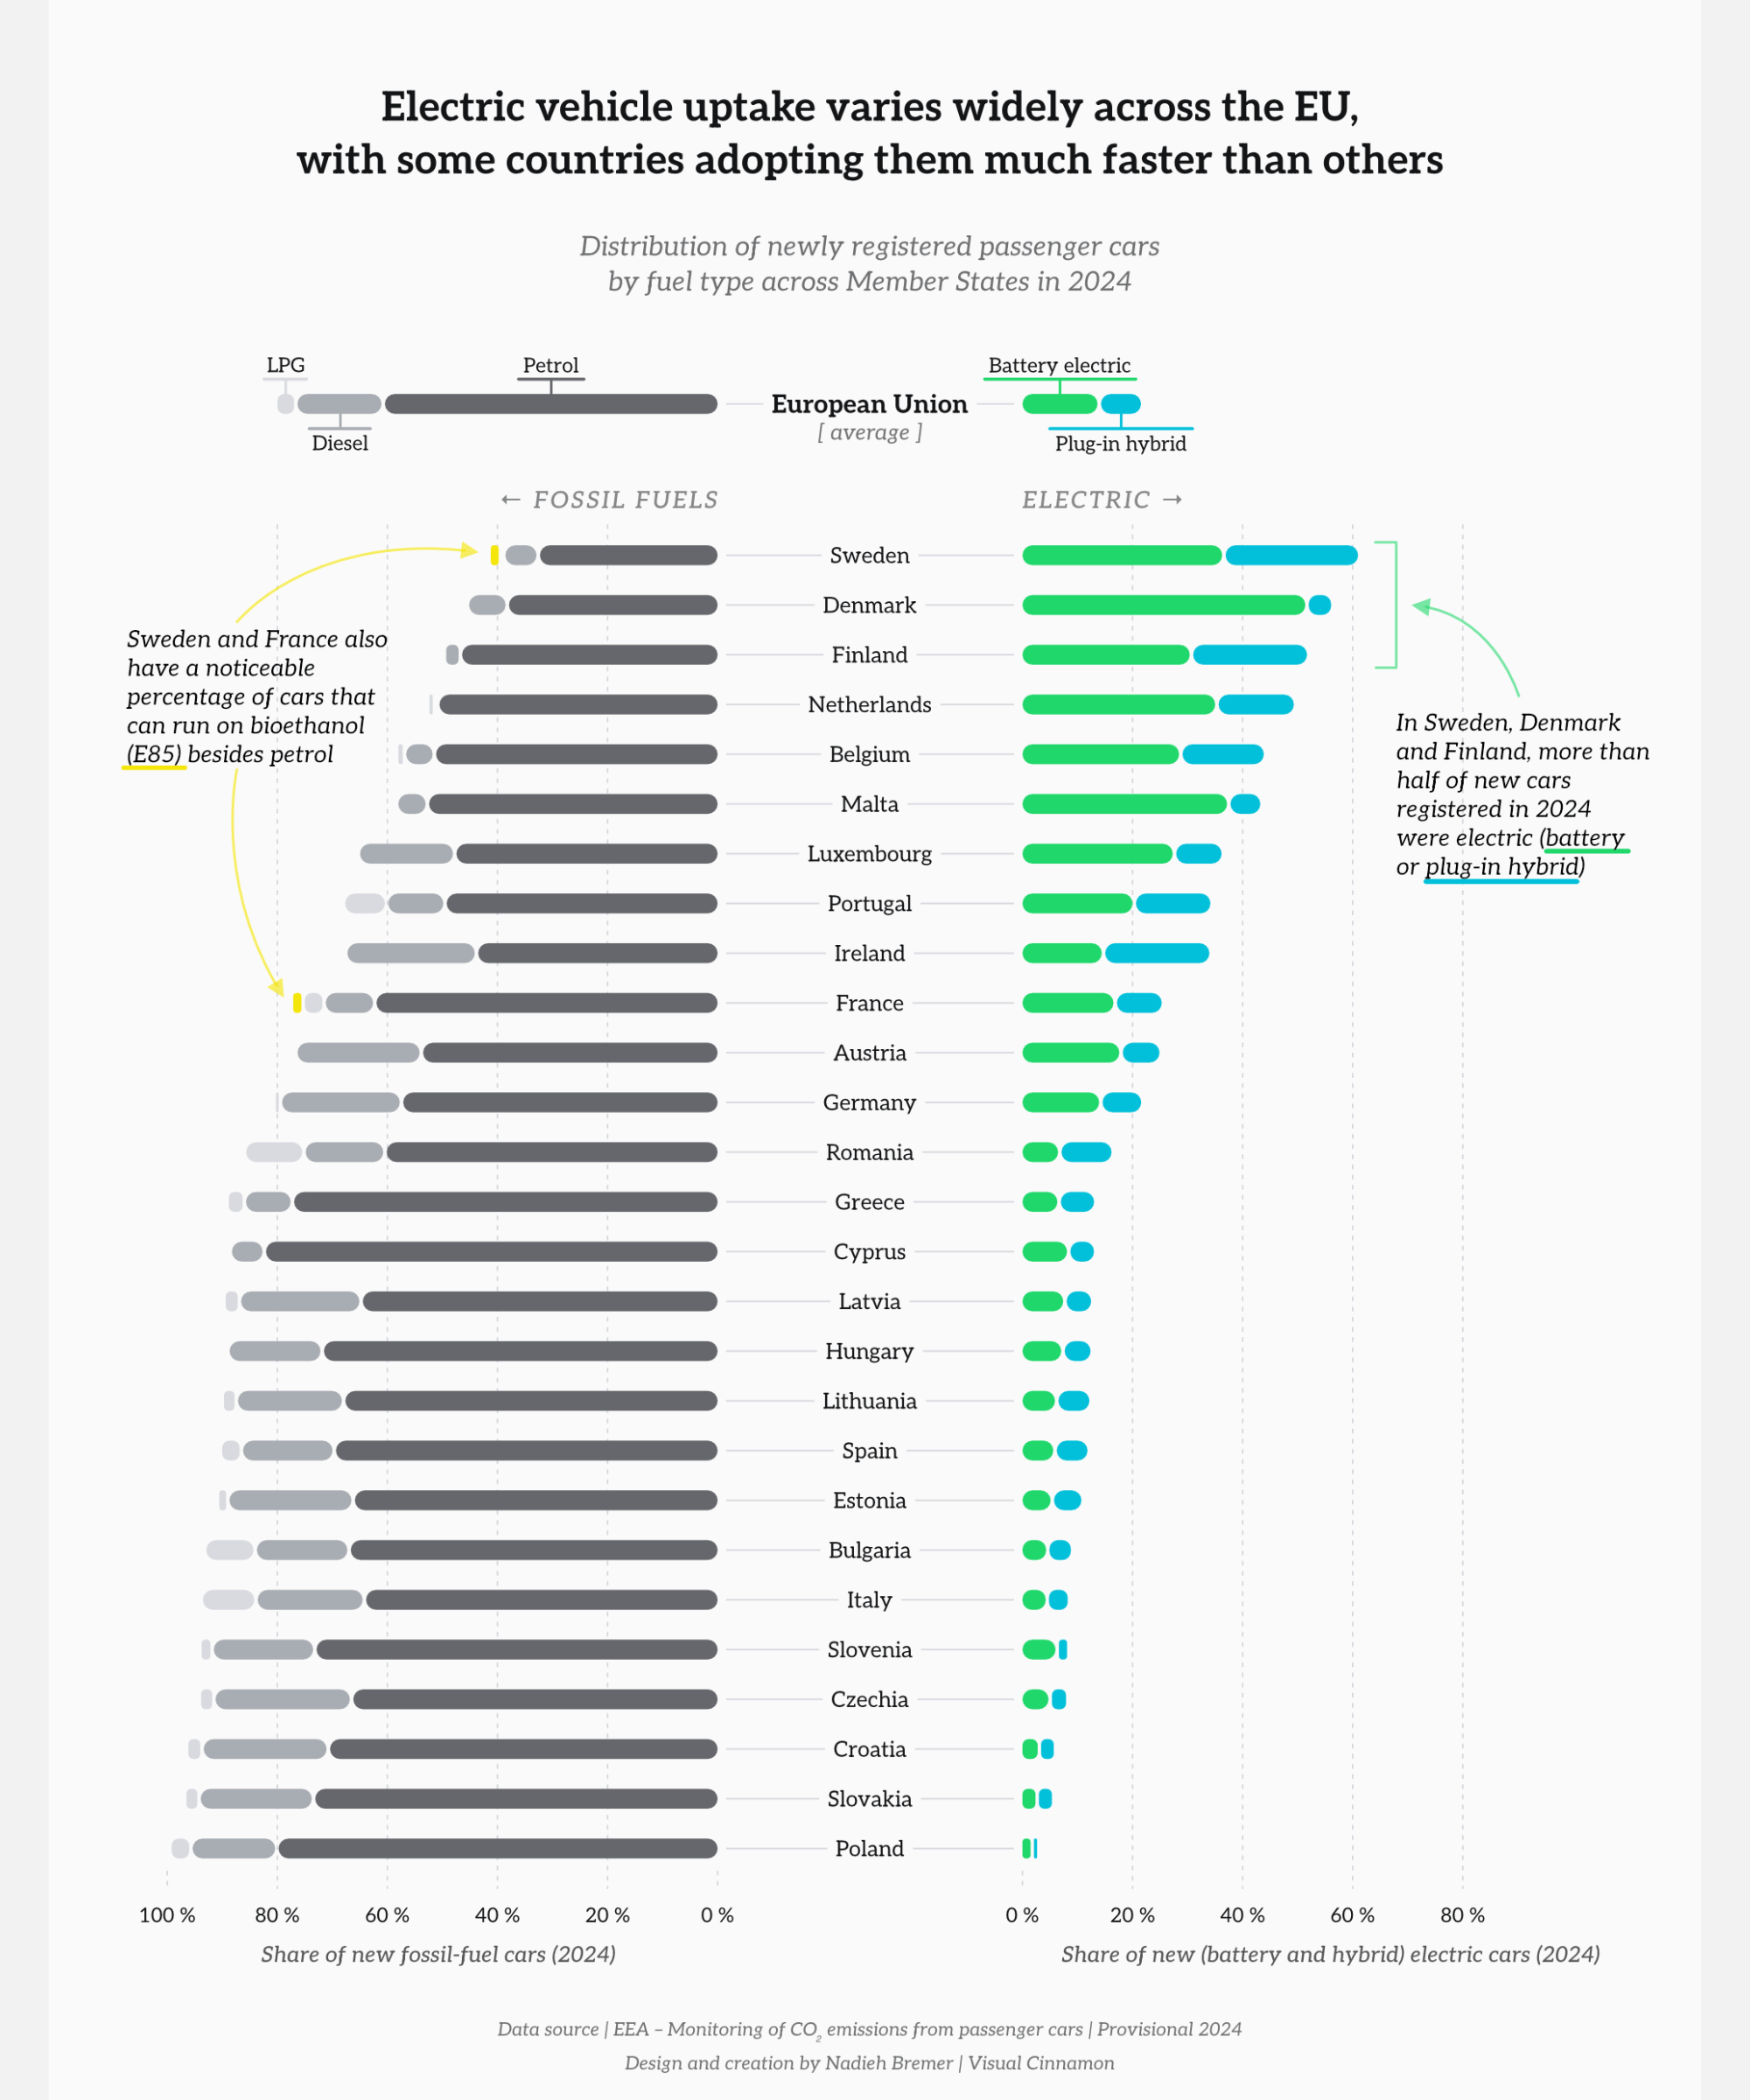
- The first is titled “Mobility in Europe: What open data shows about travel patterns” which offers insights into travel choices, transport expenditures and Europe’s shift to sustainable mobility. You can read it here.
- The second goes into “Artificial intelligence in Europe: how AI is entering everyday life” and provides insights on generative AI use by individuals, AI adoption by businesses and European attitudes towards the technology. You can read it here.