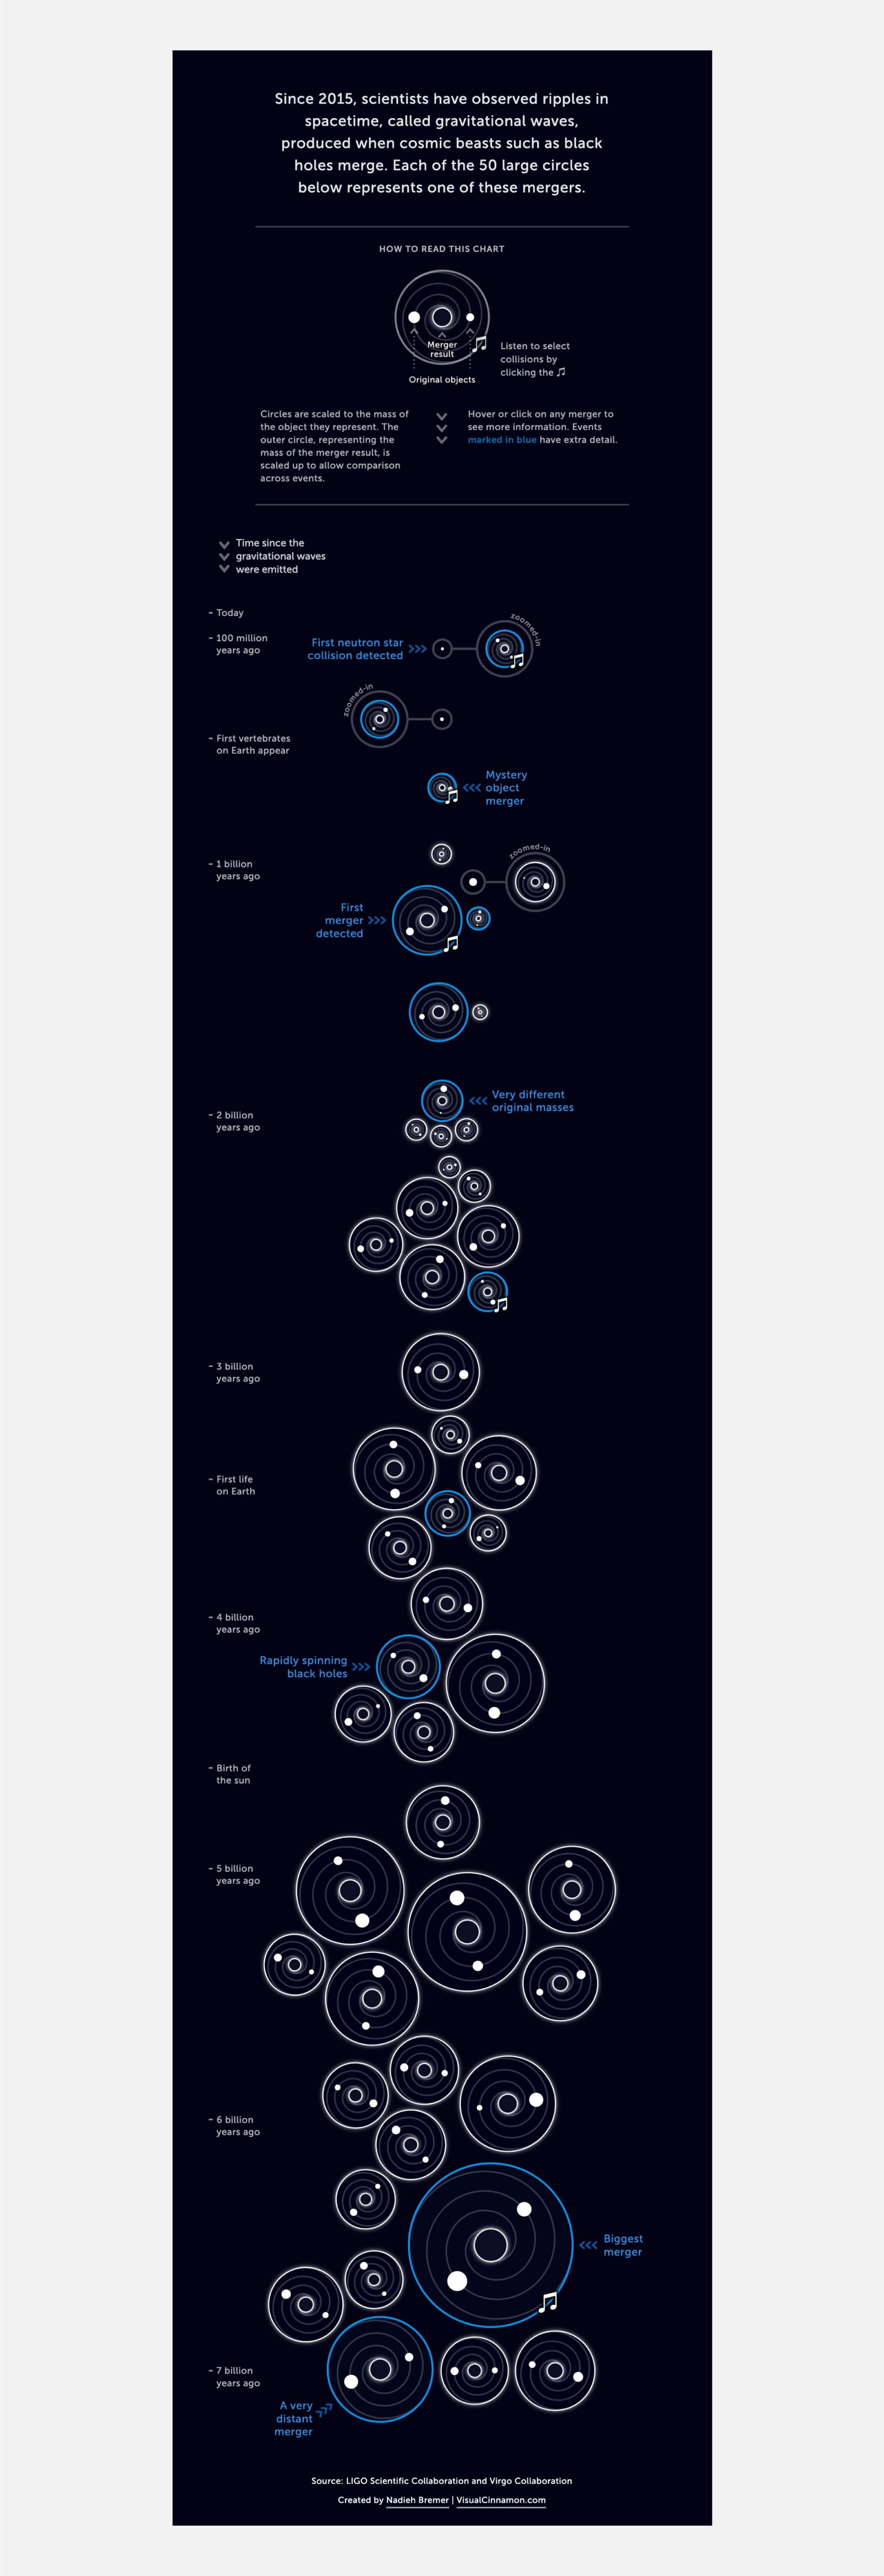
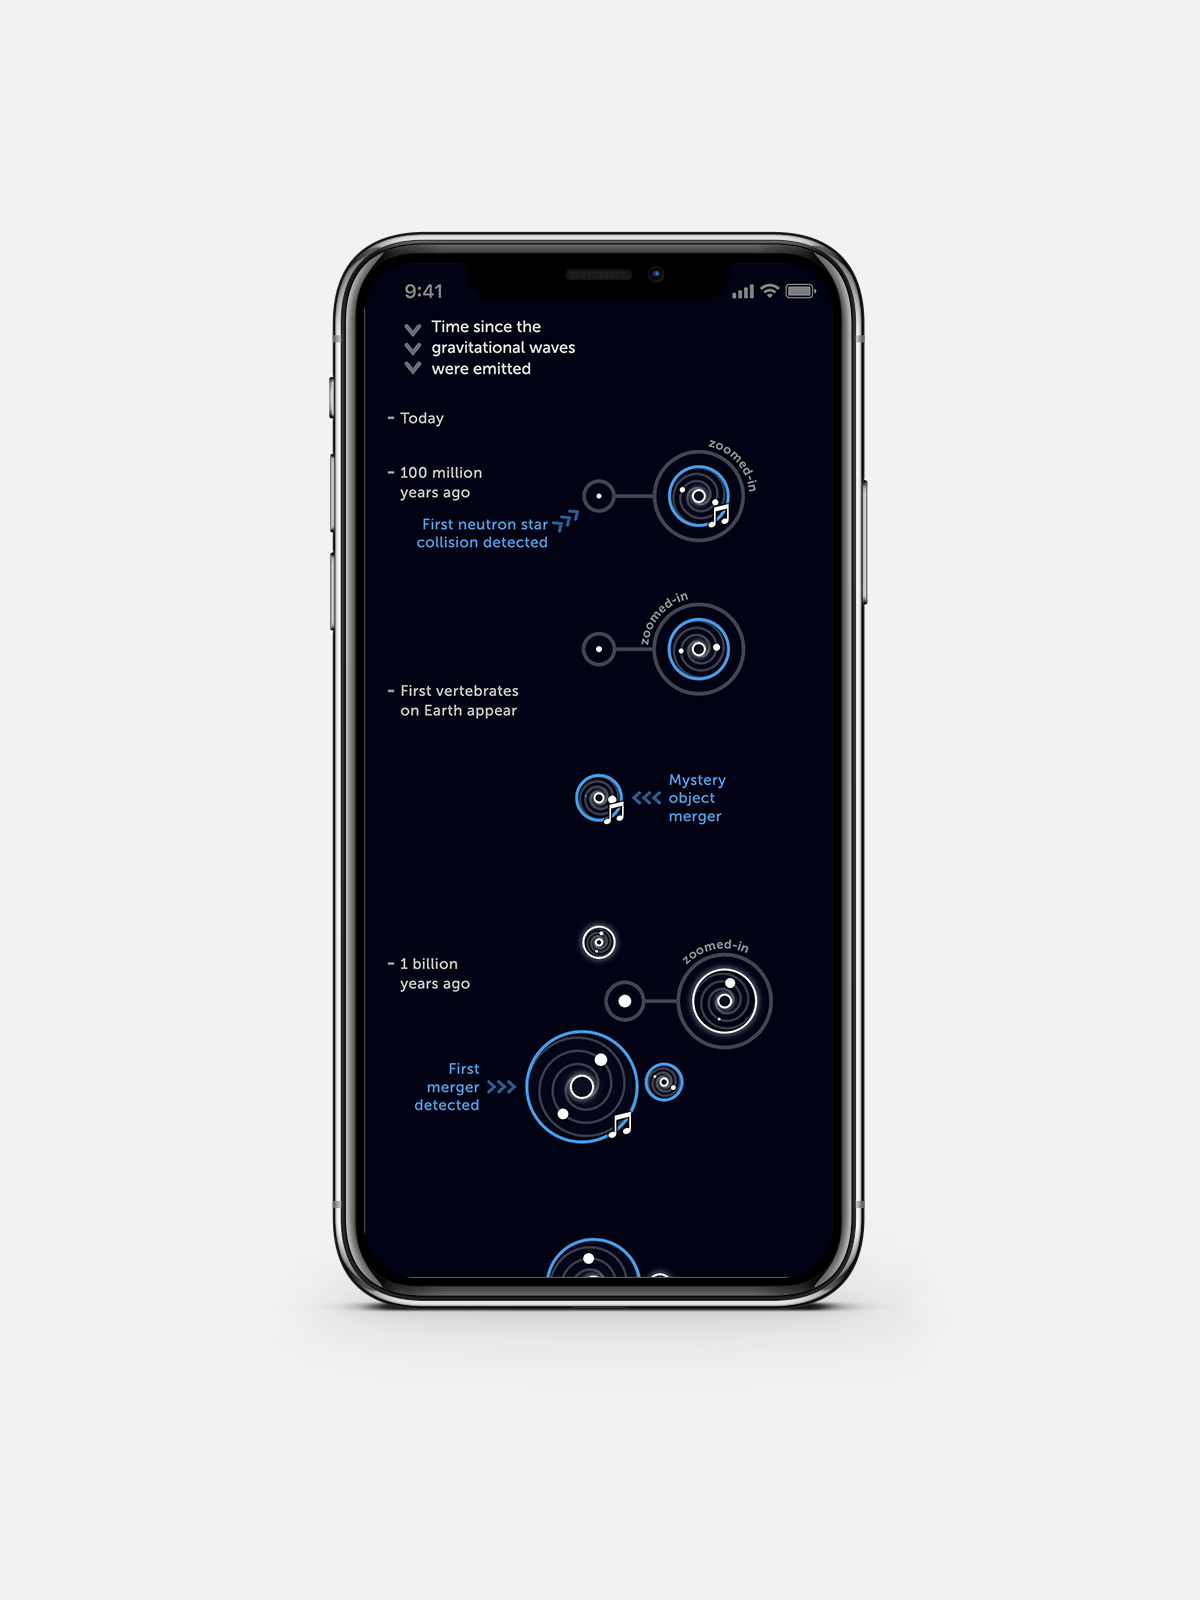
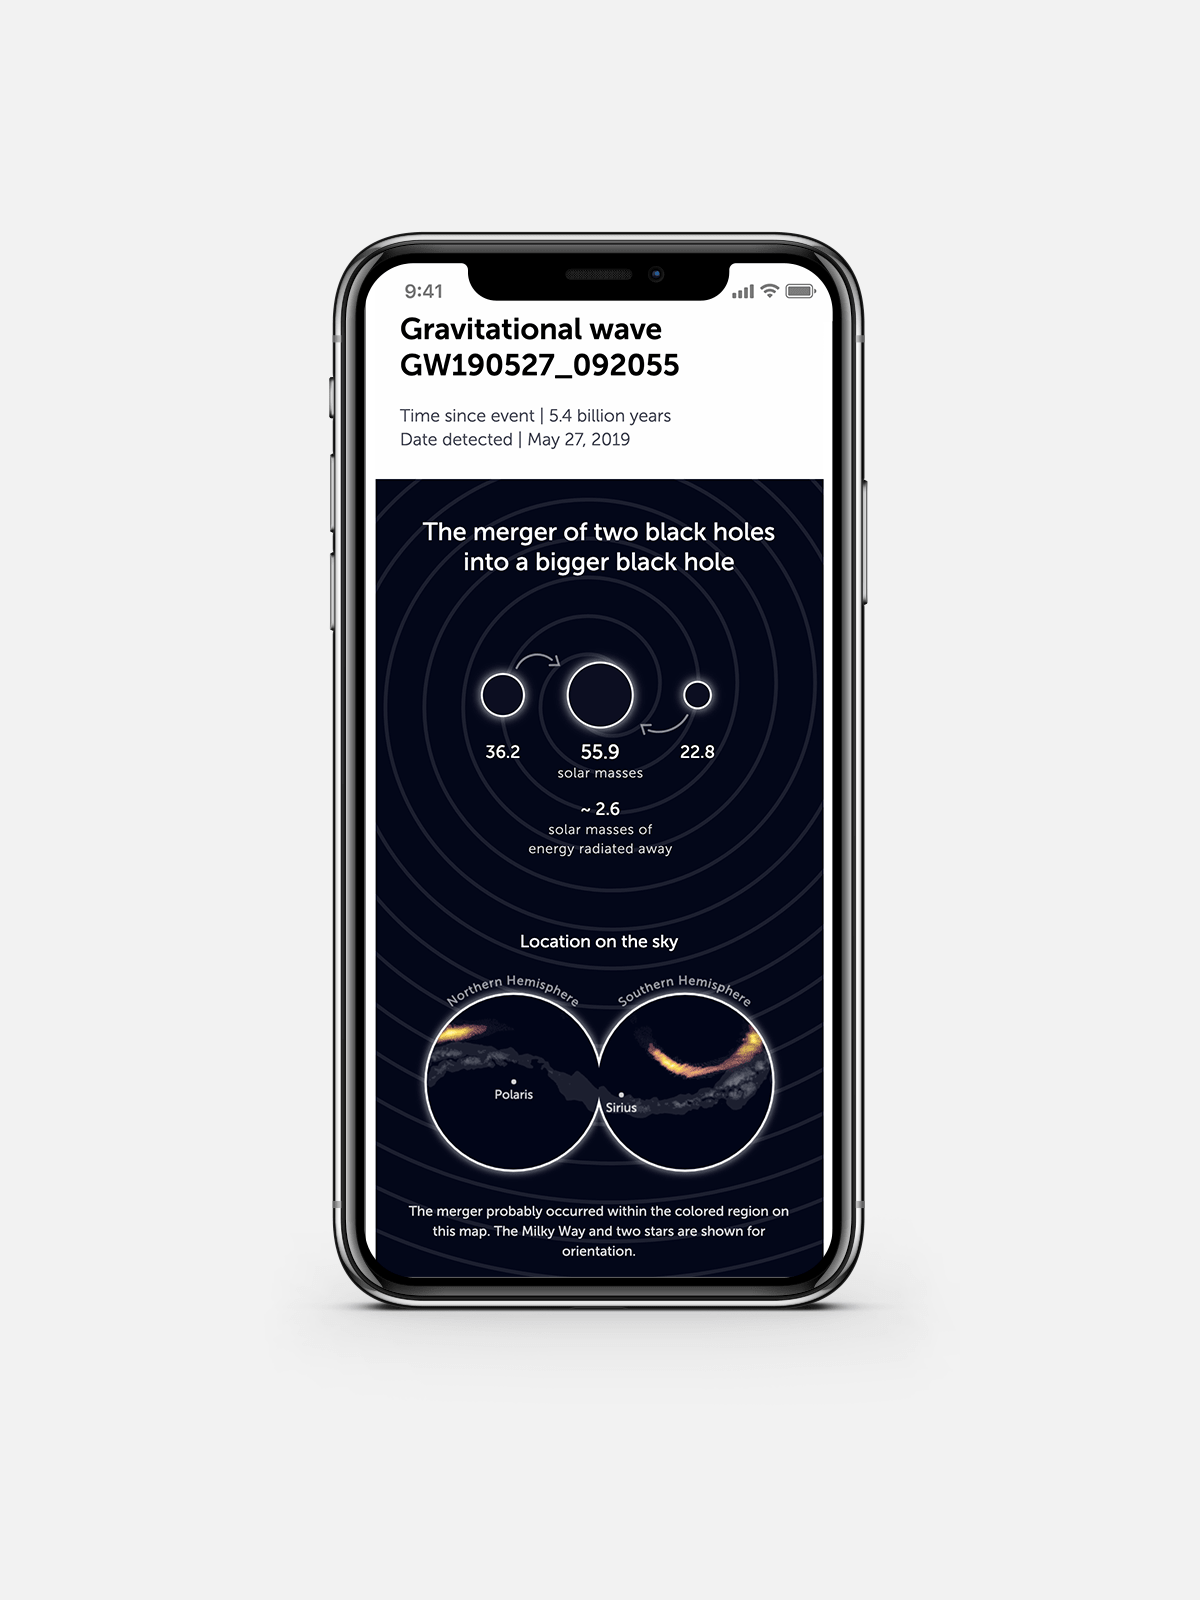
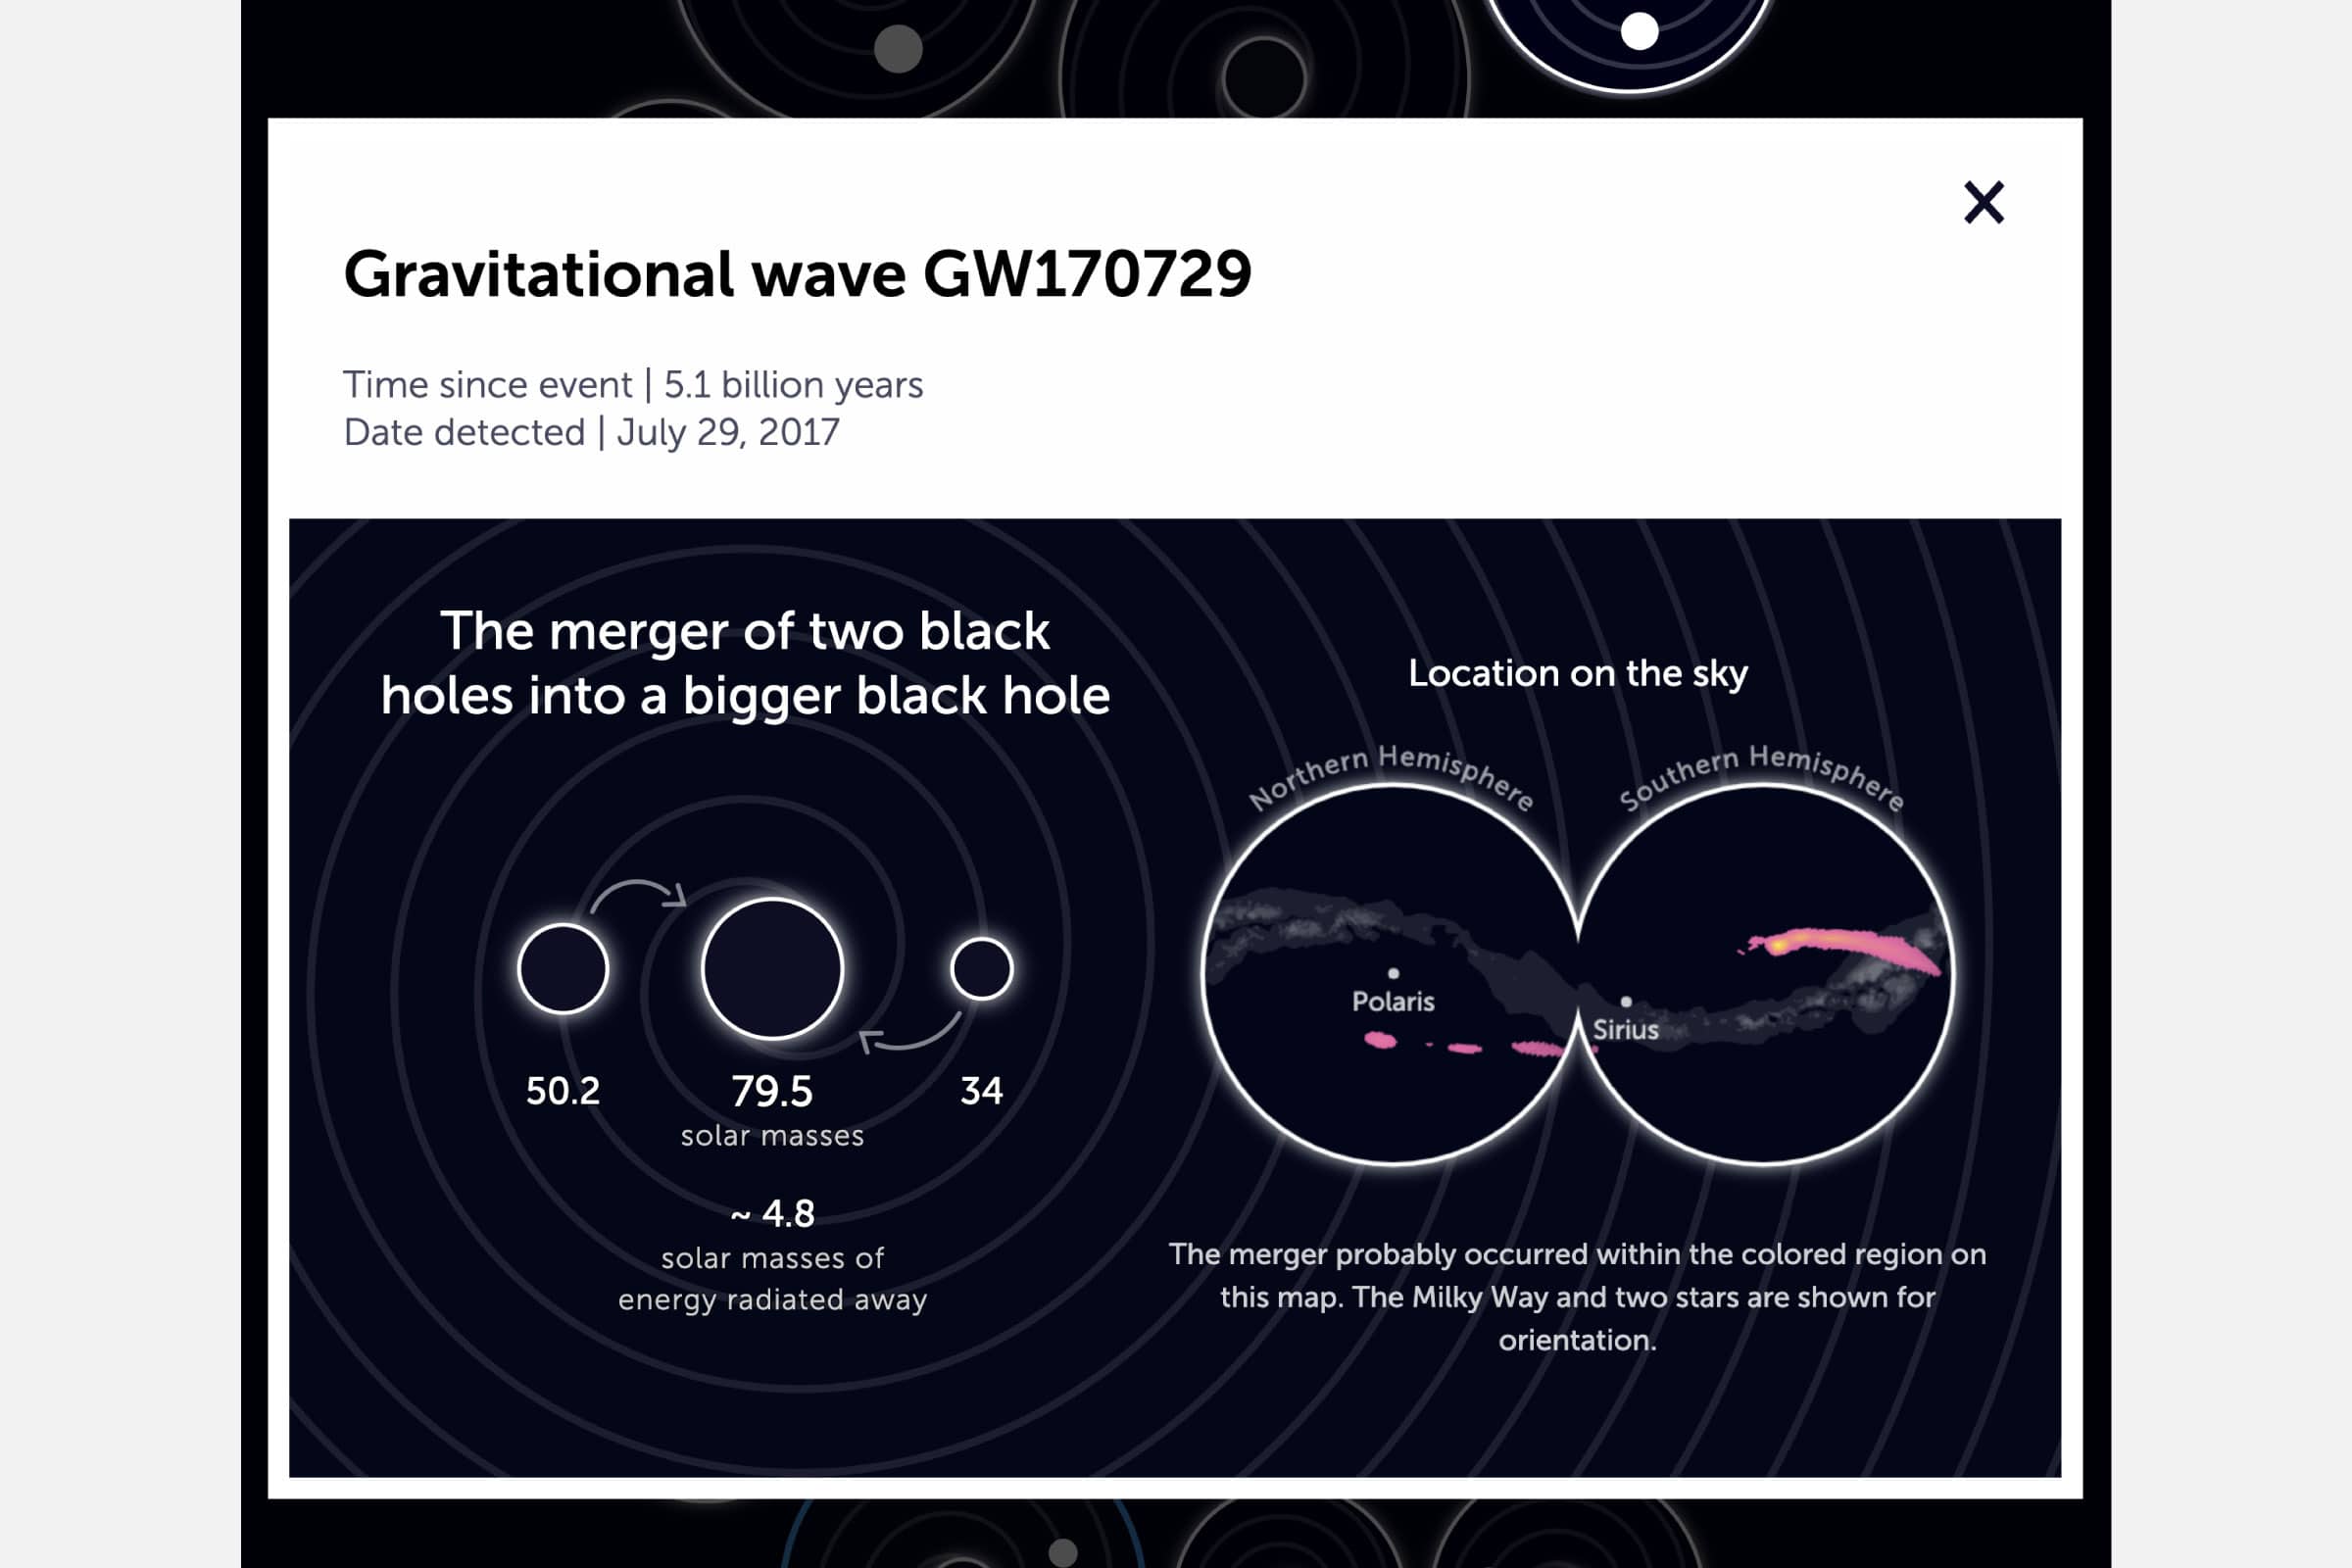
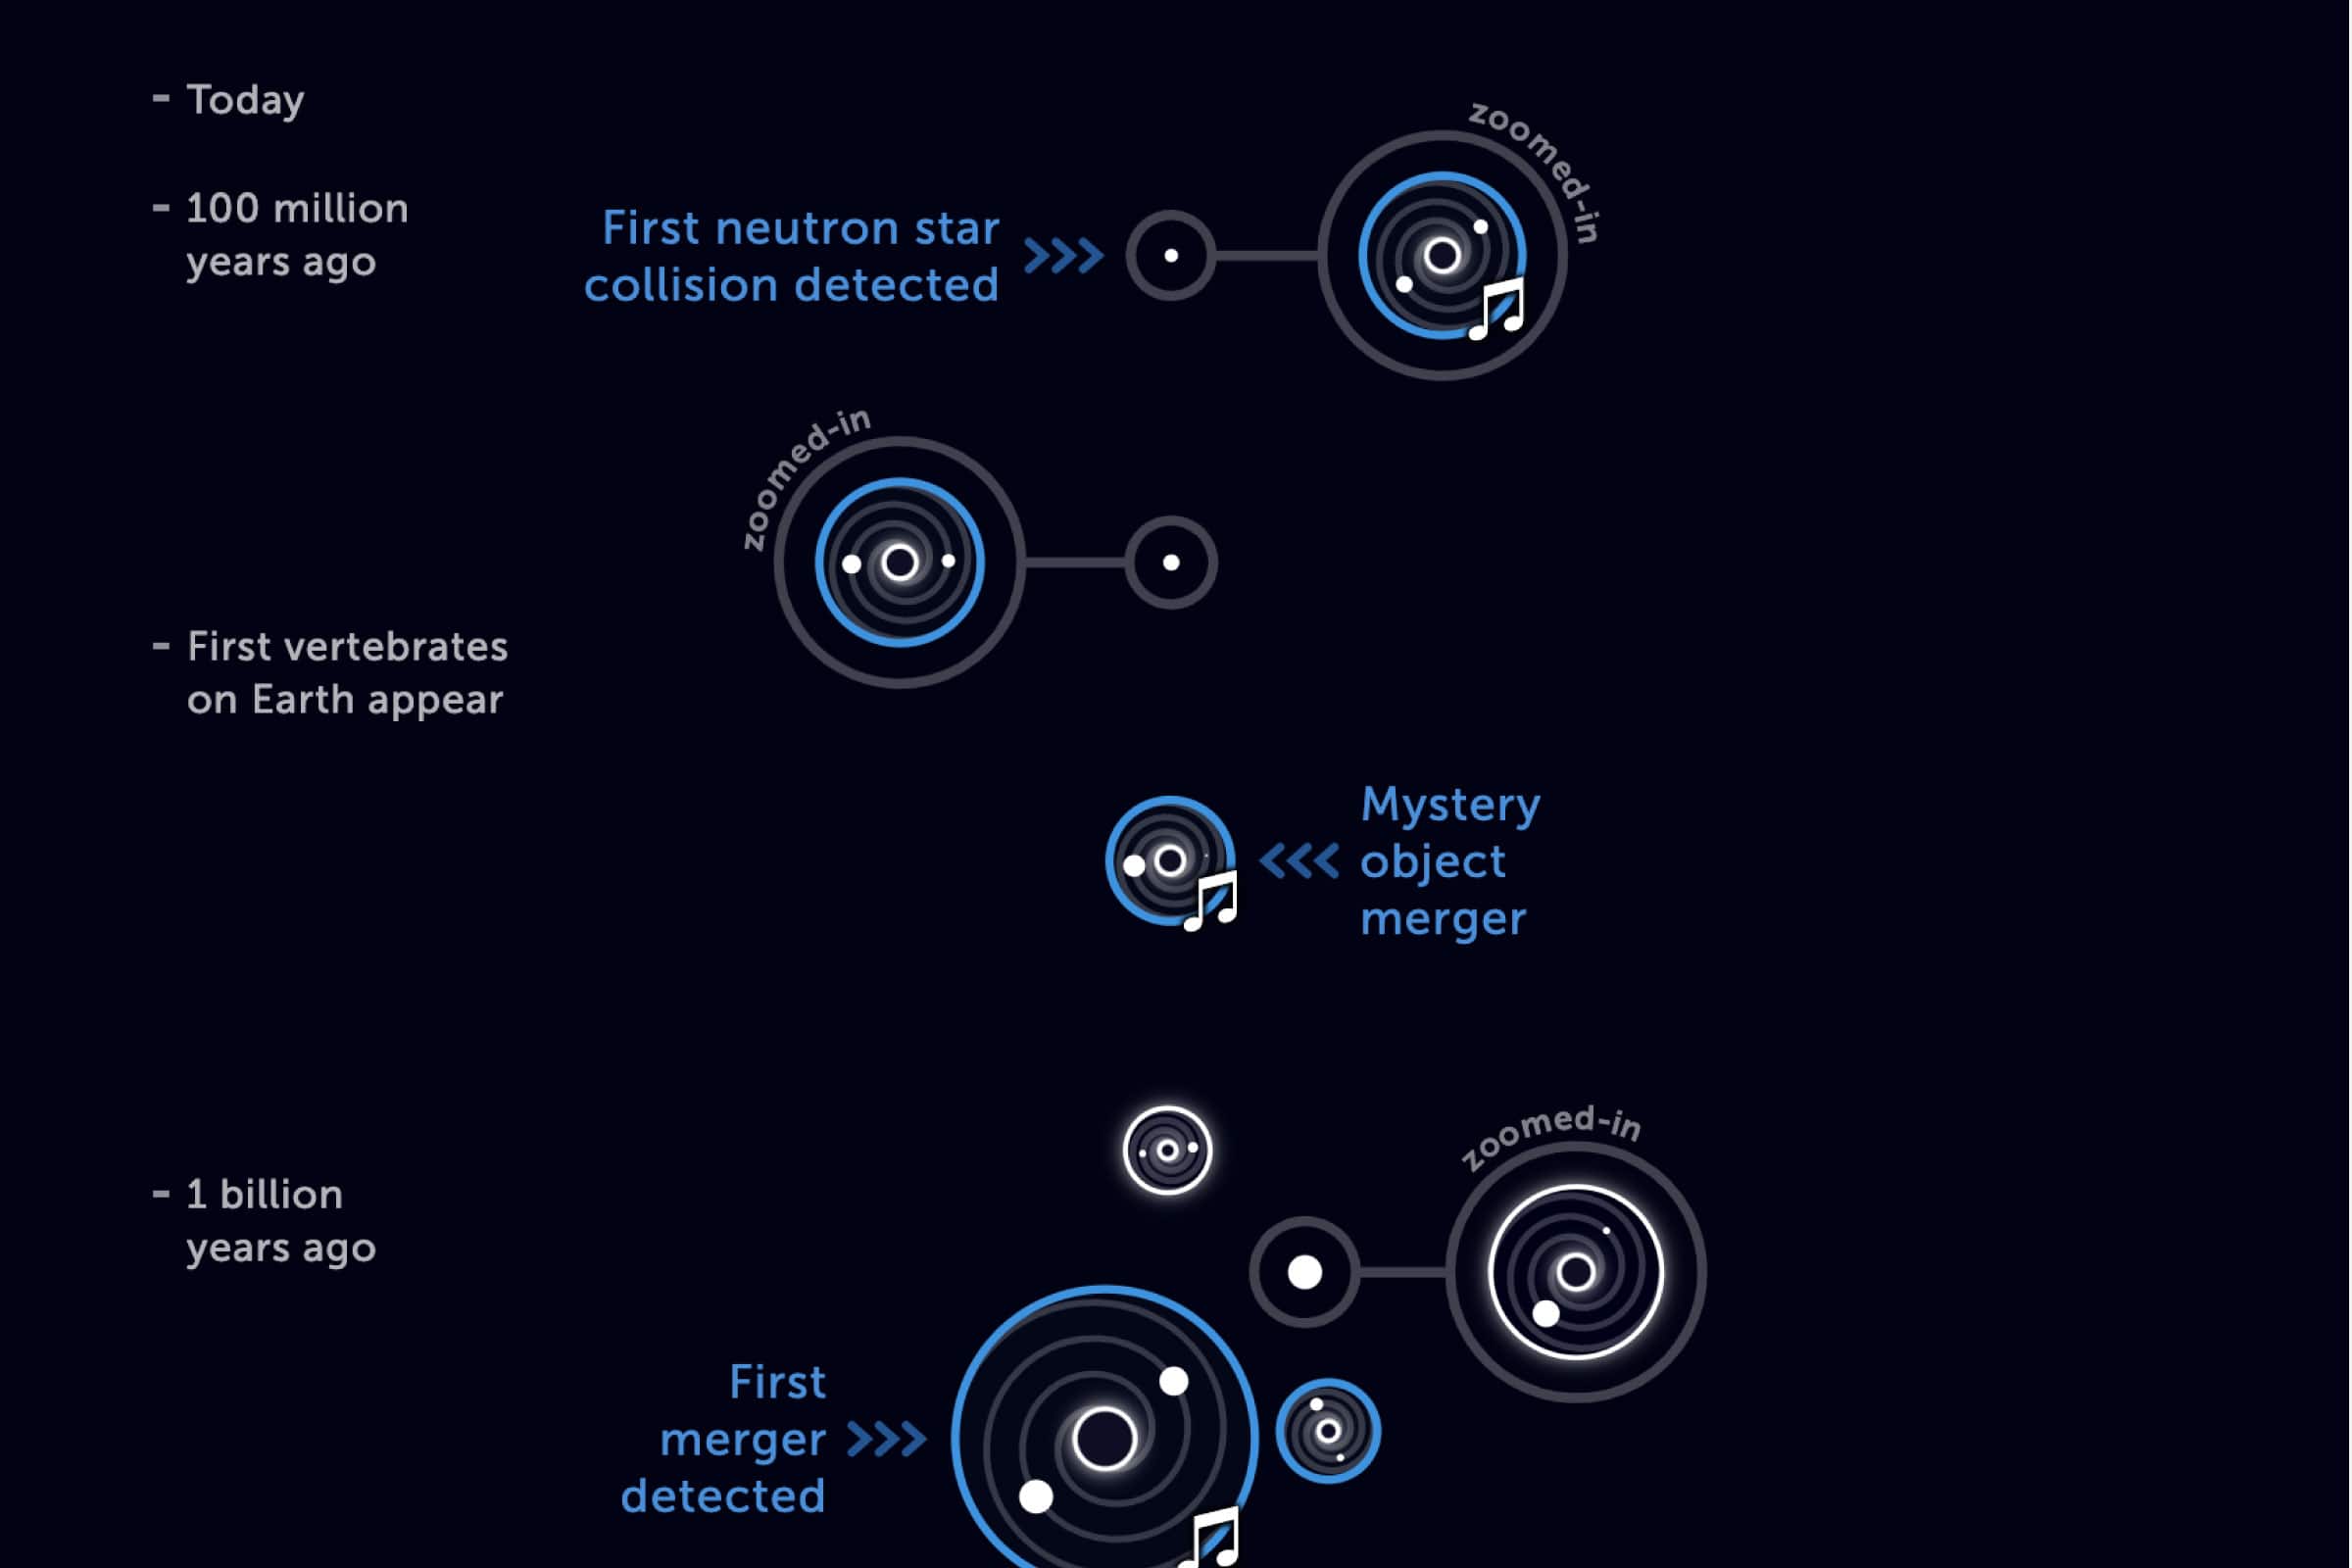
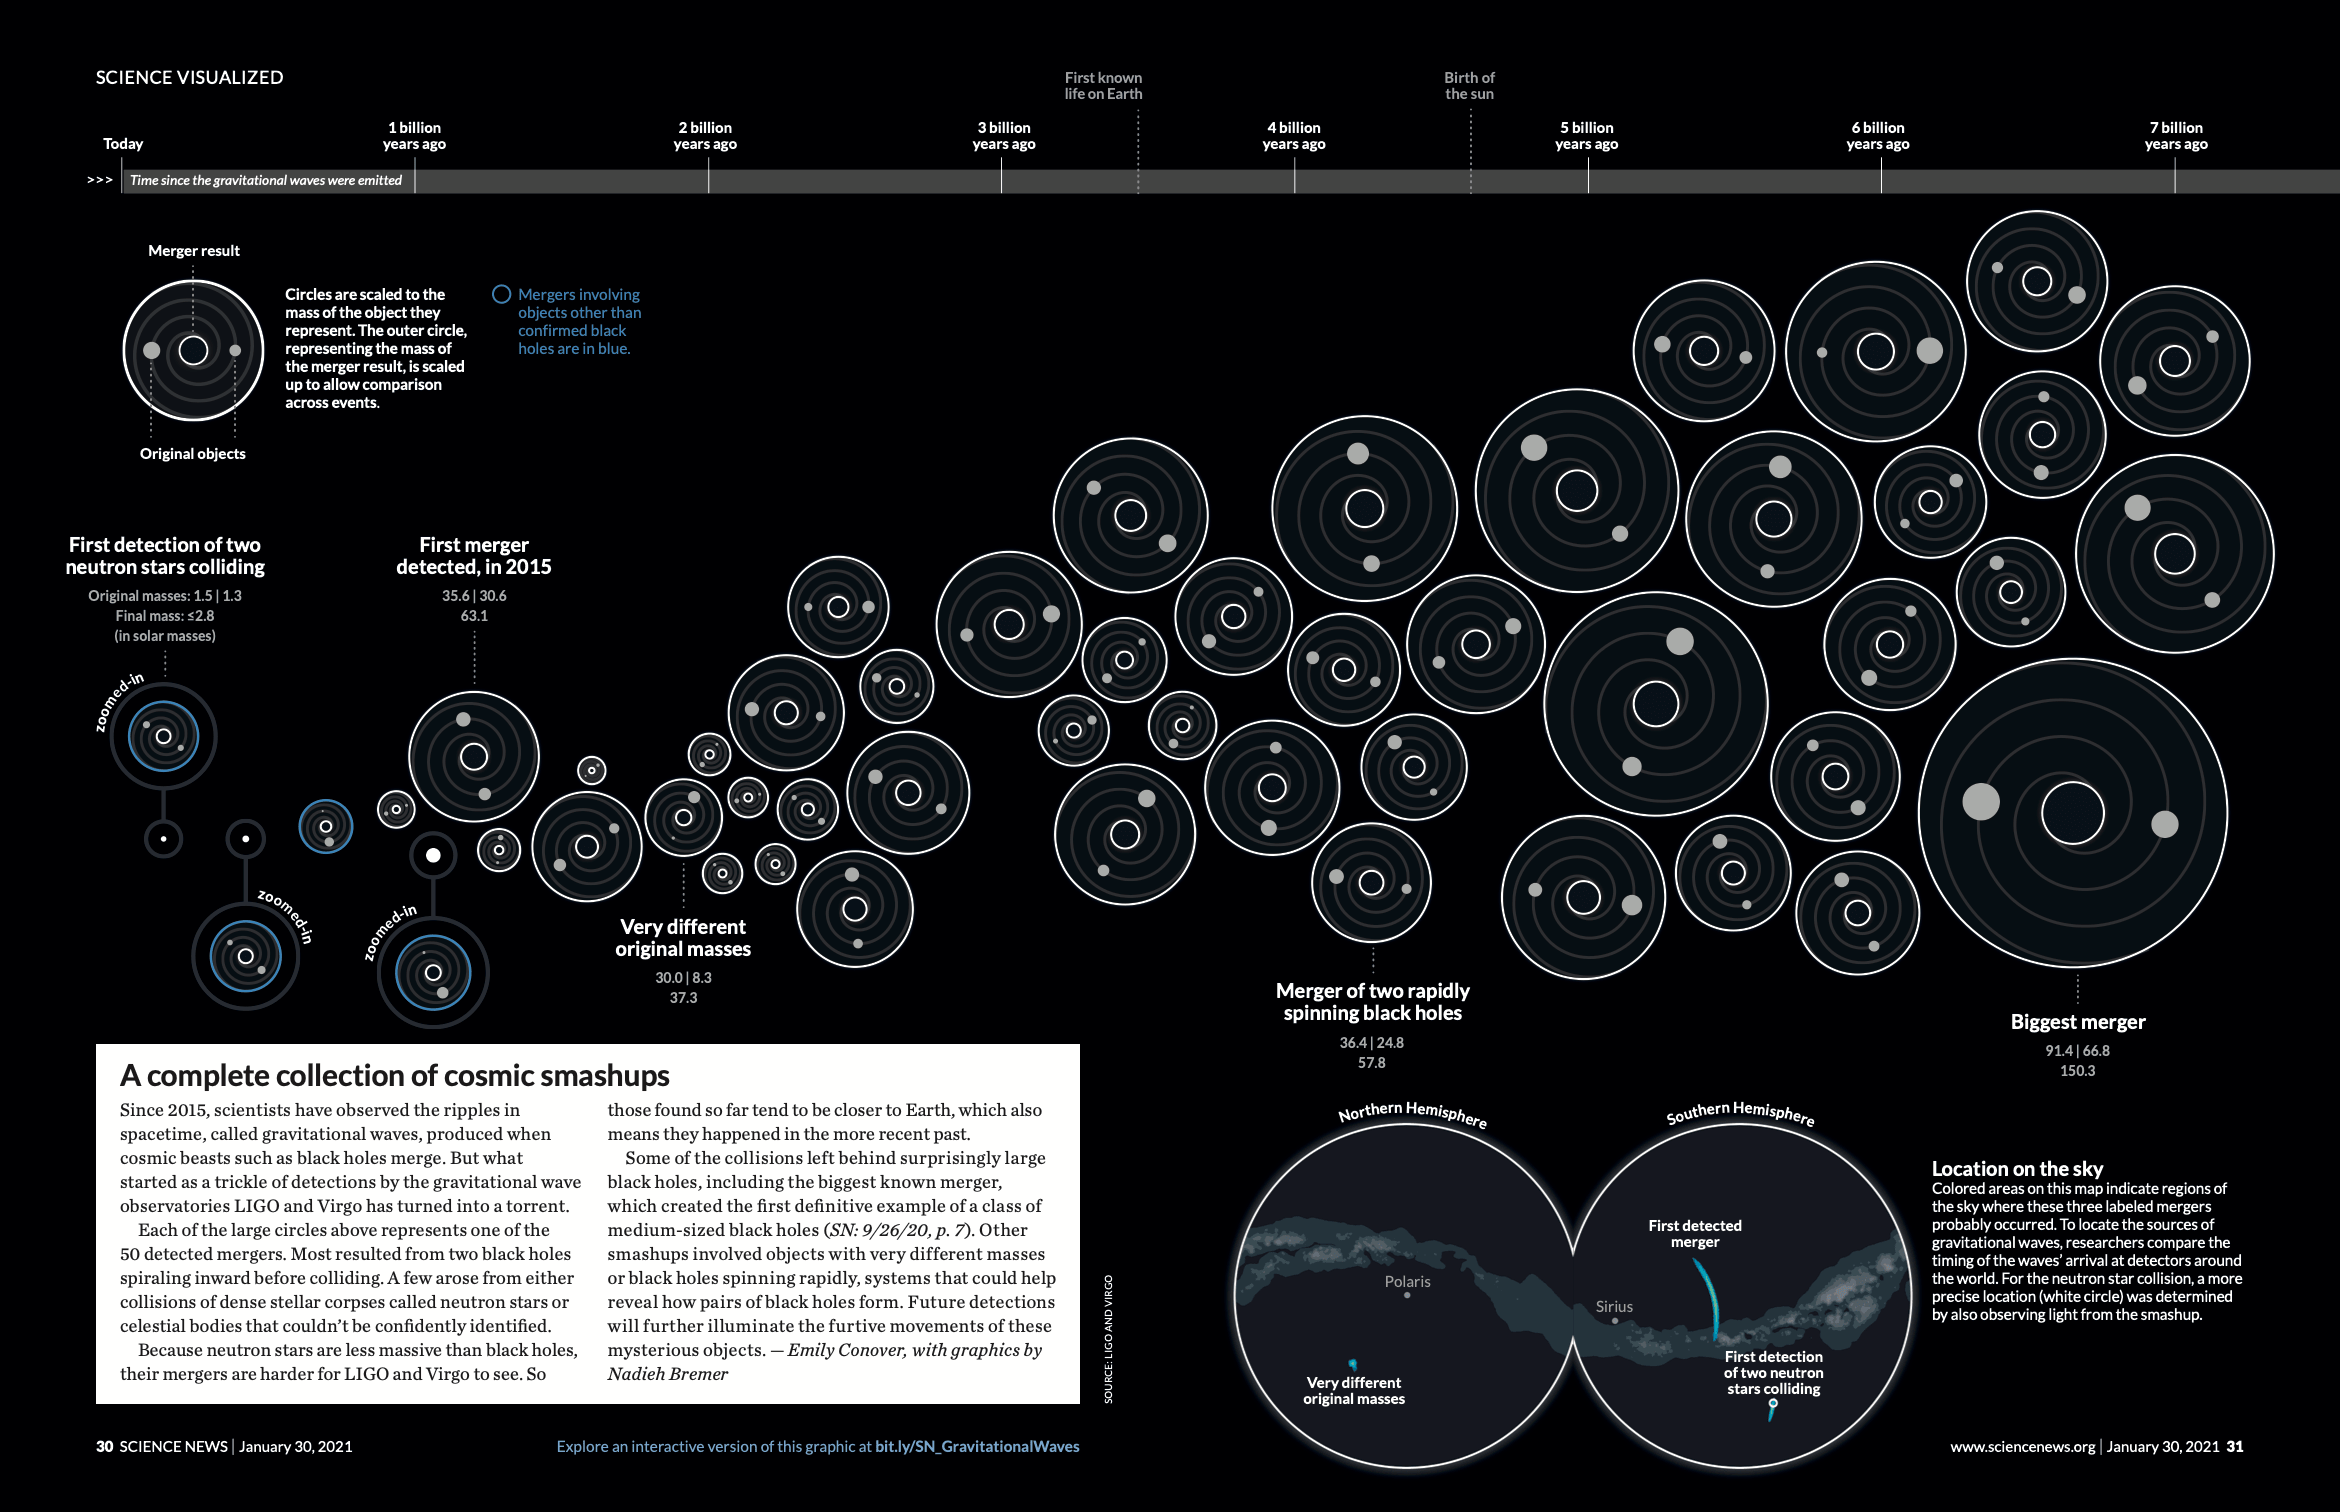
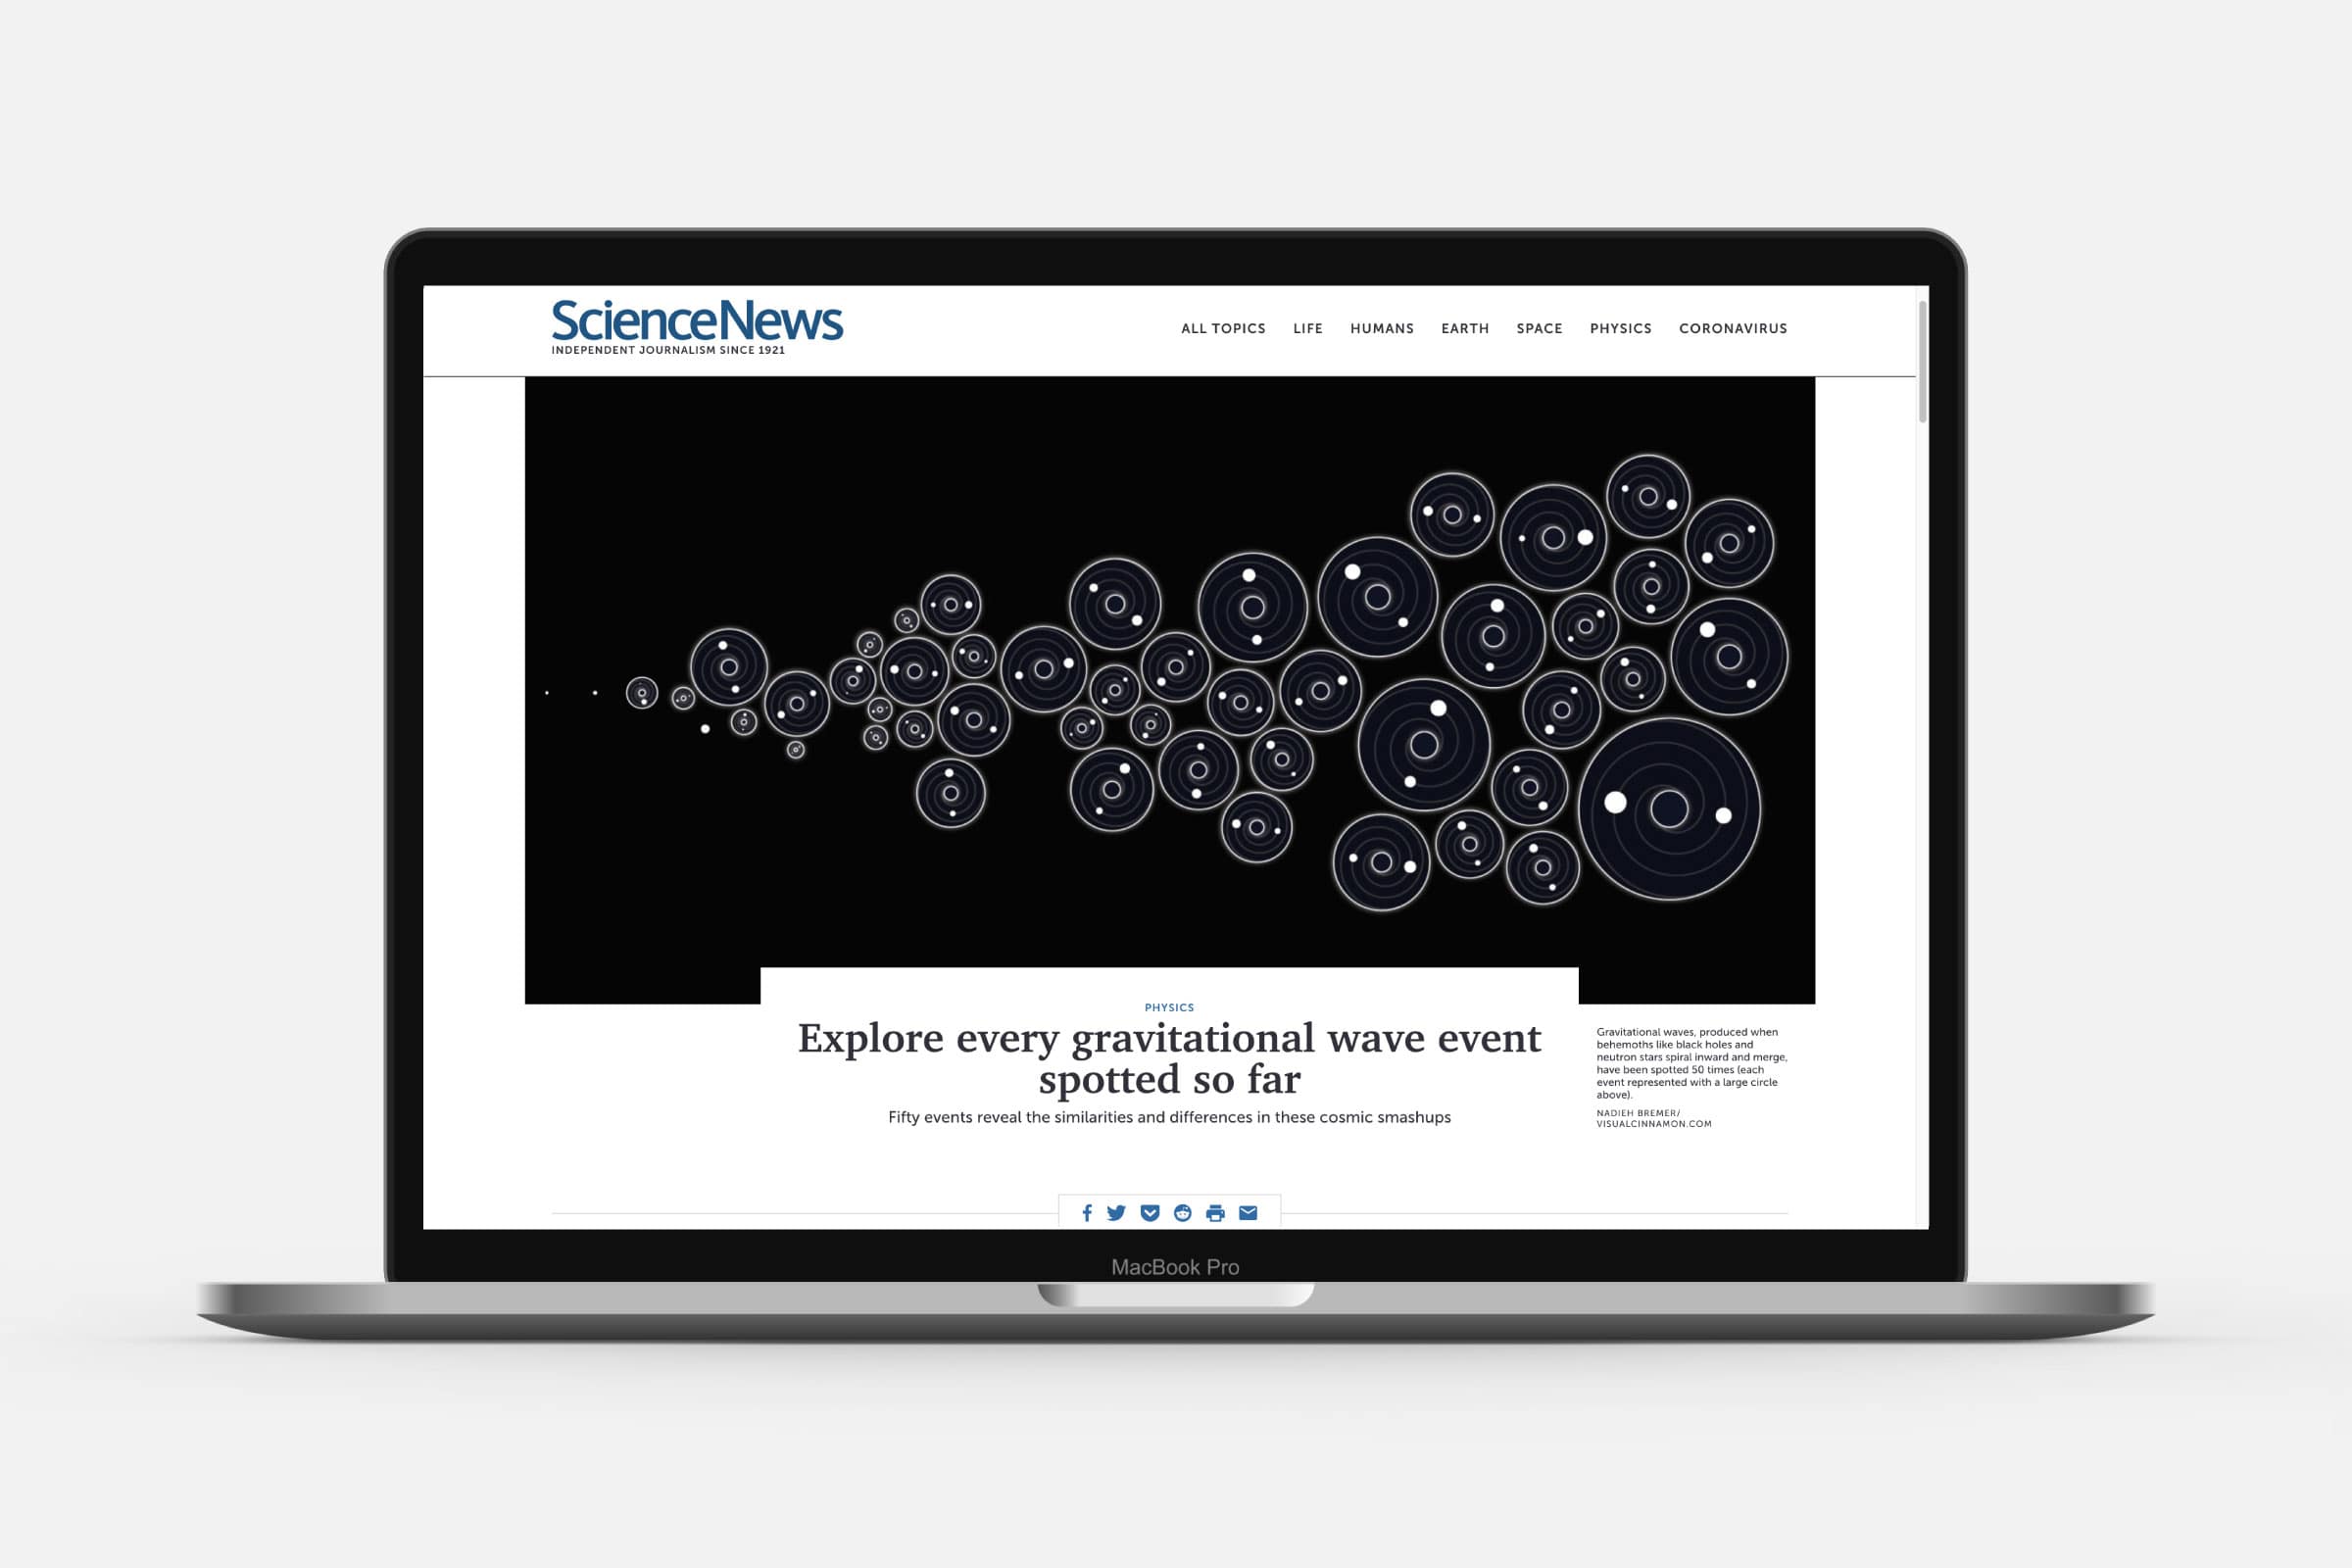
First discovered in 2015, LIGO and Virgo have since detected 50 gravitational wave events. These ripples through space time itself are caused by the violent collisions of black holes (and/or neutron stars) dating back billions of years. To celebrate the release of the 2nd catalog of mergers Science News asked me to create an interactive data visualization revealing each event together with a companion for their printed magazine. We wanted to make the interactive part more special than a static visual. The final visual includes sound bites for some mergers. Hovering over a merger starts a tiny (physics based) animation of the merger. Clicking on any merger shows a pop-up modal with a lot more detailed information, such as a map of the sky that shows the rough location of where the gravitational waves originated from.