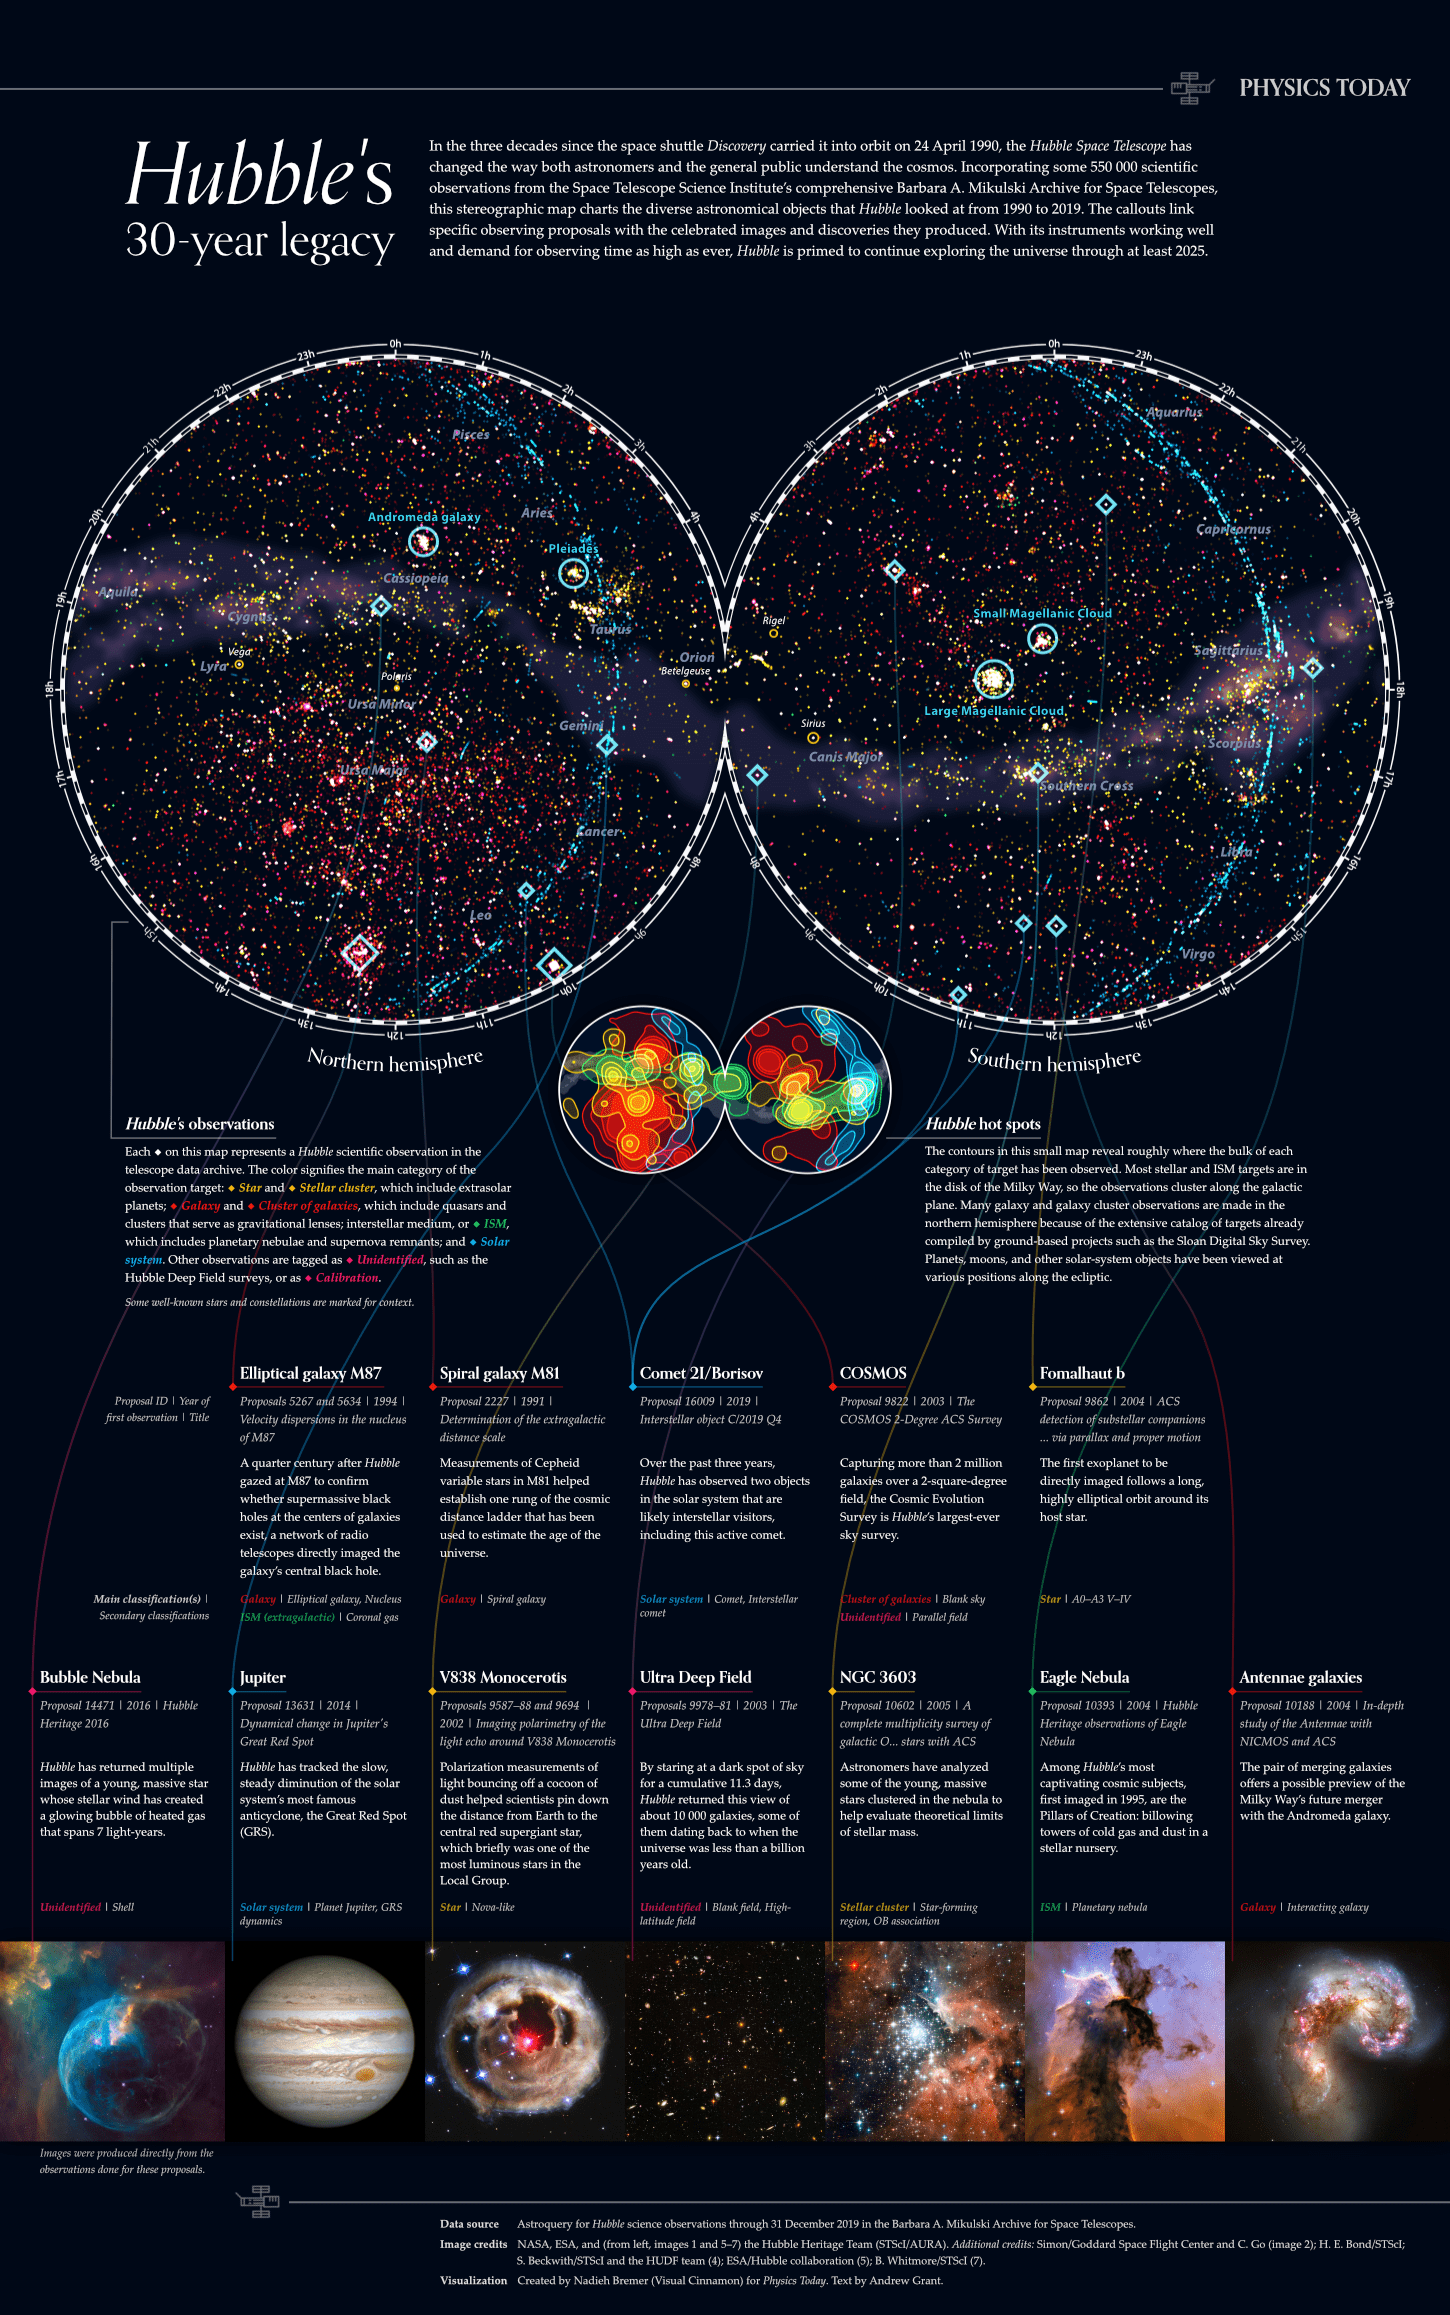
In celebration of the Hubble Space Telescope’s 30-year anniversary in April 2020 I created two static visualizations for Physics Today, to be used in their series of articles on Hubble’s history. The main visual became a full poster that revealed more than 550,000 observations in a map of the sky, while highlighting some of the most famous observations and photos. The second visual was created as a companion piece outlining the different target classifications of Hubble’s observations. Originally only meant to appear online, the client was so enthusiastic about the main visual that it was adapted and published as a gate-fold in their April issue of the Physics Today magazine as well.

With my background in astronomy, and the amazing photos that Hubble has made being one of the main reasons that I got interested in astronomy in the first place, I was beyond excited to work on this project! With access to a dataset containing all of the science observations that Hubble has ever performed, it was clear that the angles to visualize could be endless.
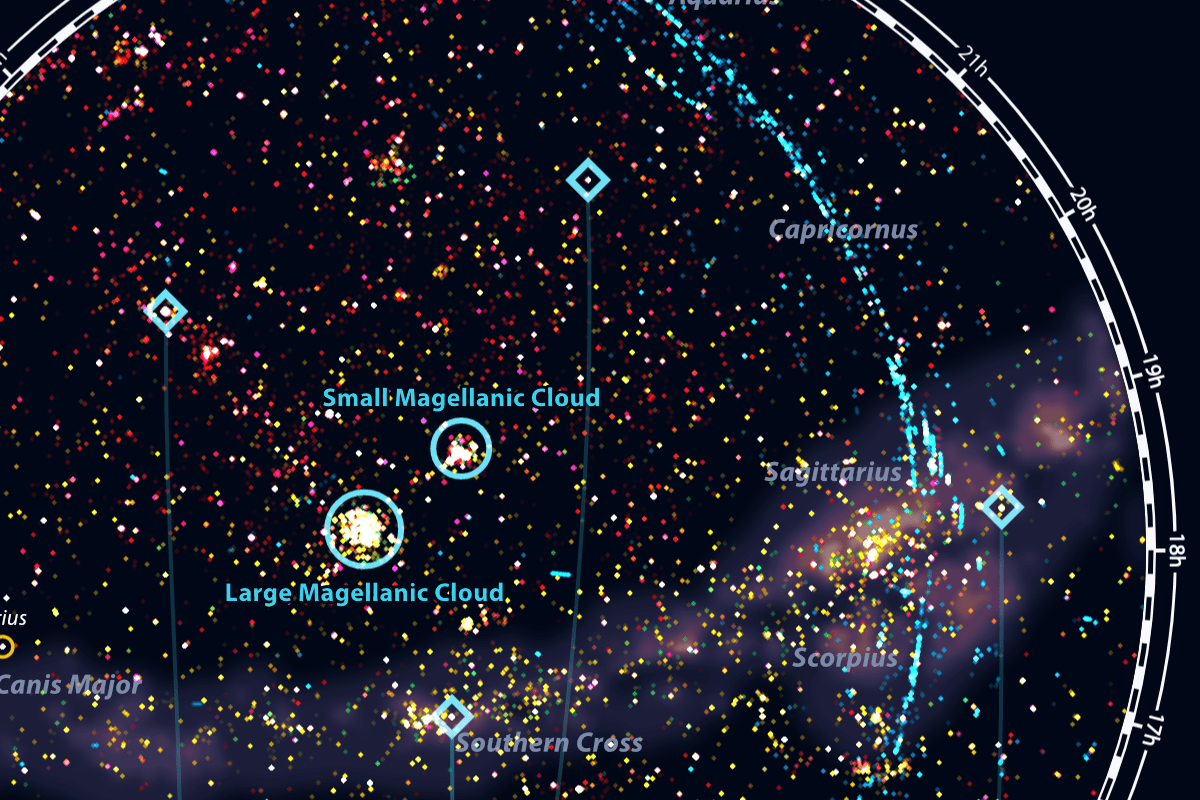
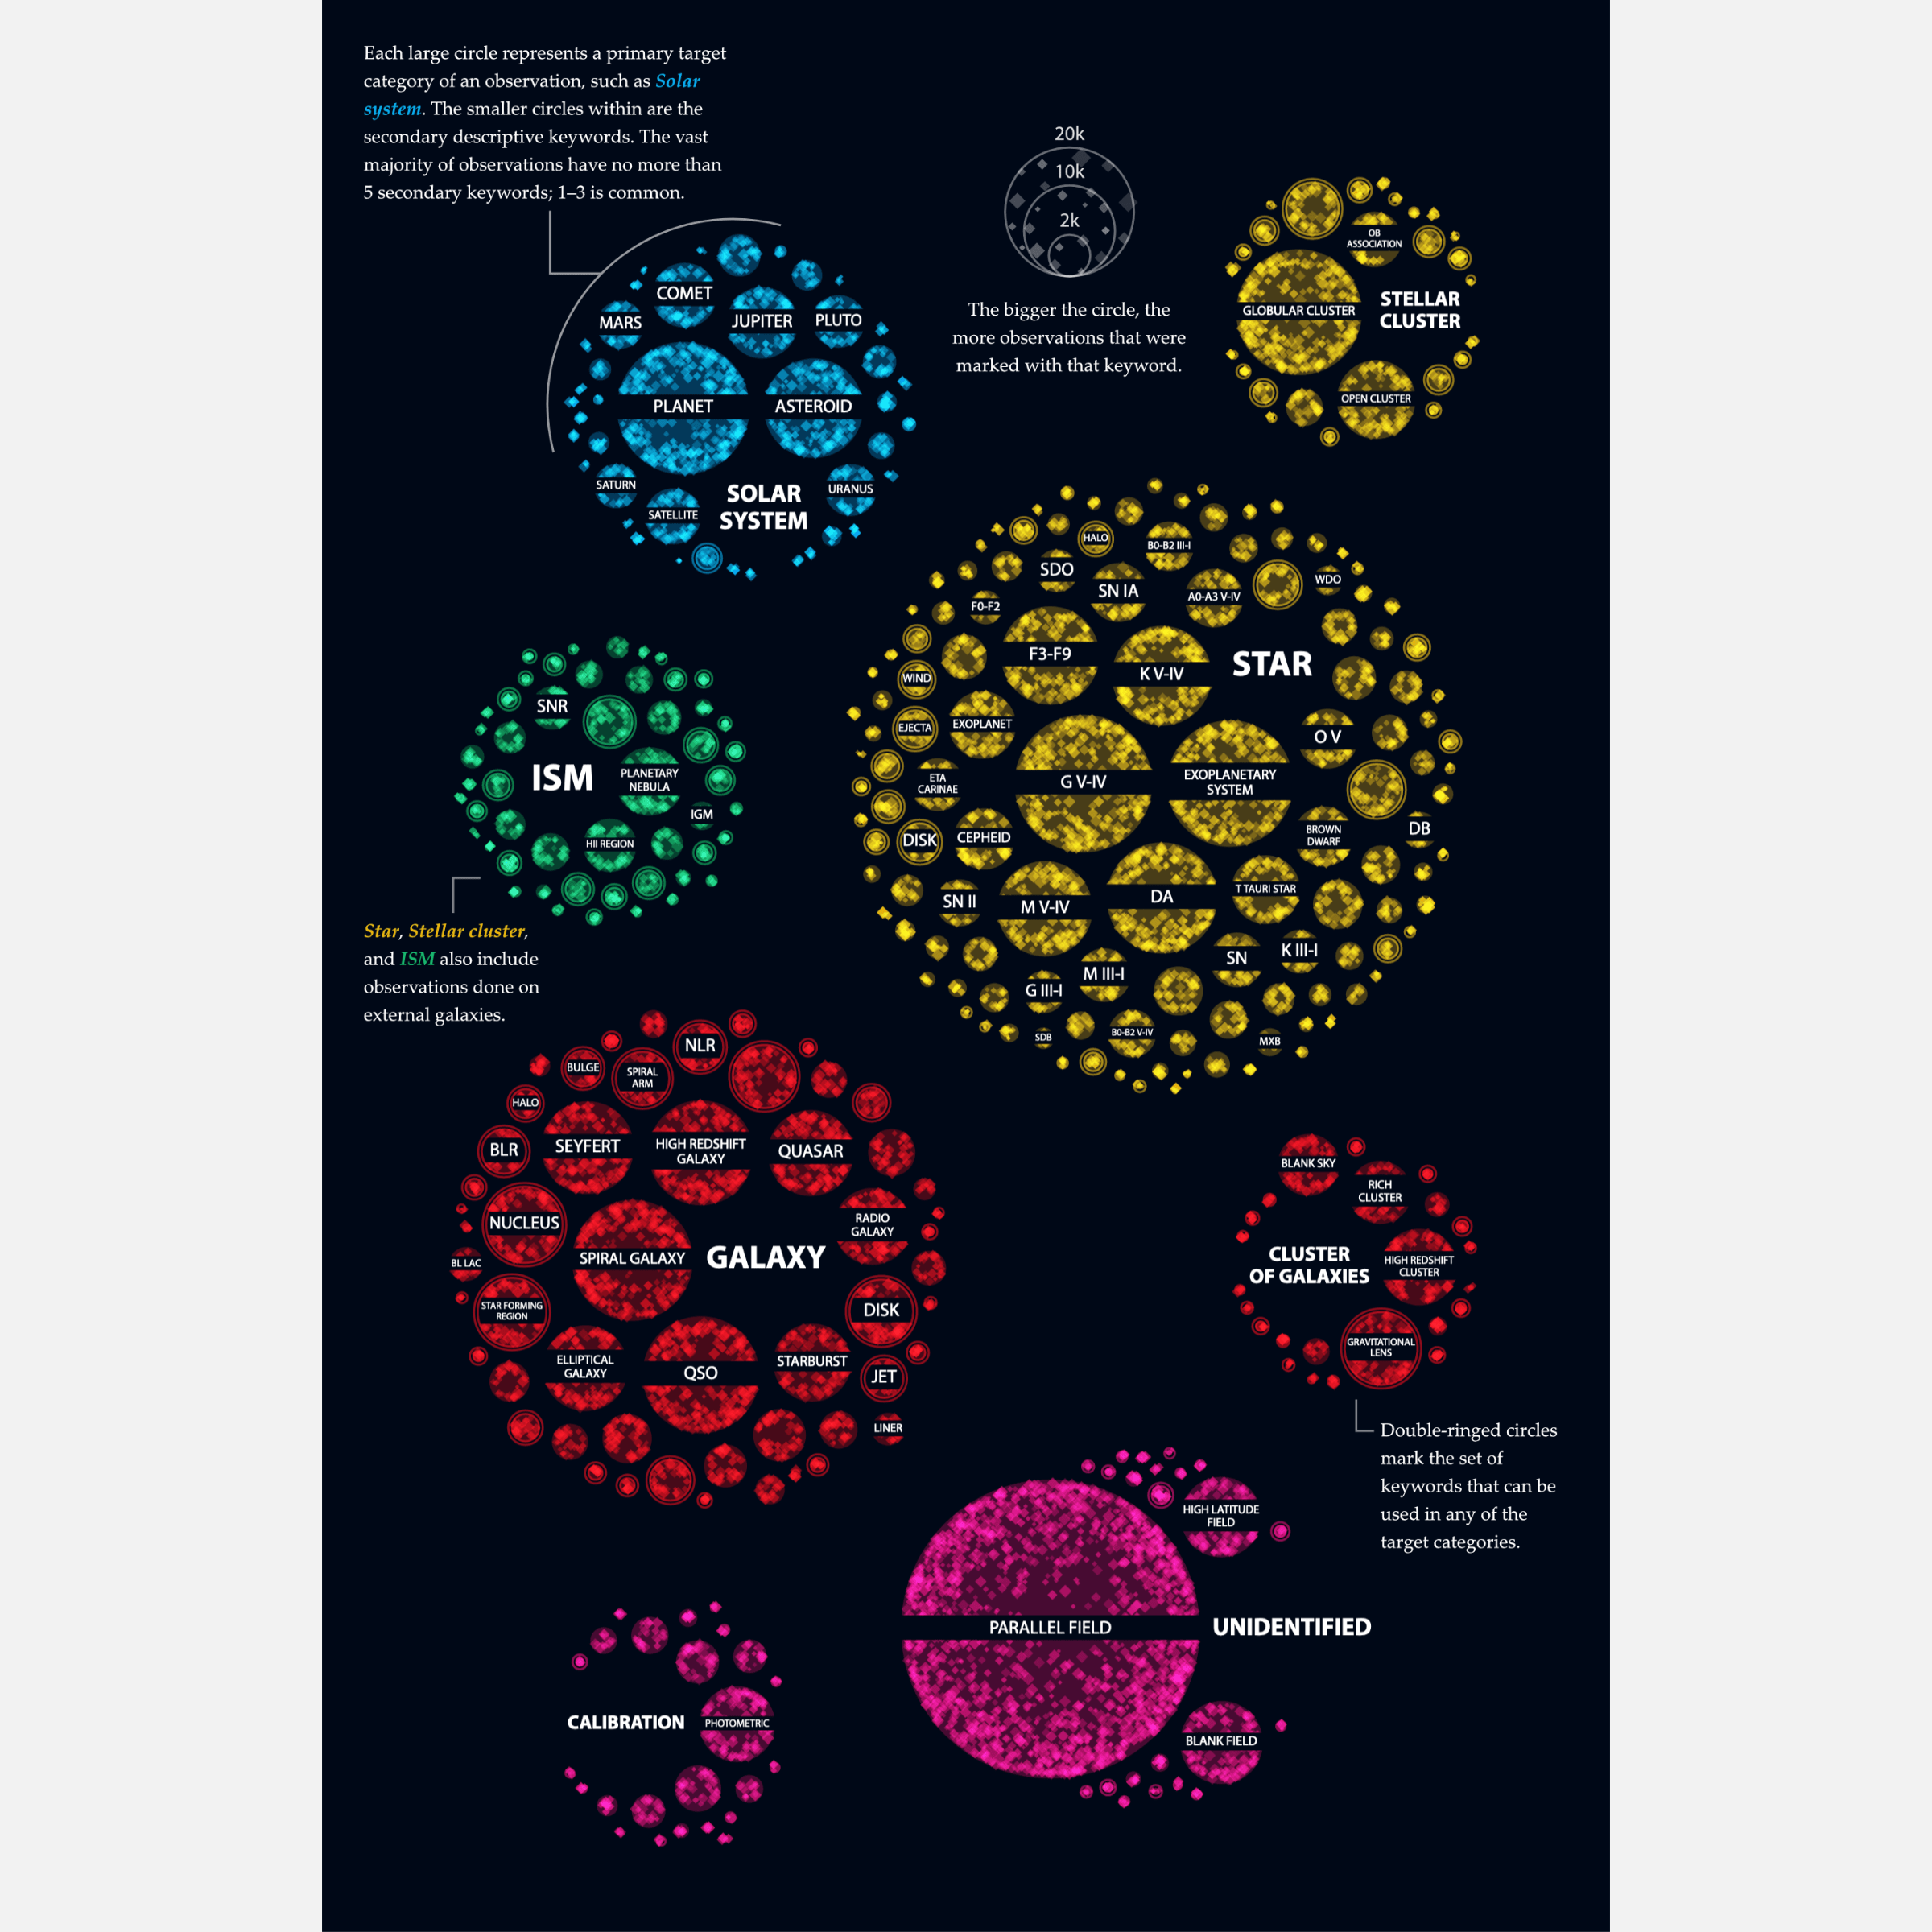
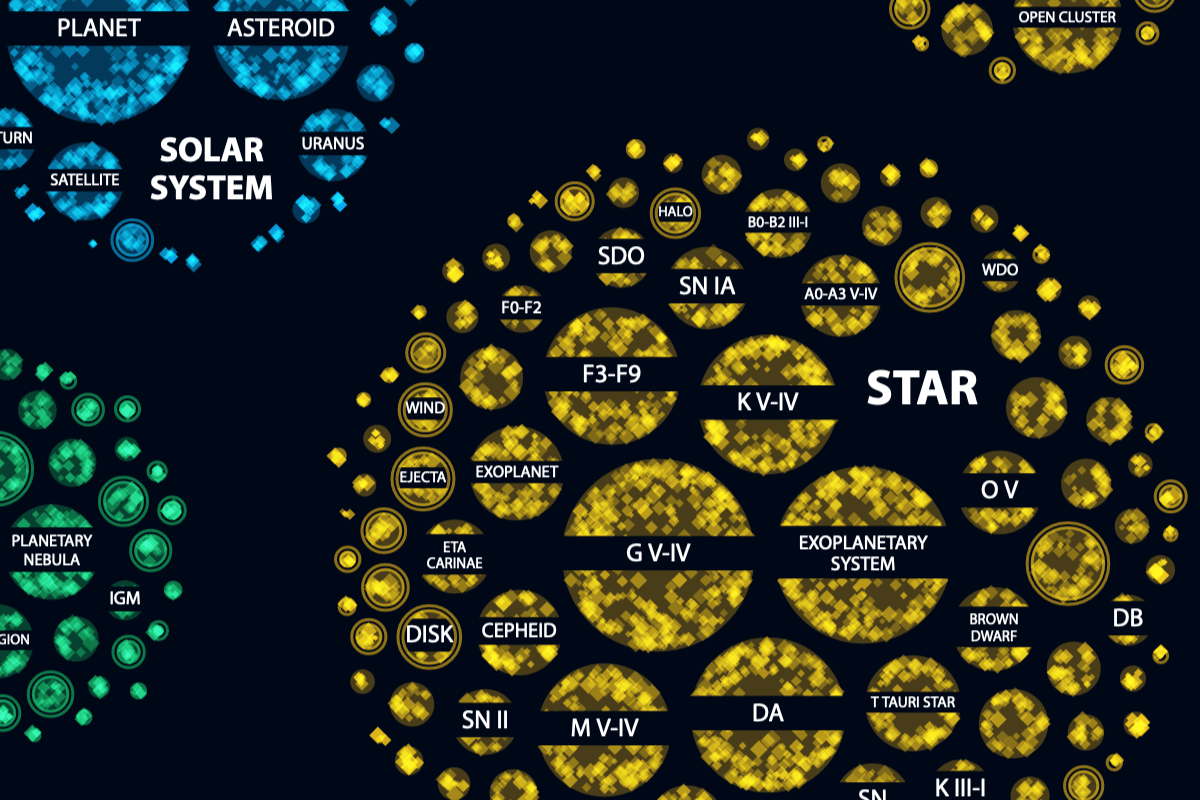
I performed an extensive cleaning and analysis of the >550k observations and discussed the possible visualization ideas. We settled on making two visuals; a main one that would plot all of Hubble’s observations in the sky. To help people understand where some of Hubble’s most famous photos have actually been taken. And a second visual that would reveal what the main targets are that Hubble has observed, from supernova to interacting galaxies, gravitational lenses and more.
I’ve written two extensive blog posts that go into the creation of the main sky map and the target classification visual.