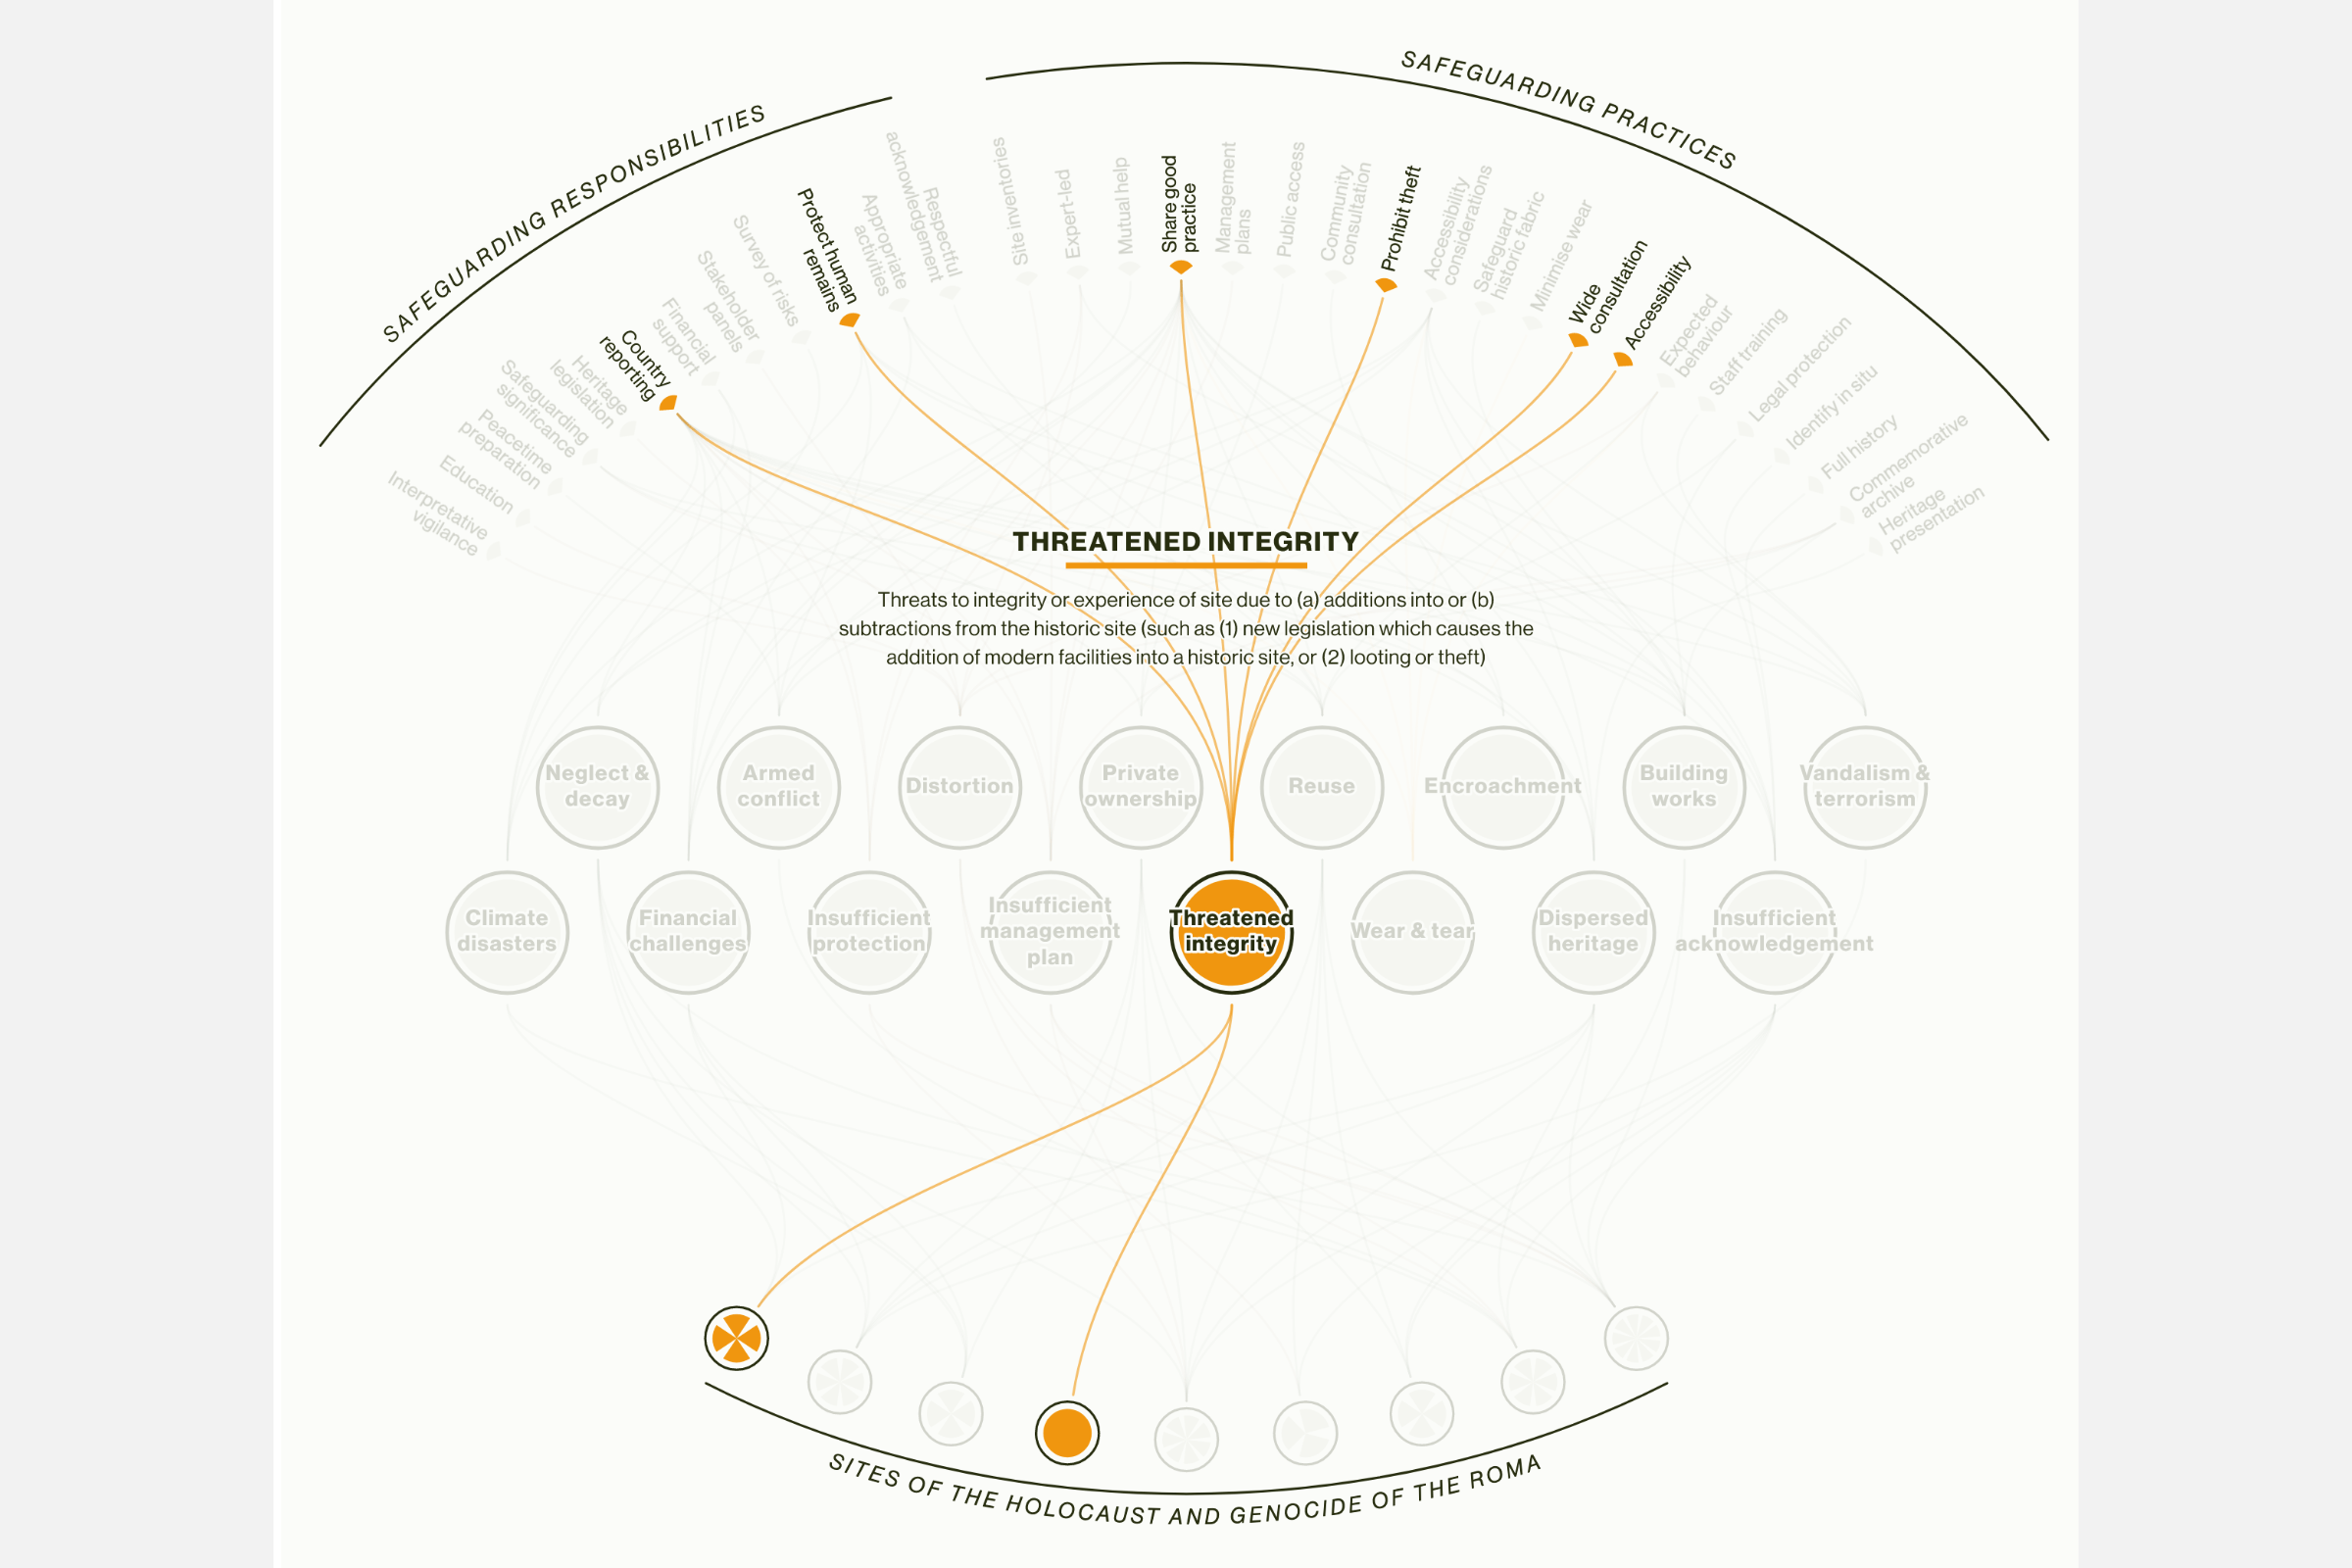
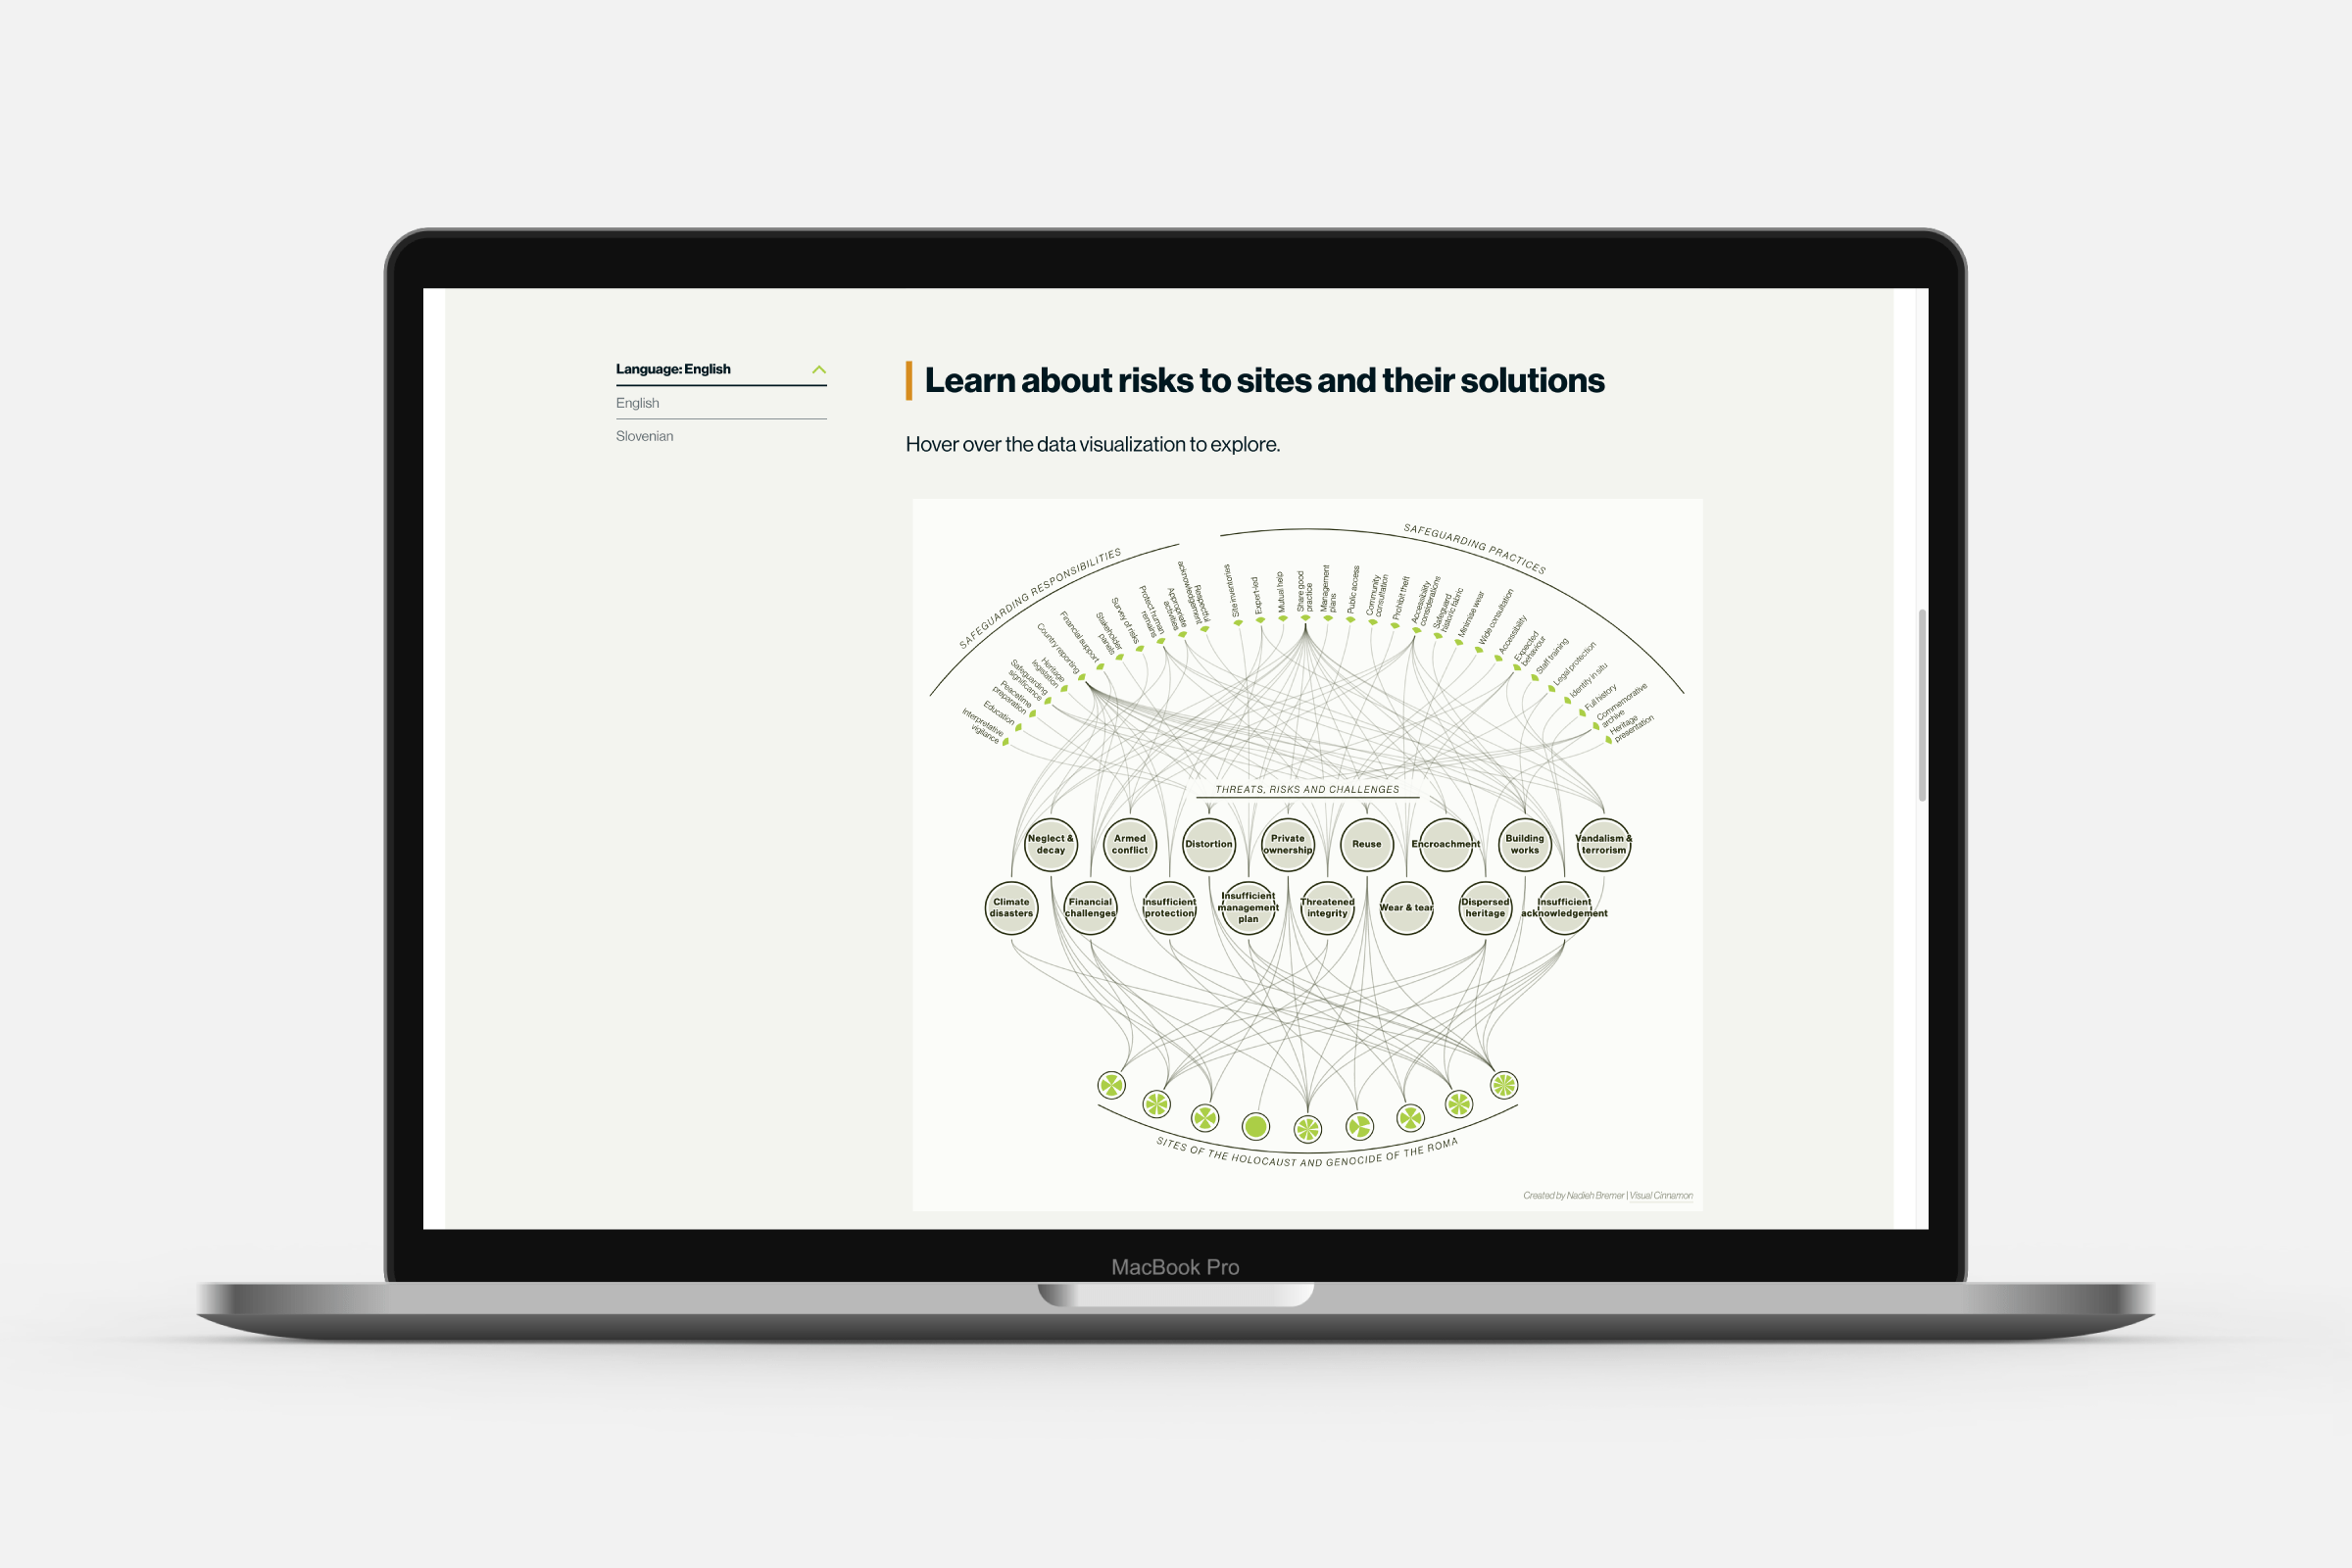
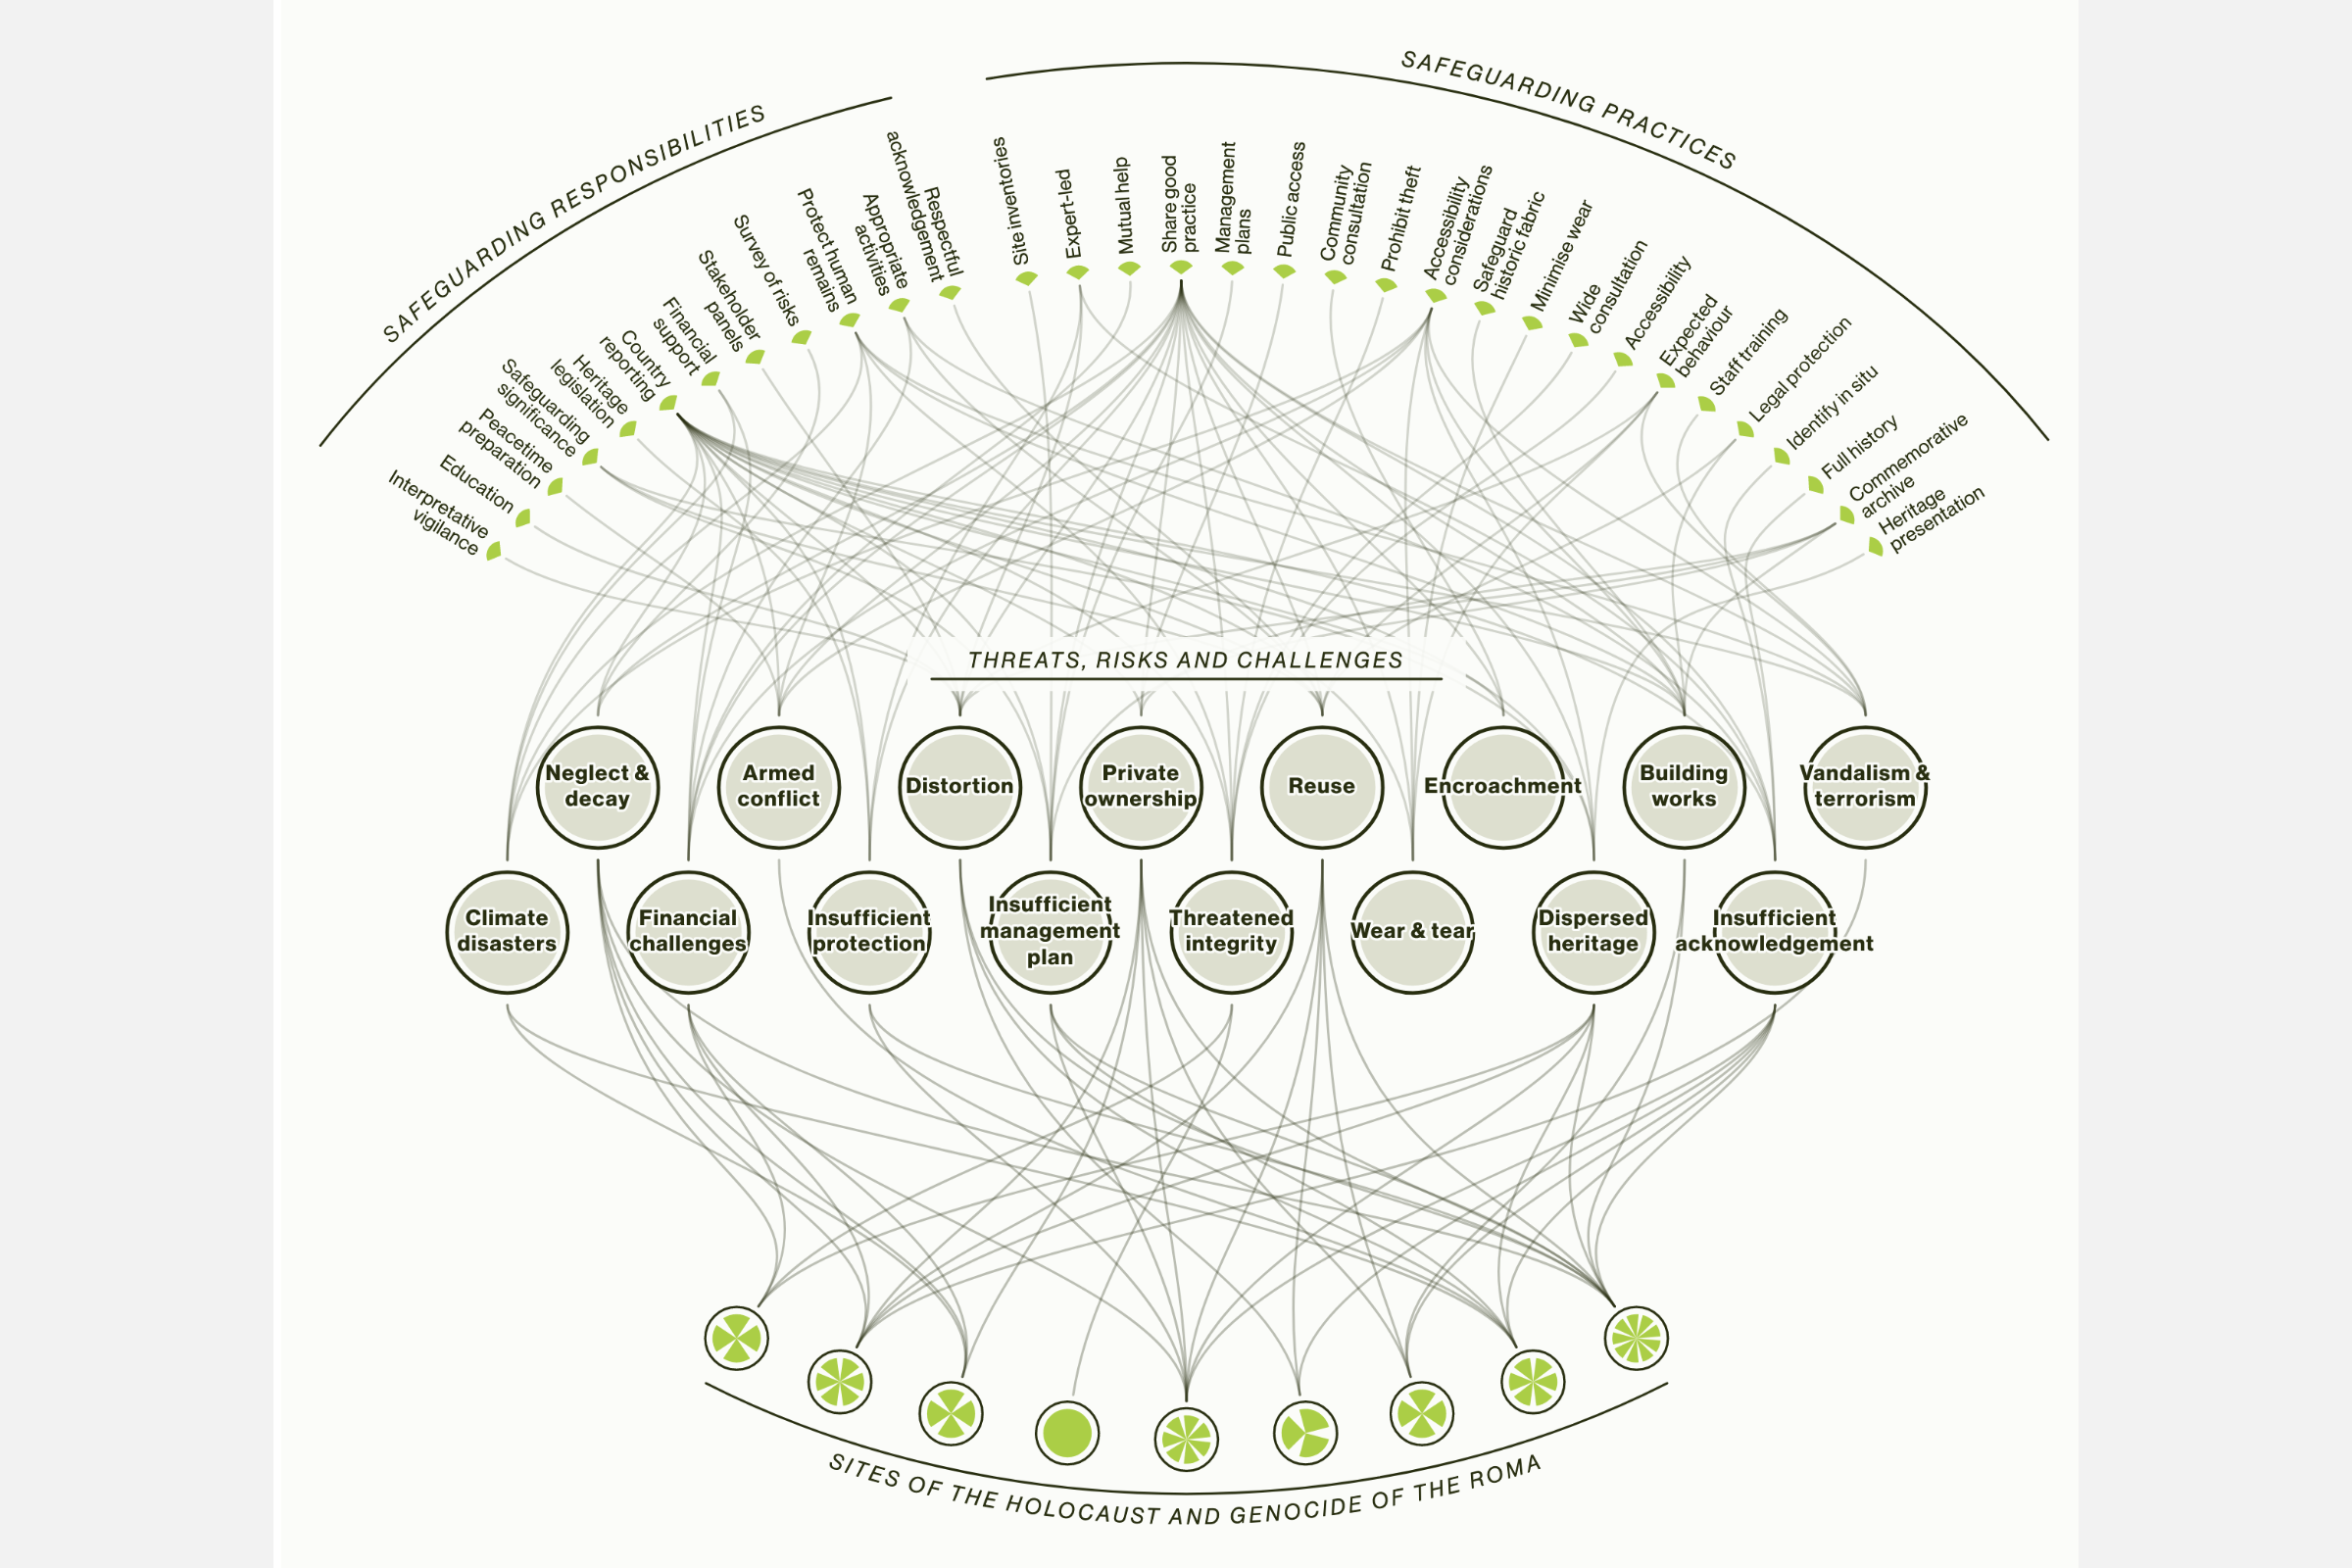
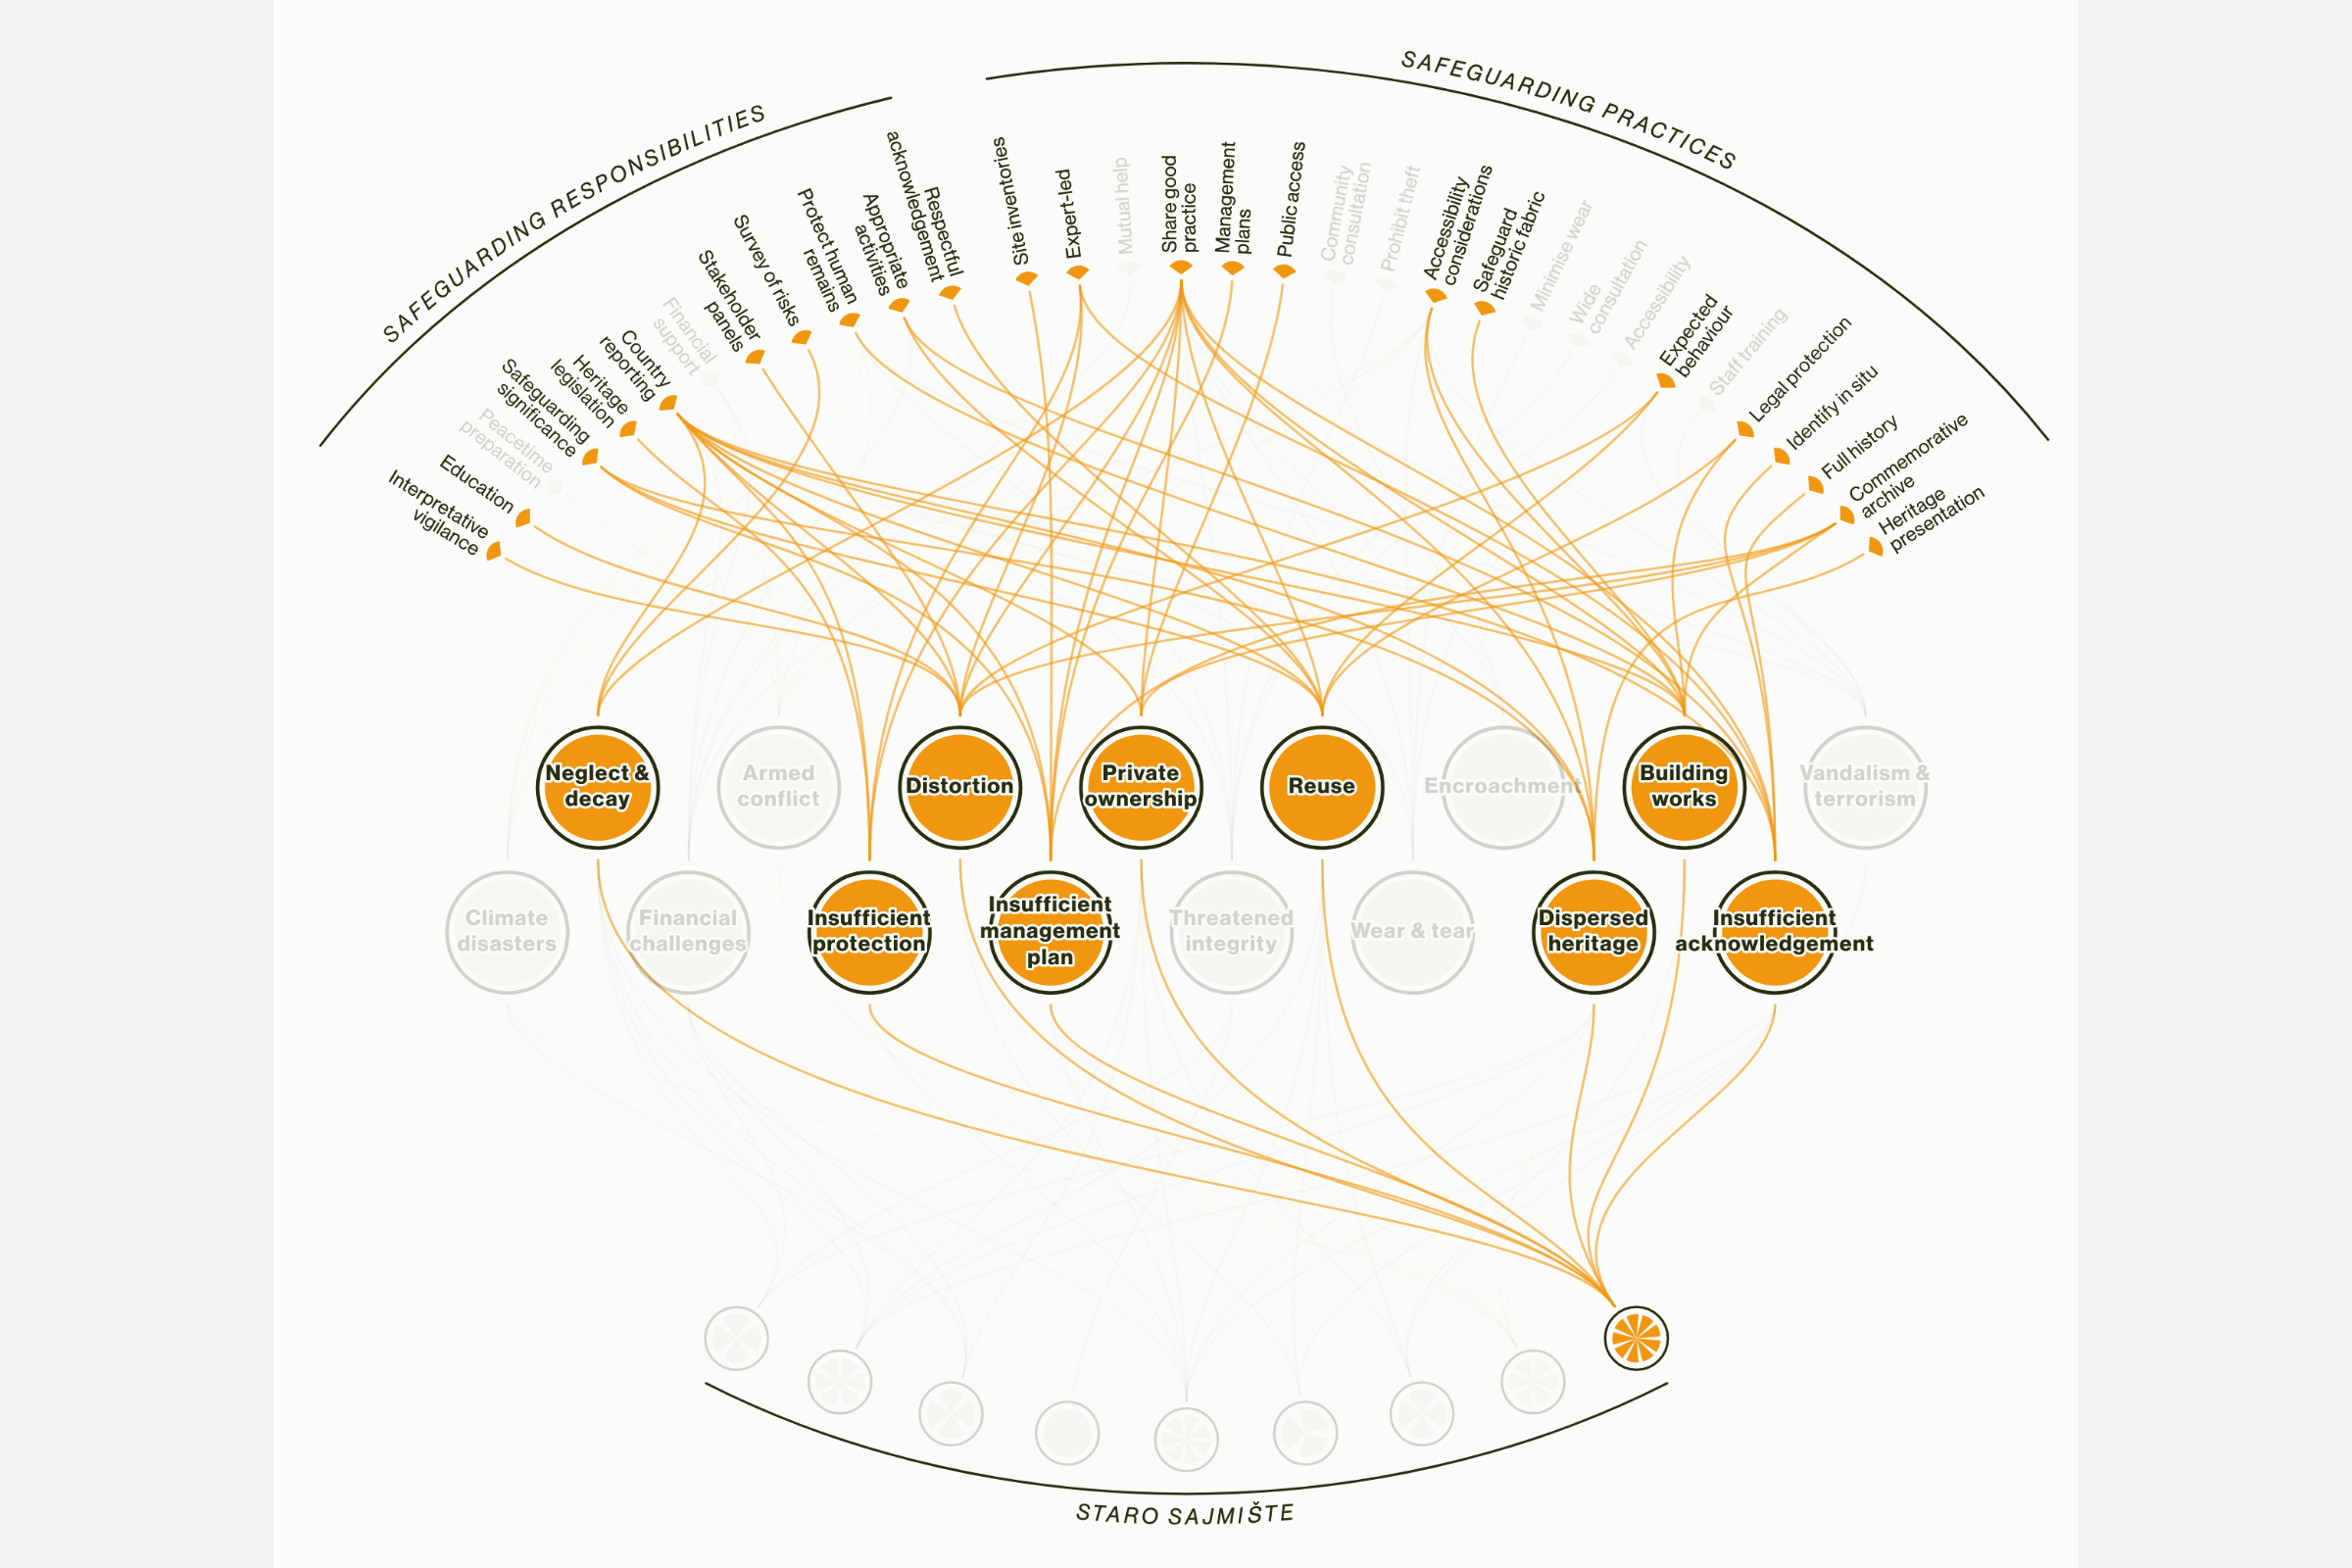
For the release of the “Charter for Safeguarding Sites” by the International Holocaust Remembrance Alliance (IHRA) I created an interactive data visualization that reveals the sixteen threats, risks and challenges outlined in the Charter and how different Holocaust sites are facing different combinations of these threats. The Charter also proposes many solutions to these threats. By hovering over any threat or site, the visual reveals what solutions can help to mitigate the threats. The visual also has the capability of handling up to ±80 more sites, which will automatically get spread out along the bottom.
The fundamental design for this piece came from one of the visuals I created about UNESCO’s Intangible Cultural Heritage, specifically to show the threats facing some of them. However, since each dataset is unique, I customized the visual design to fit with this different dataset, the new brand guidelines of IHRA, while also being respectful of the data representing various Holocaust sites.
Nine different sites were used for the release of the visualization, with the hope that other sites would want to be presented as well, and share their information with IHRA. I added a functionality that would automatically pick up any additional sites added to the dataset and spread them out along the bottom of the visual. This way the visual can grow to include up to ±80 sites without any additional (coding) work needed. To facilitate this, I also wrote documentation and showed the team at IHRA how they could easily add new sites to the data.
*image on the right: Jasenovac