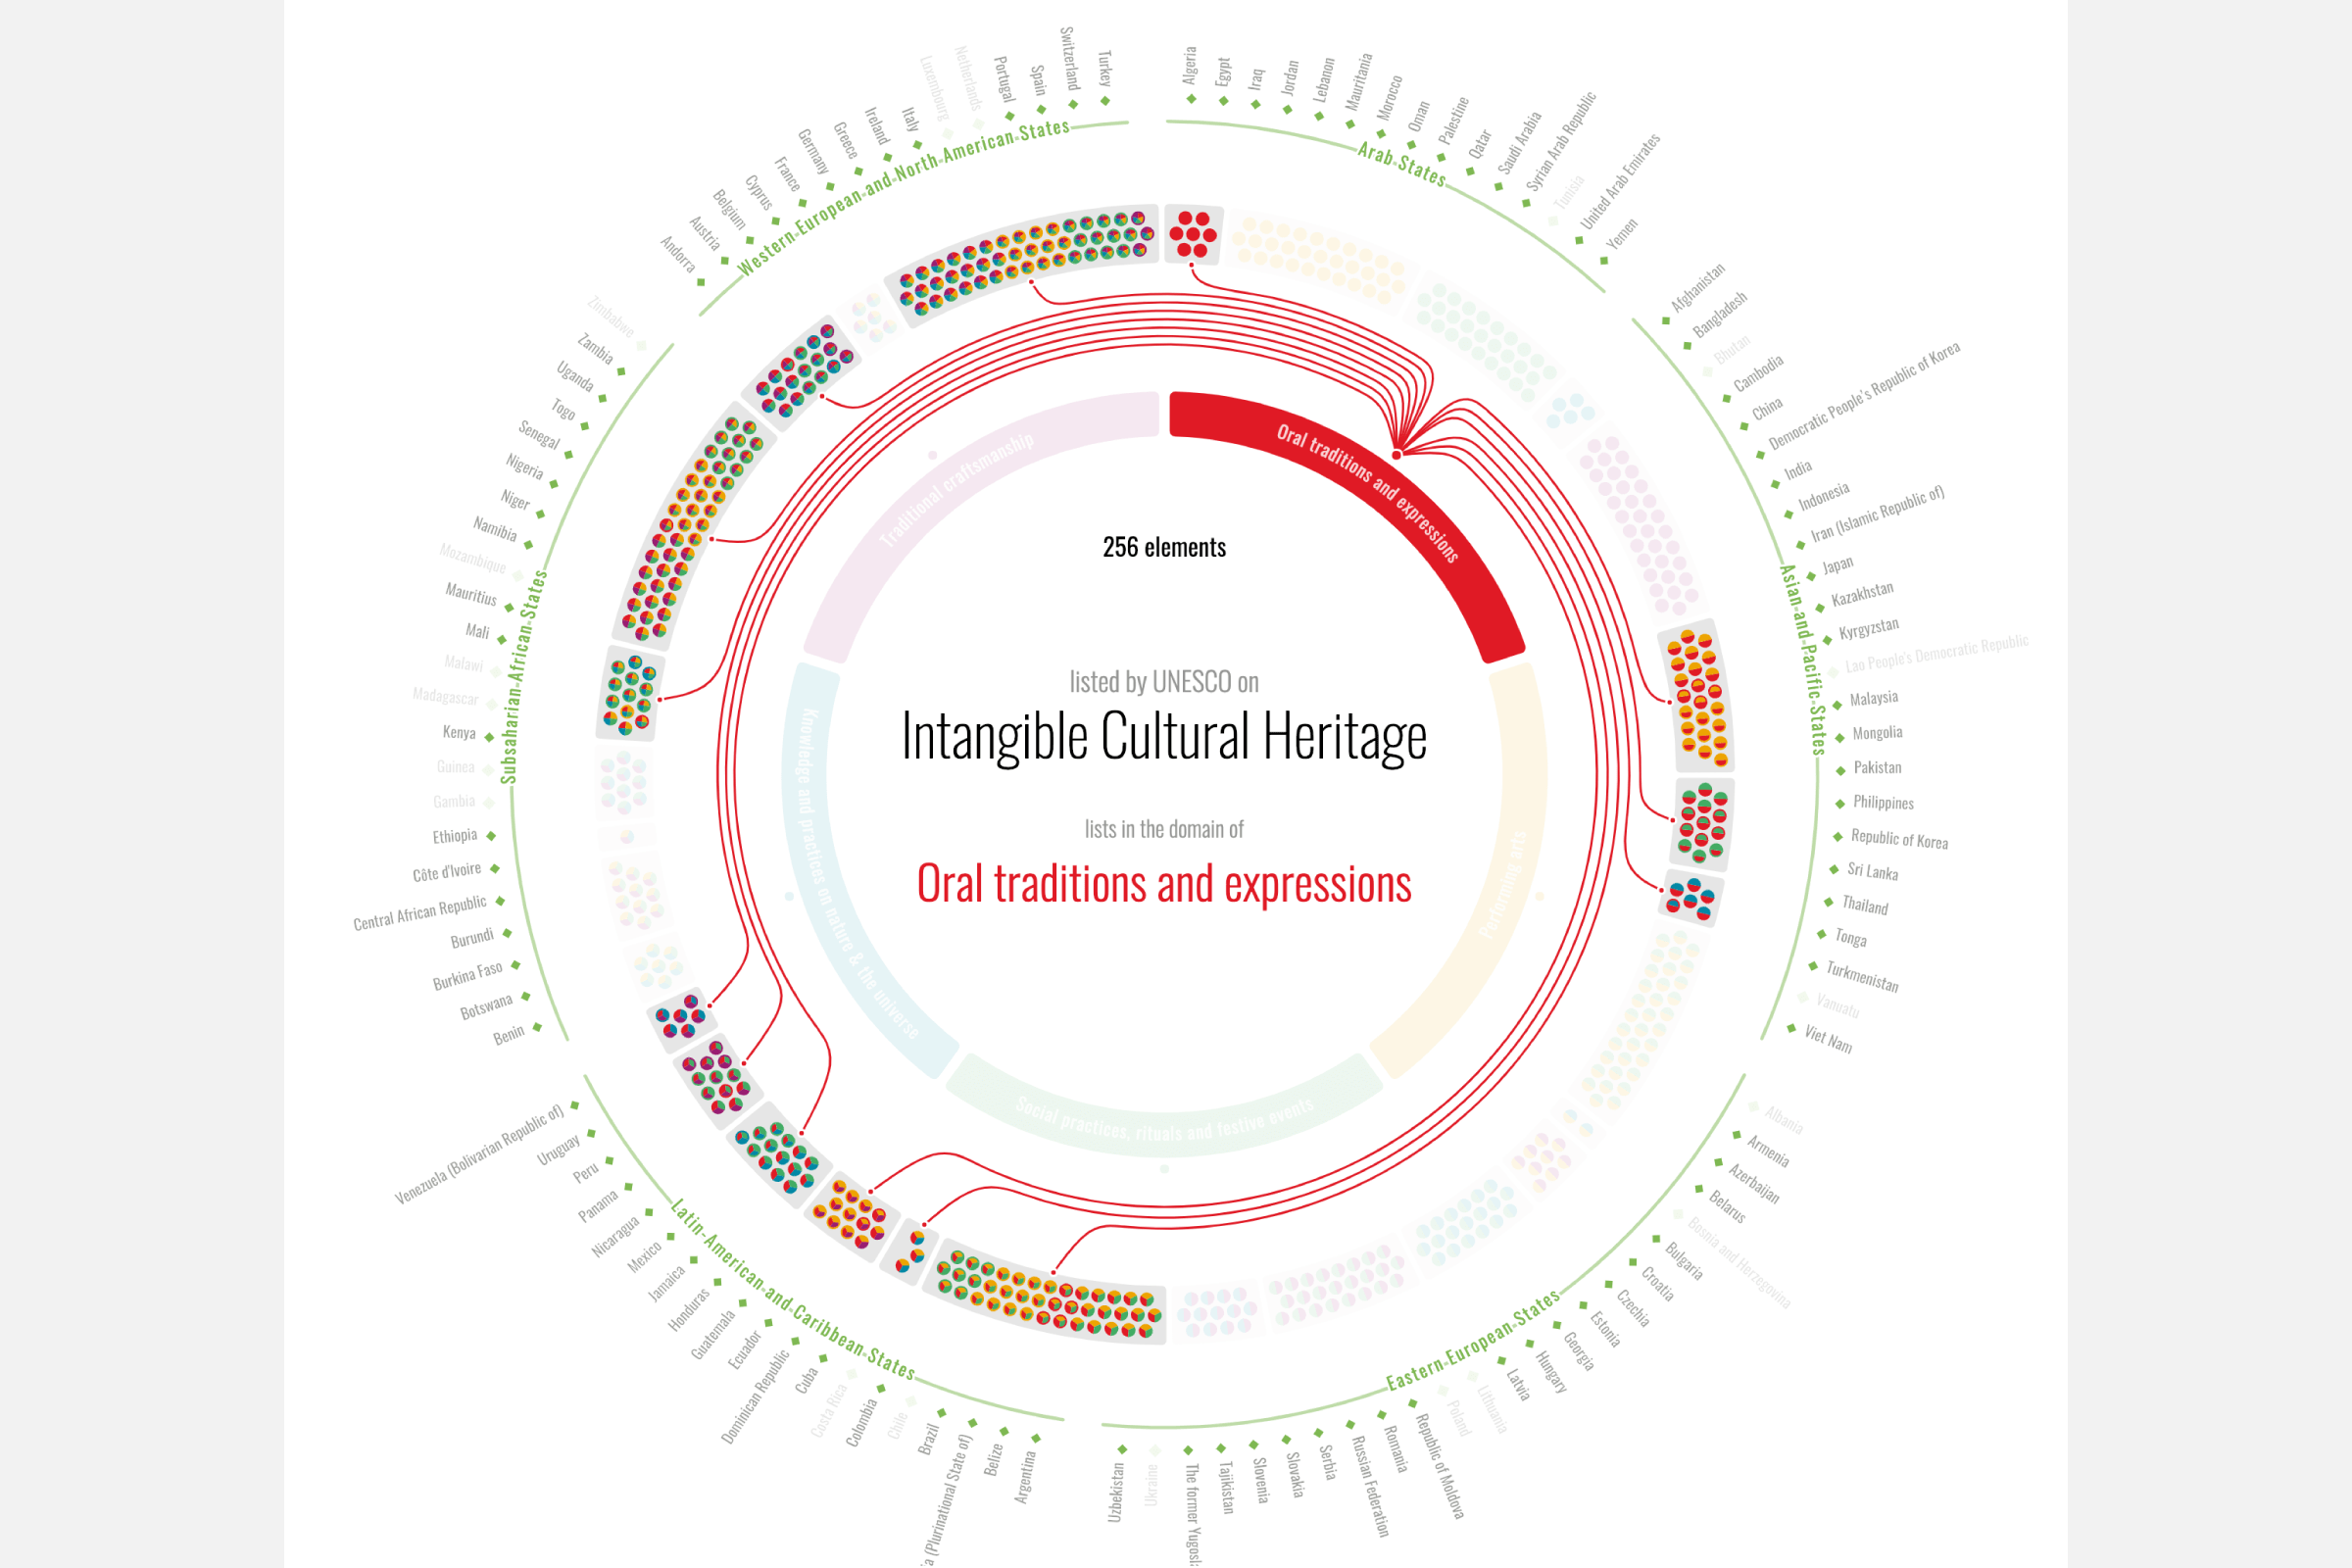
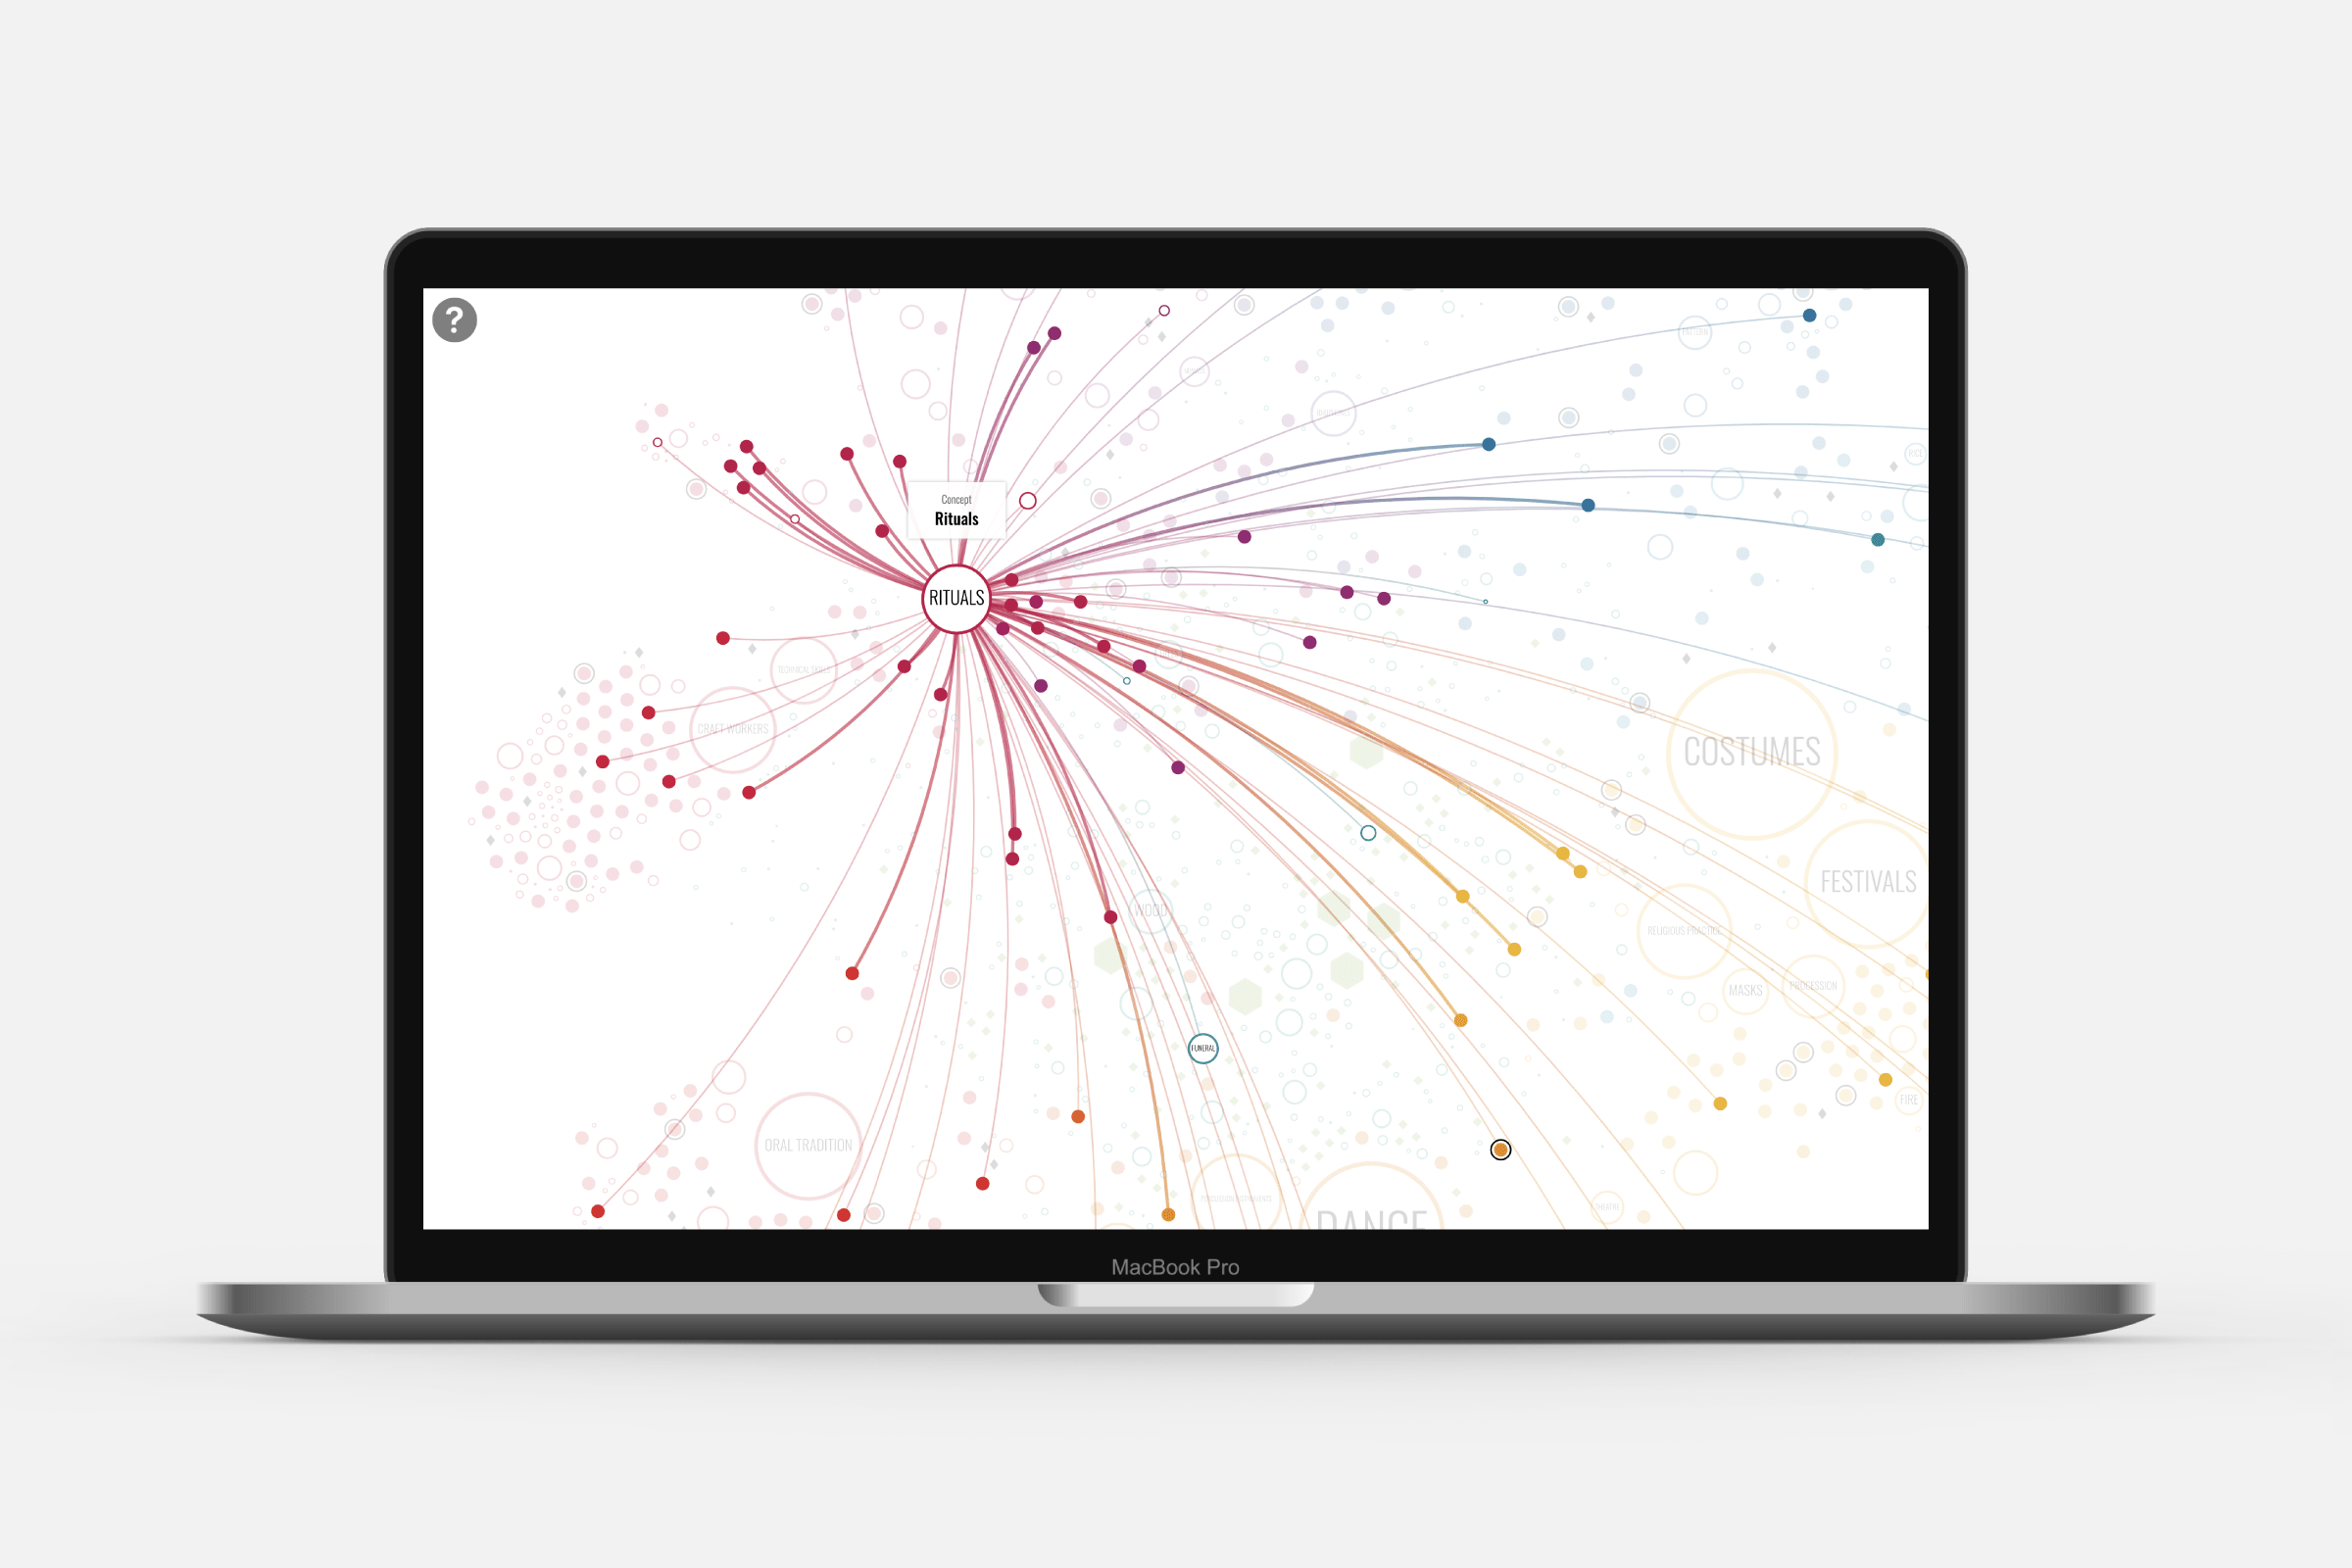
Since 2003 UNESCO safeguards an ever growing list of our Intangible Cultural Heritage and these days there are almost 500 unique cultural elements inscribed on the list. Four interactive and unique visuals help people understand and discover their cultural heritage, and how this is connected to other cultures through connections such as regions, countries, World Heritage Sites and concepts such as Family, Trees, Dance, and more.
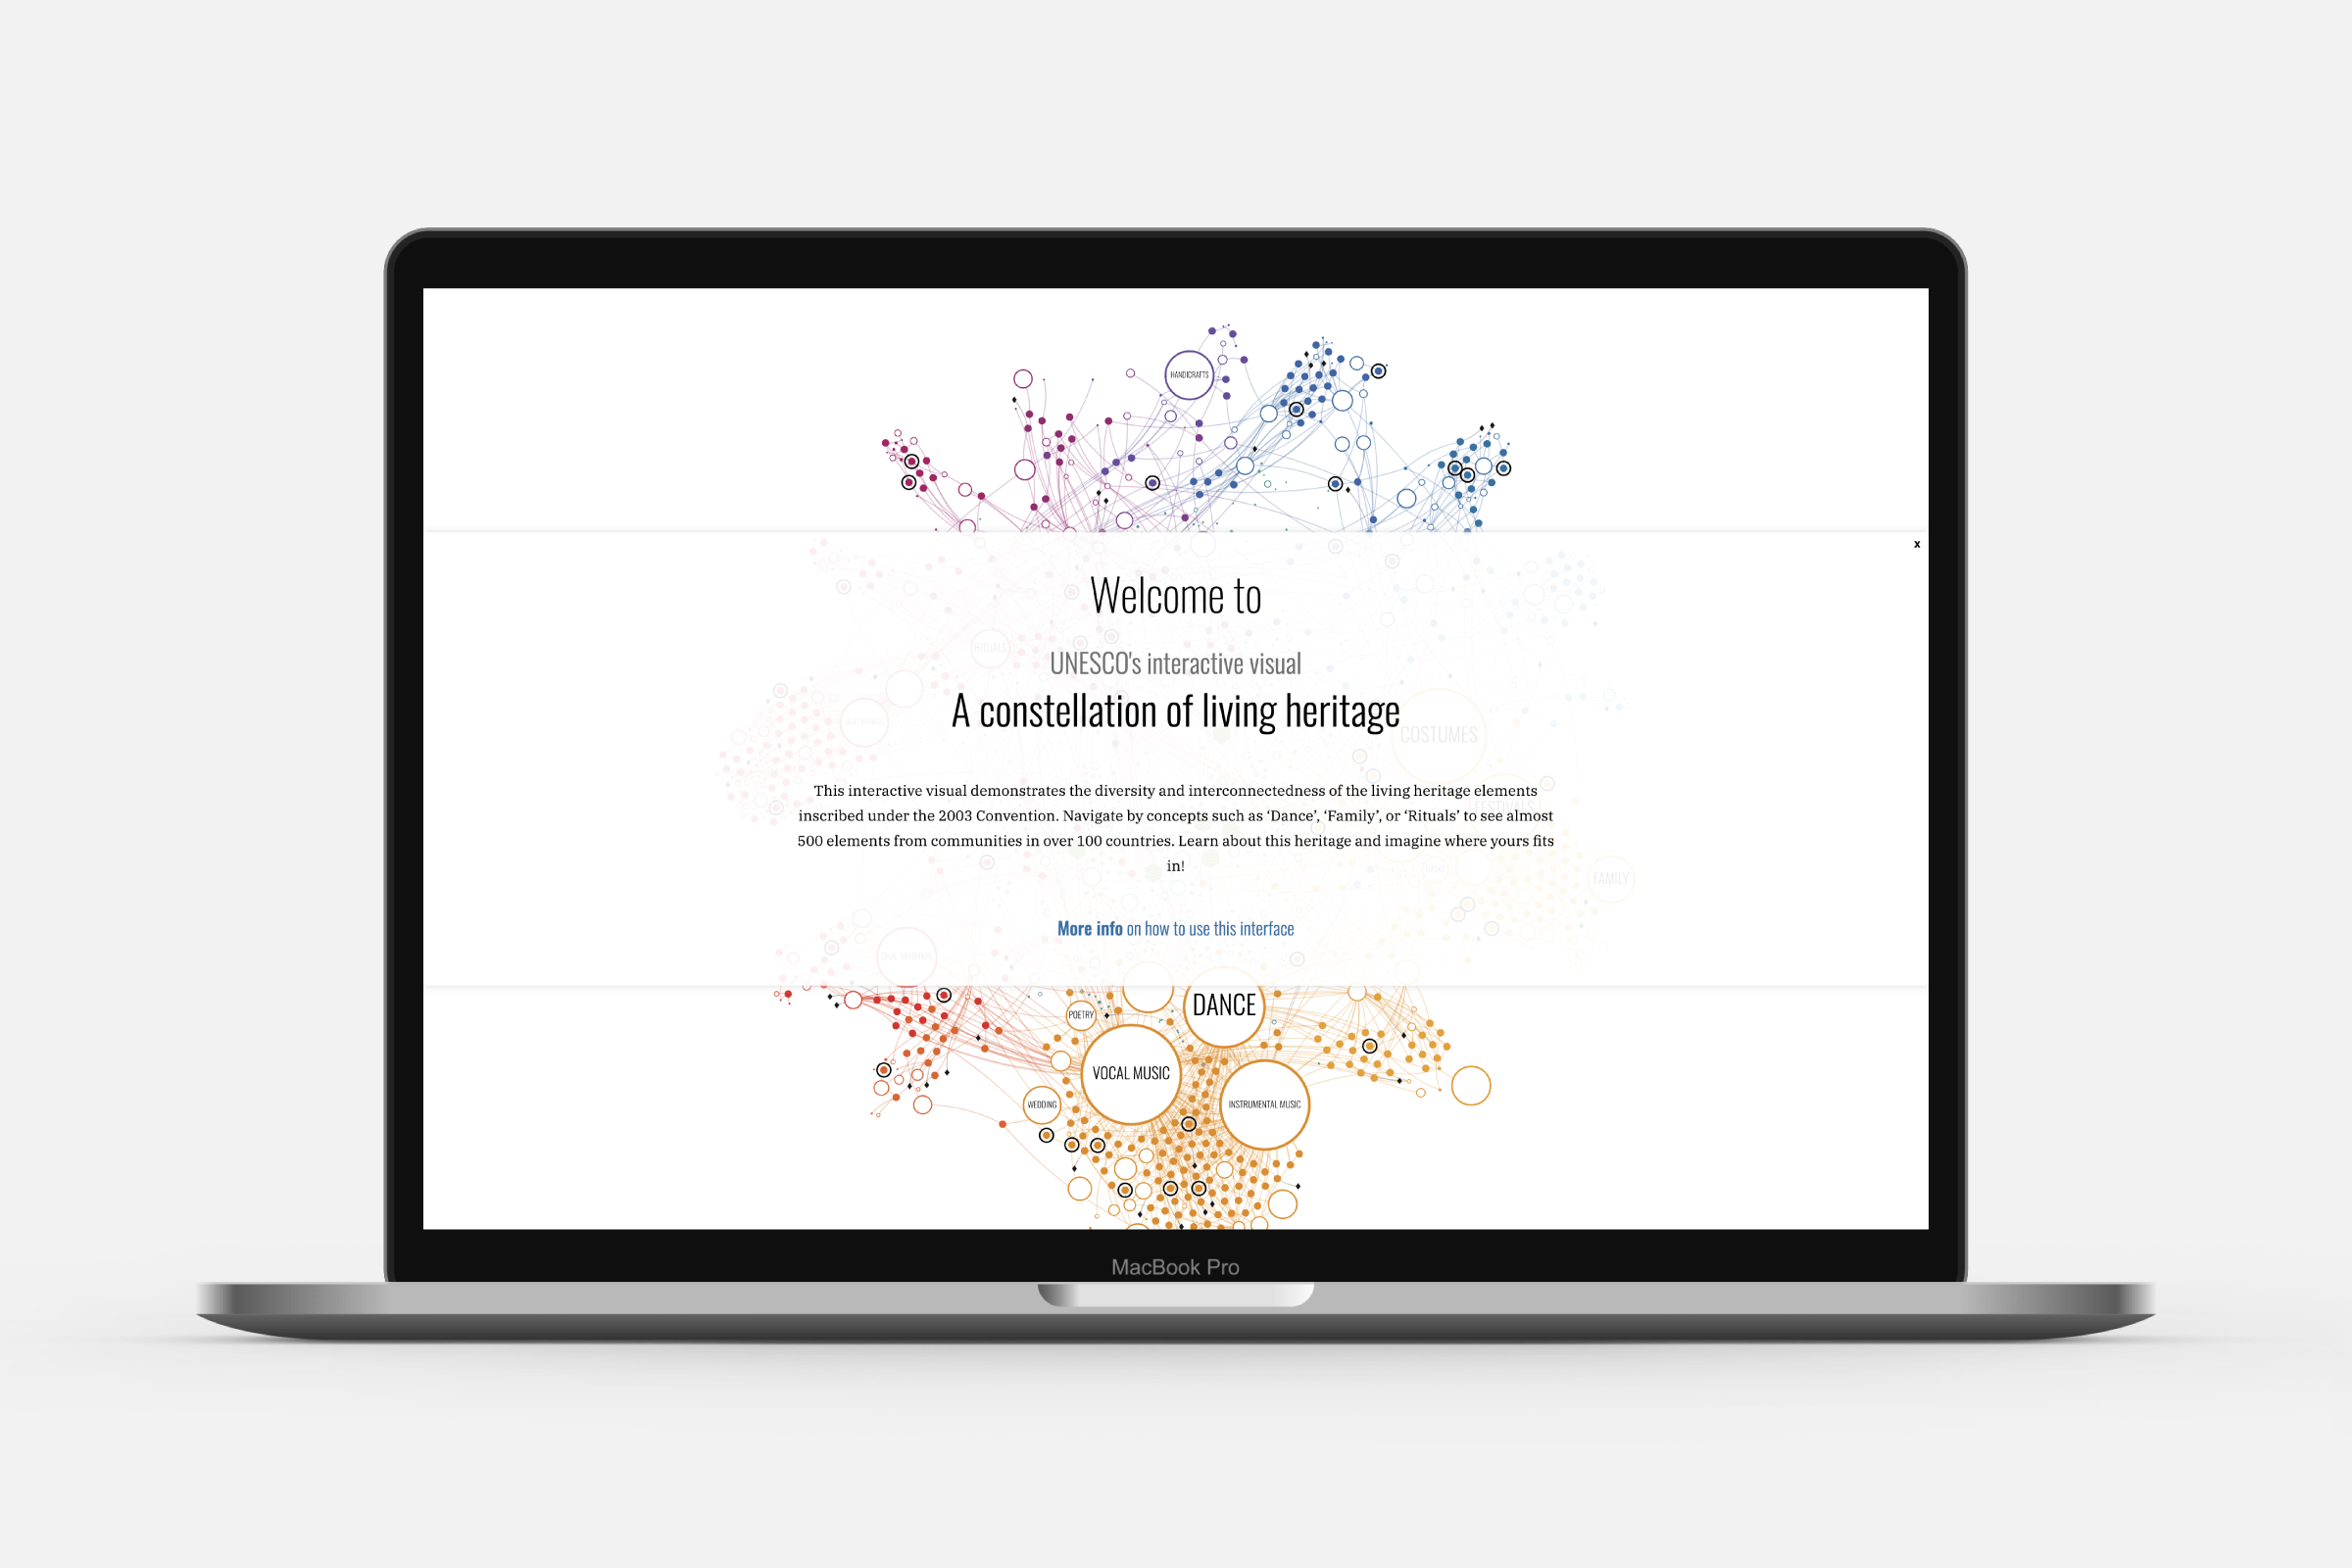
In March I was approached by UNESCO to help them visualize Intangible Cultural Heritage (ICH) in such as way as to help people understand the connections that exist between them. They had already been creating the data set of connections in the year before that.
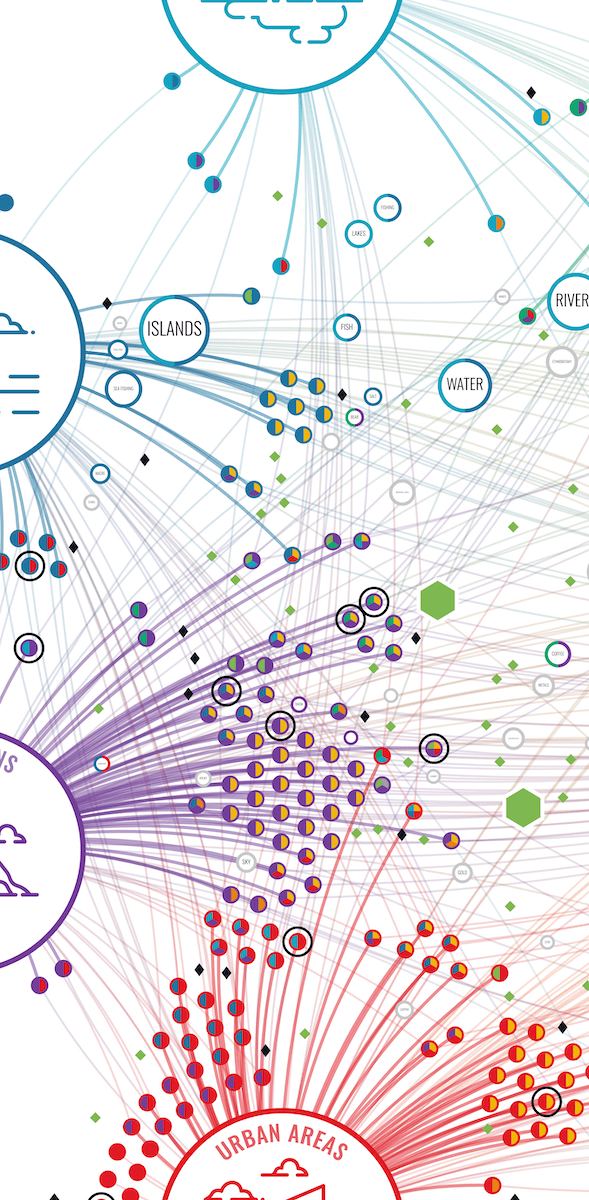
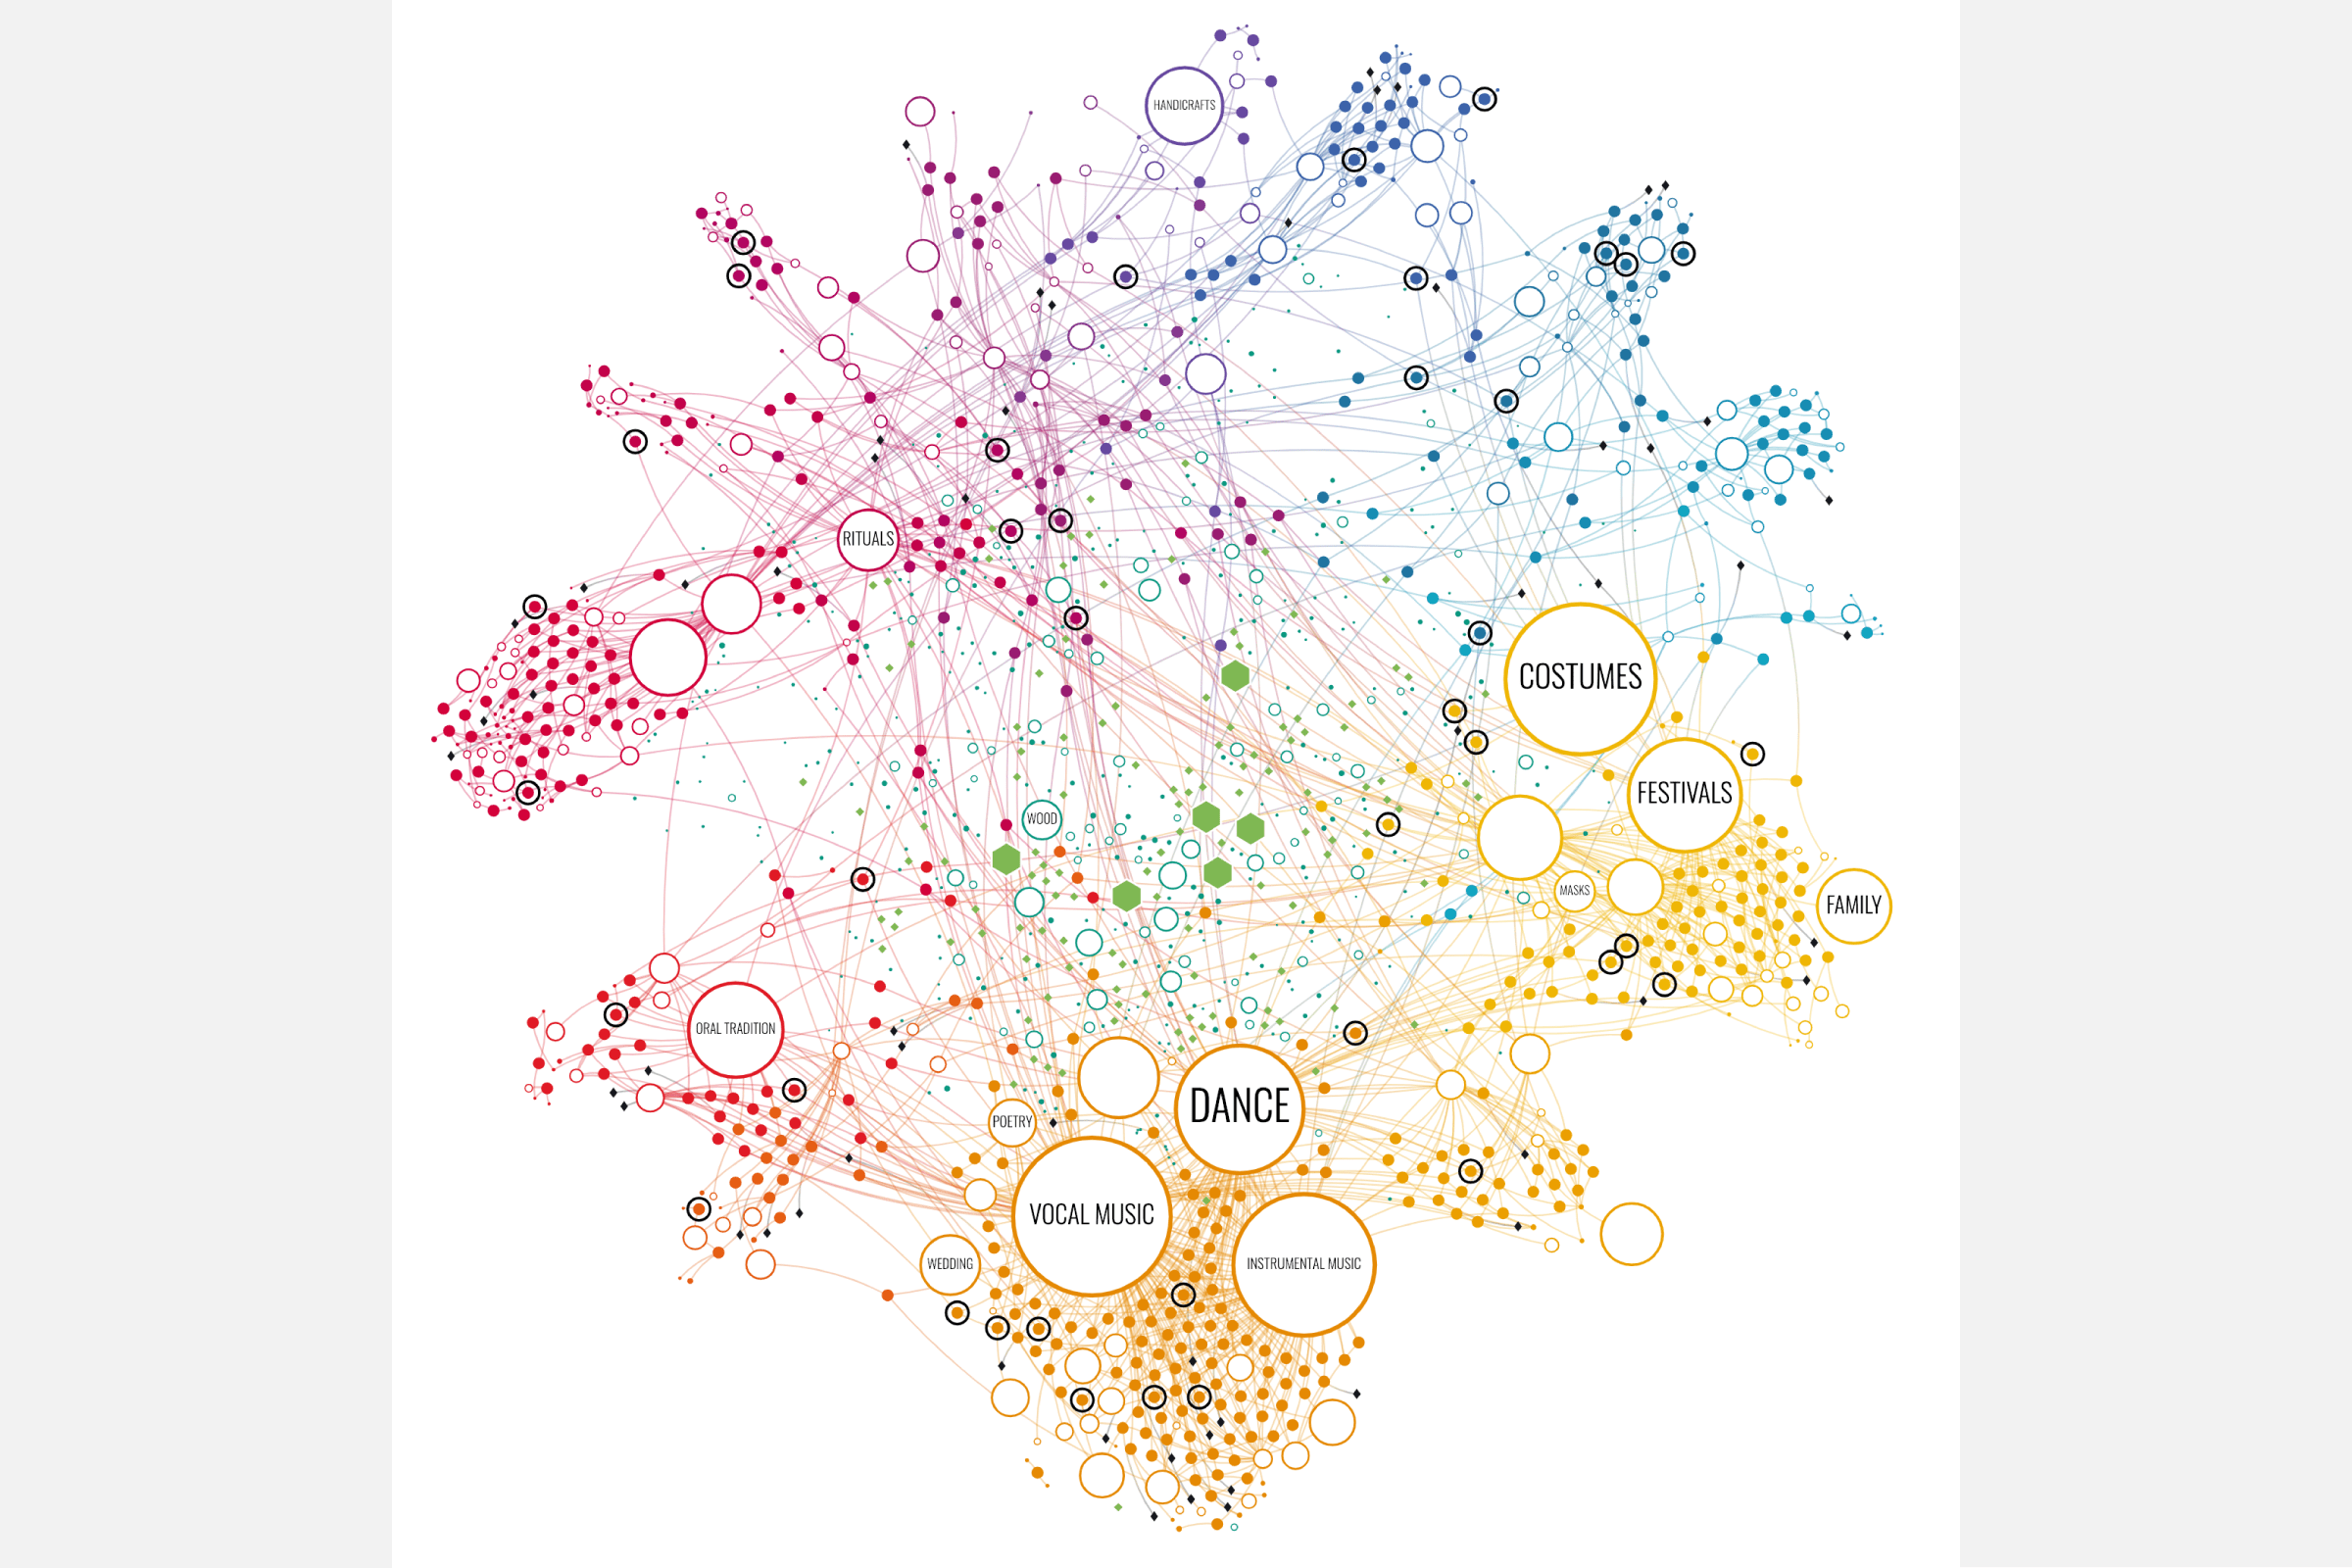
Starting with all of the data for the main visual, the Constellation, I had 2.000 elements available (ICH, countries, concepts, and more) and 15.000 connections between them. I therefore knew that I needed to “pull apart” this network in an intricate manner. After experimenting with different approaches, I found that combining a community-finding algorithm with a multi-step network set-up finally revealed an interesting layout that placed the elements in a visually appealing and sensible manner.
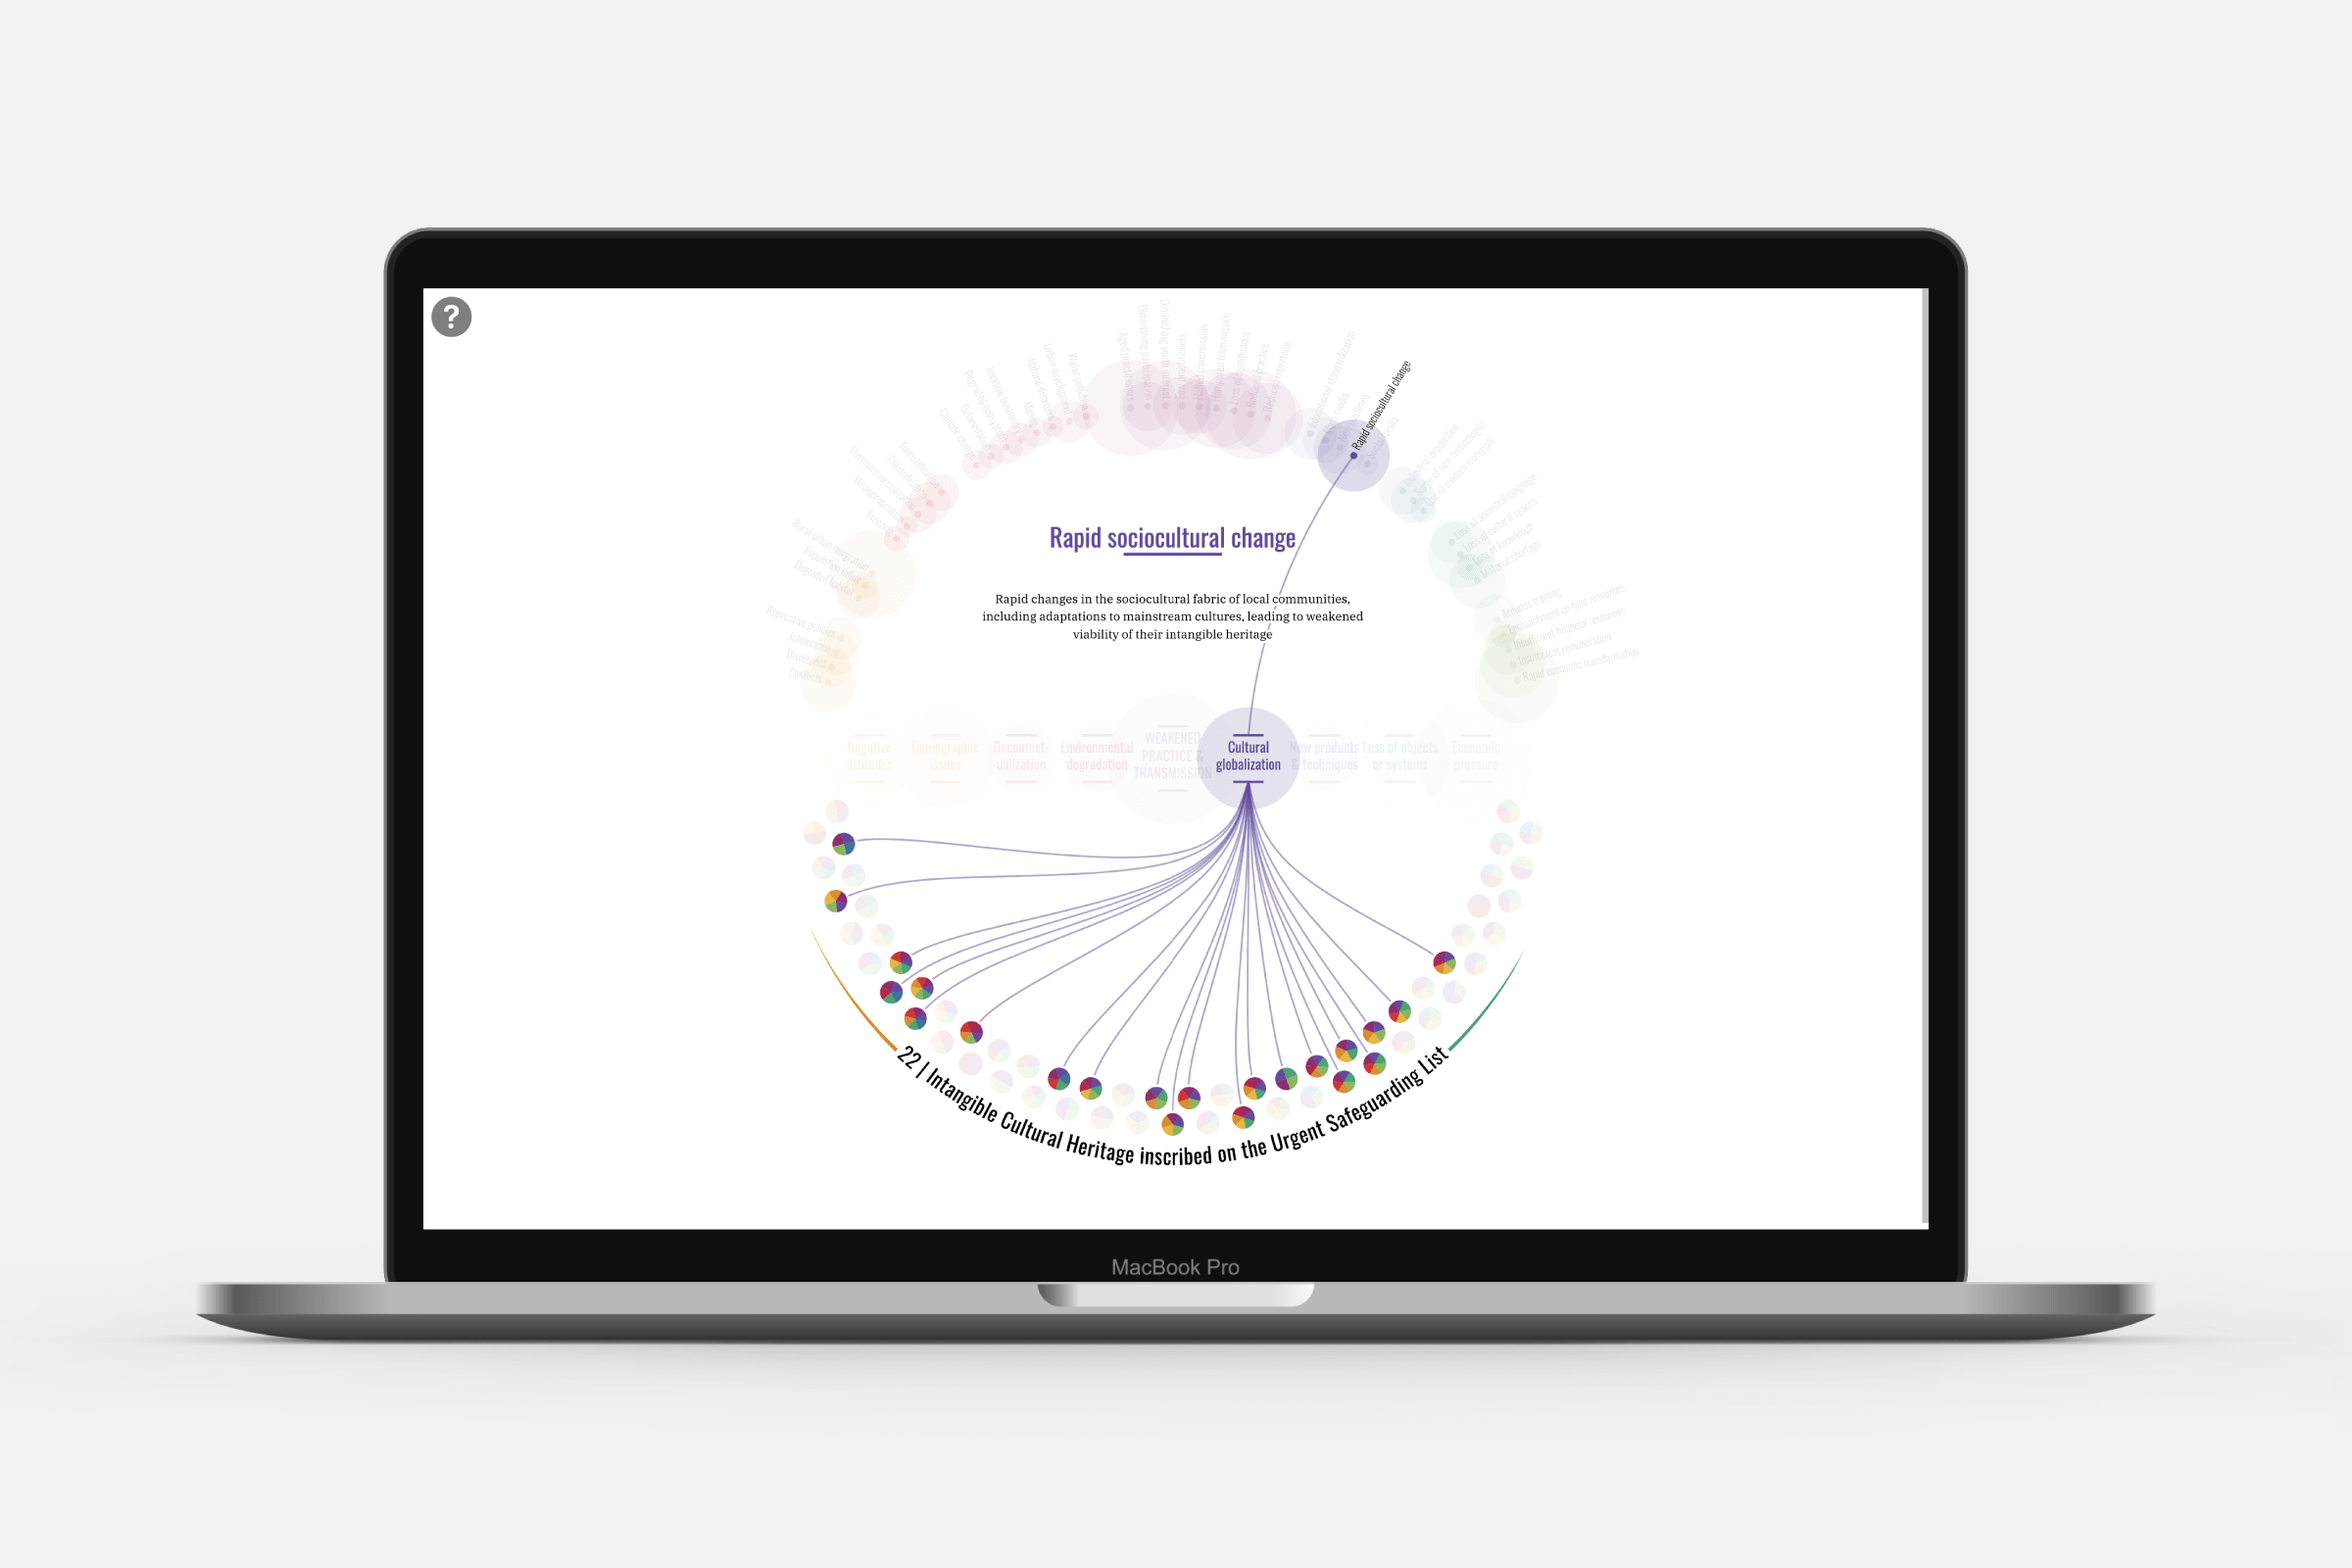
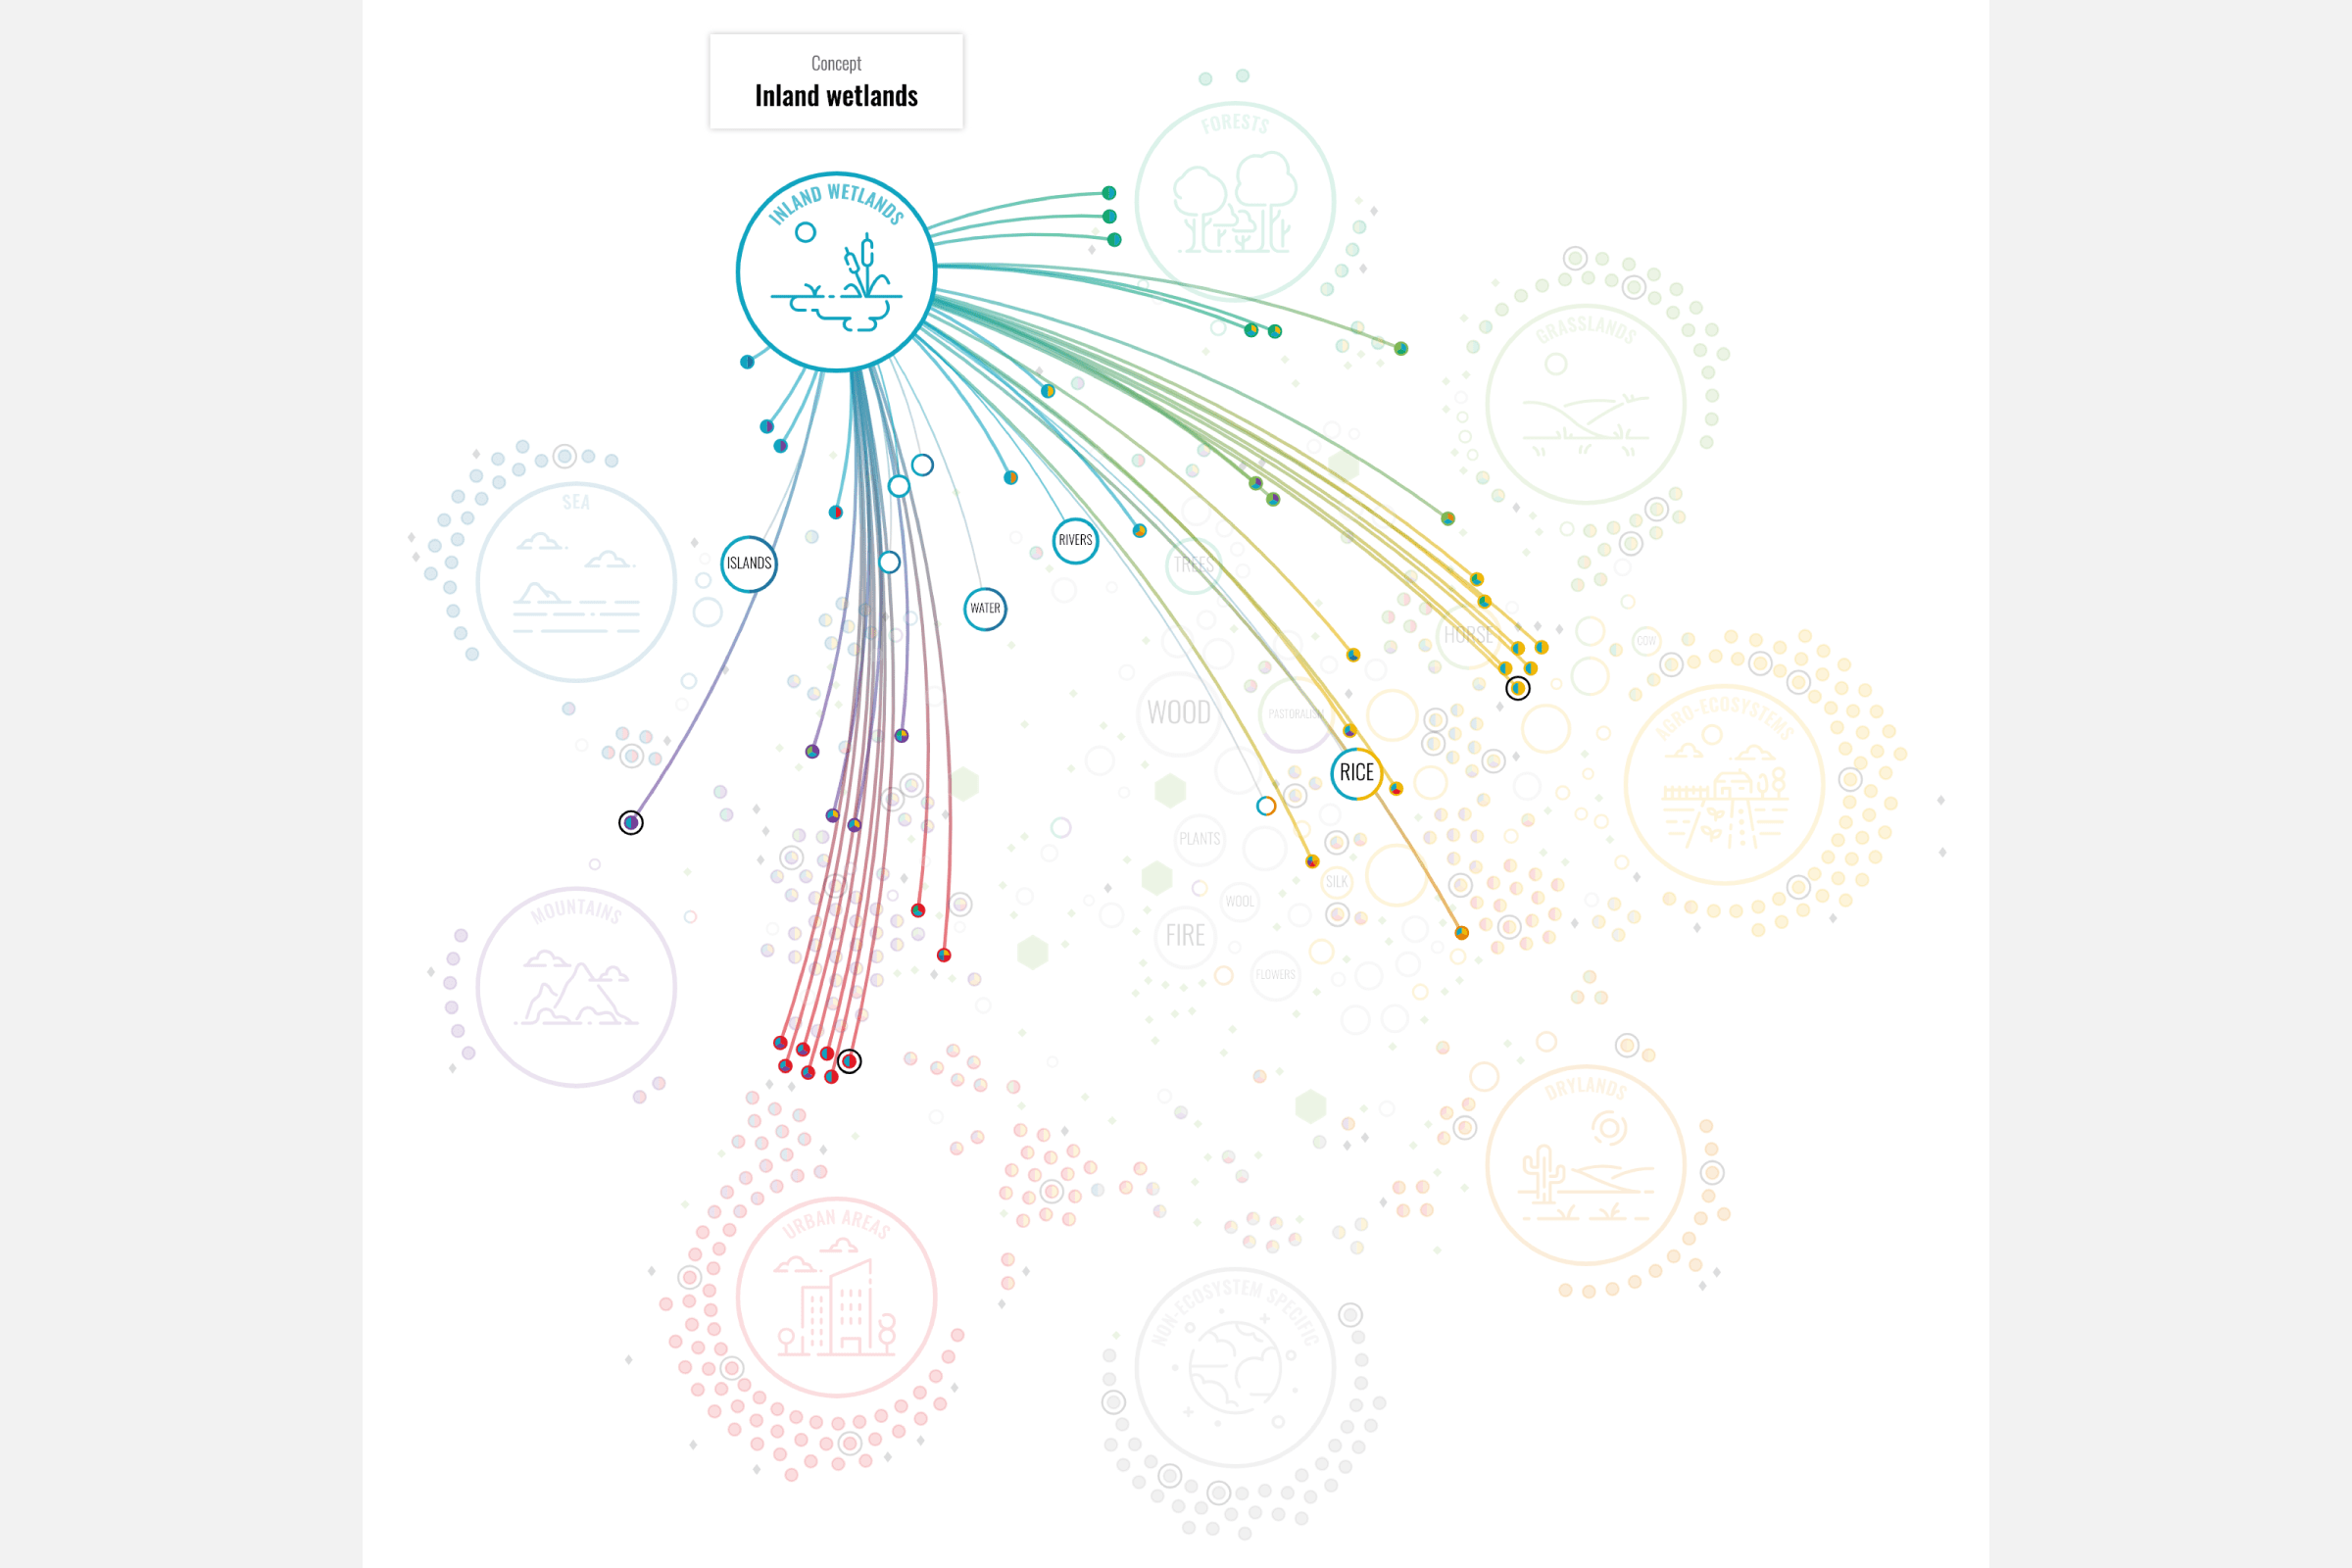
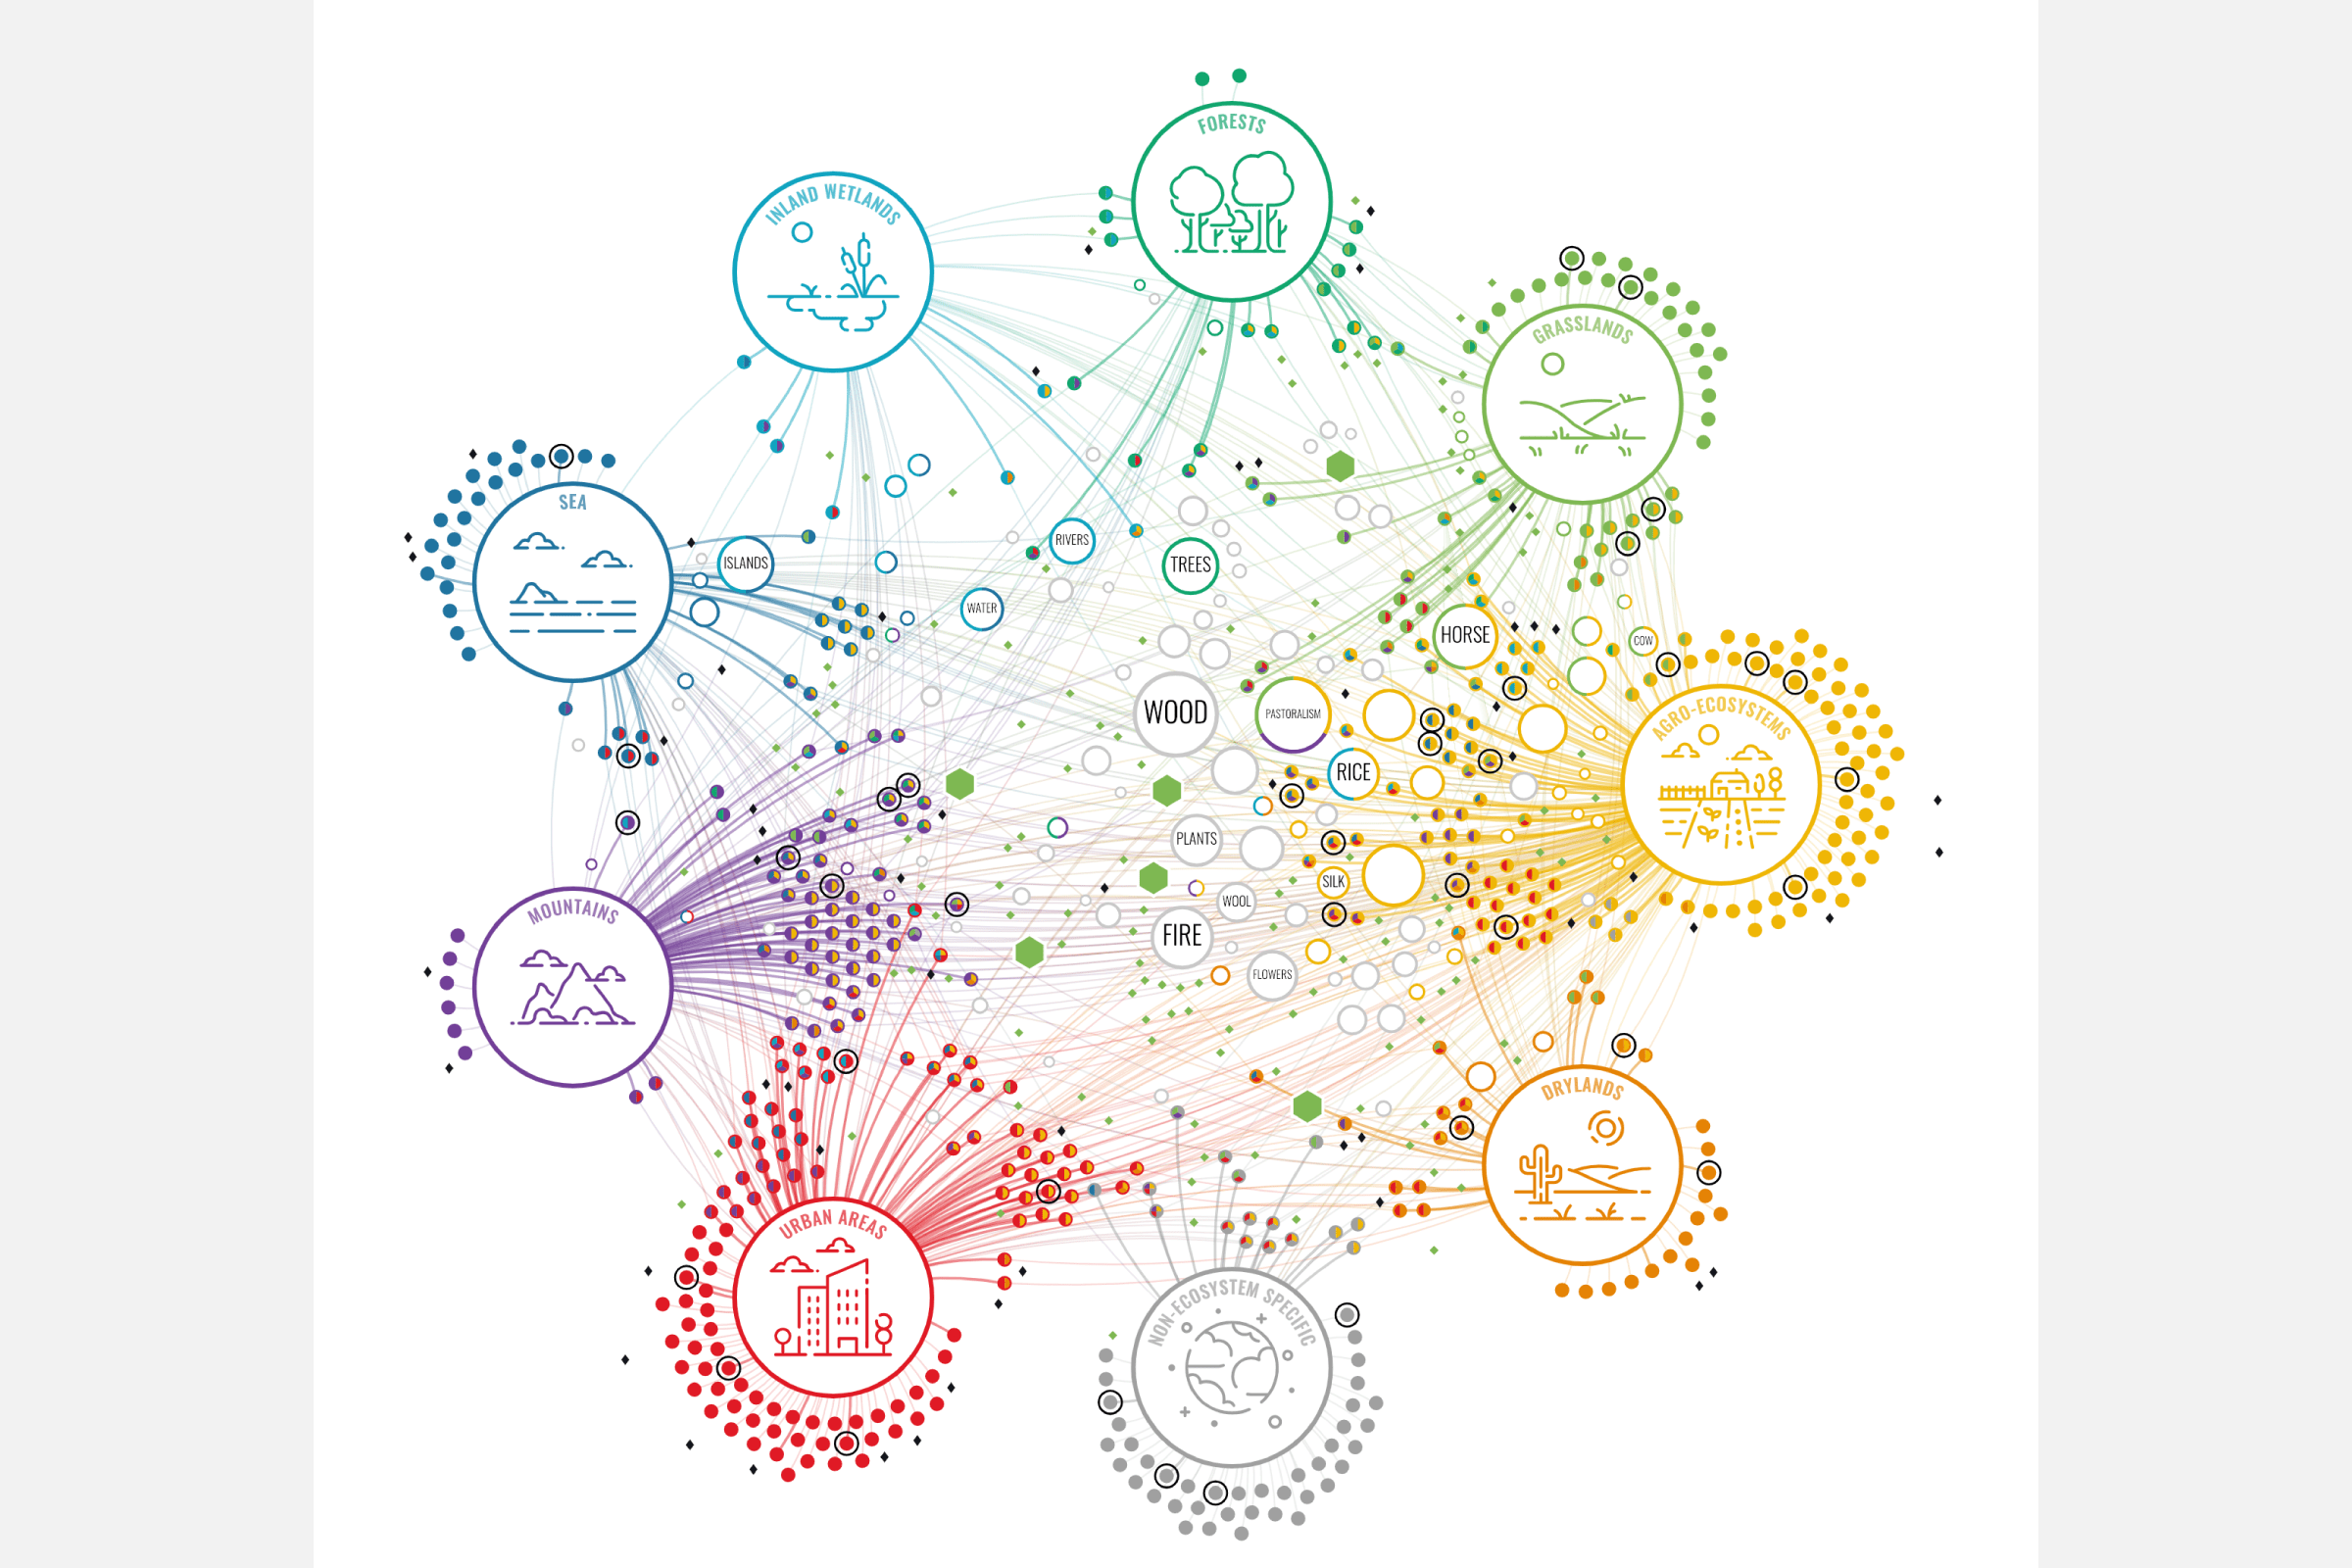
The client was so happy with the resulting visual, that they asked for three supporting visuals to be created as well. I therefore used the same design style as the main Constellation in terms of colors, shapes and general circular lay-out. Although especially the Domain and Threat visual became quite different in their exact representation of the data, due to their goals being different from the main Constellation.
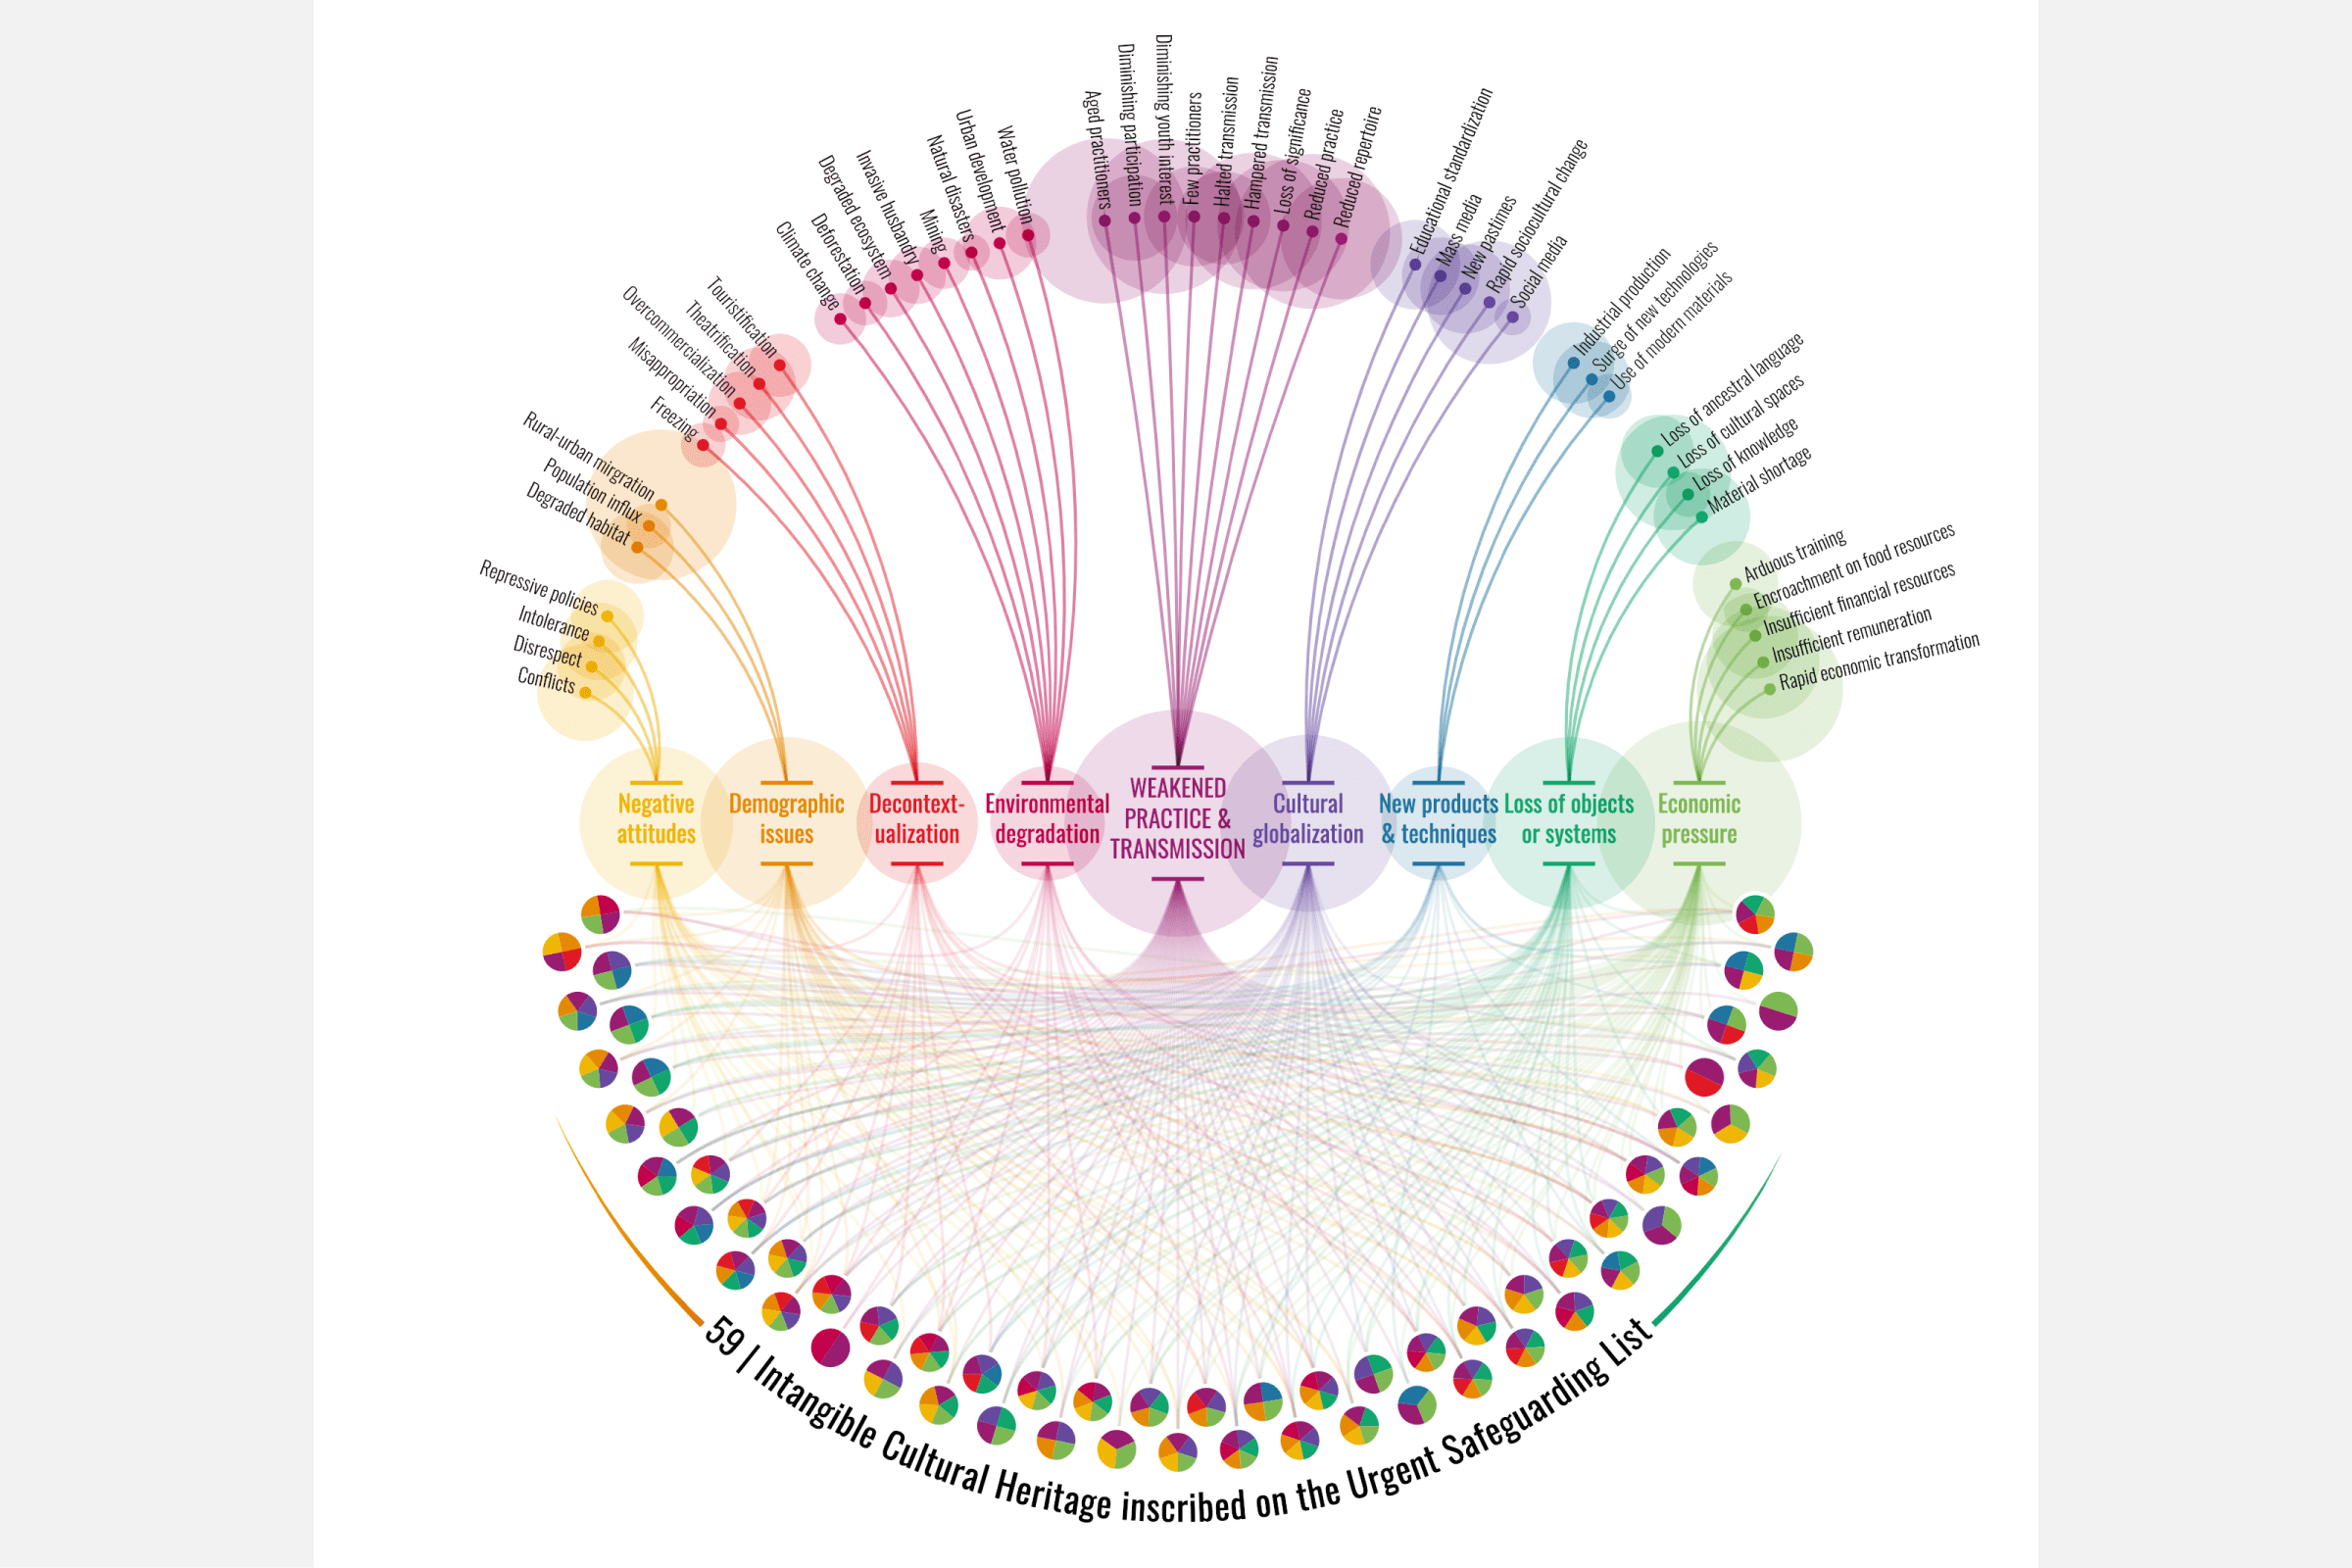
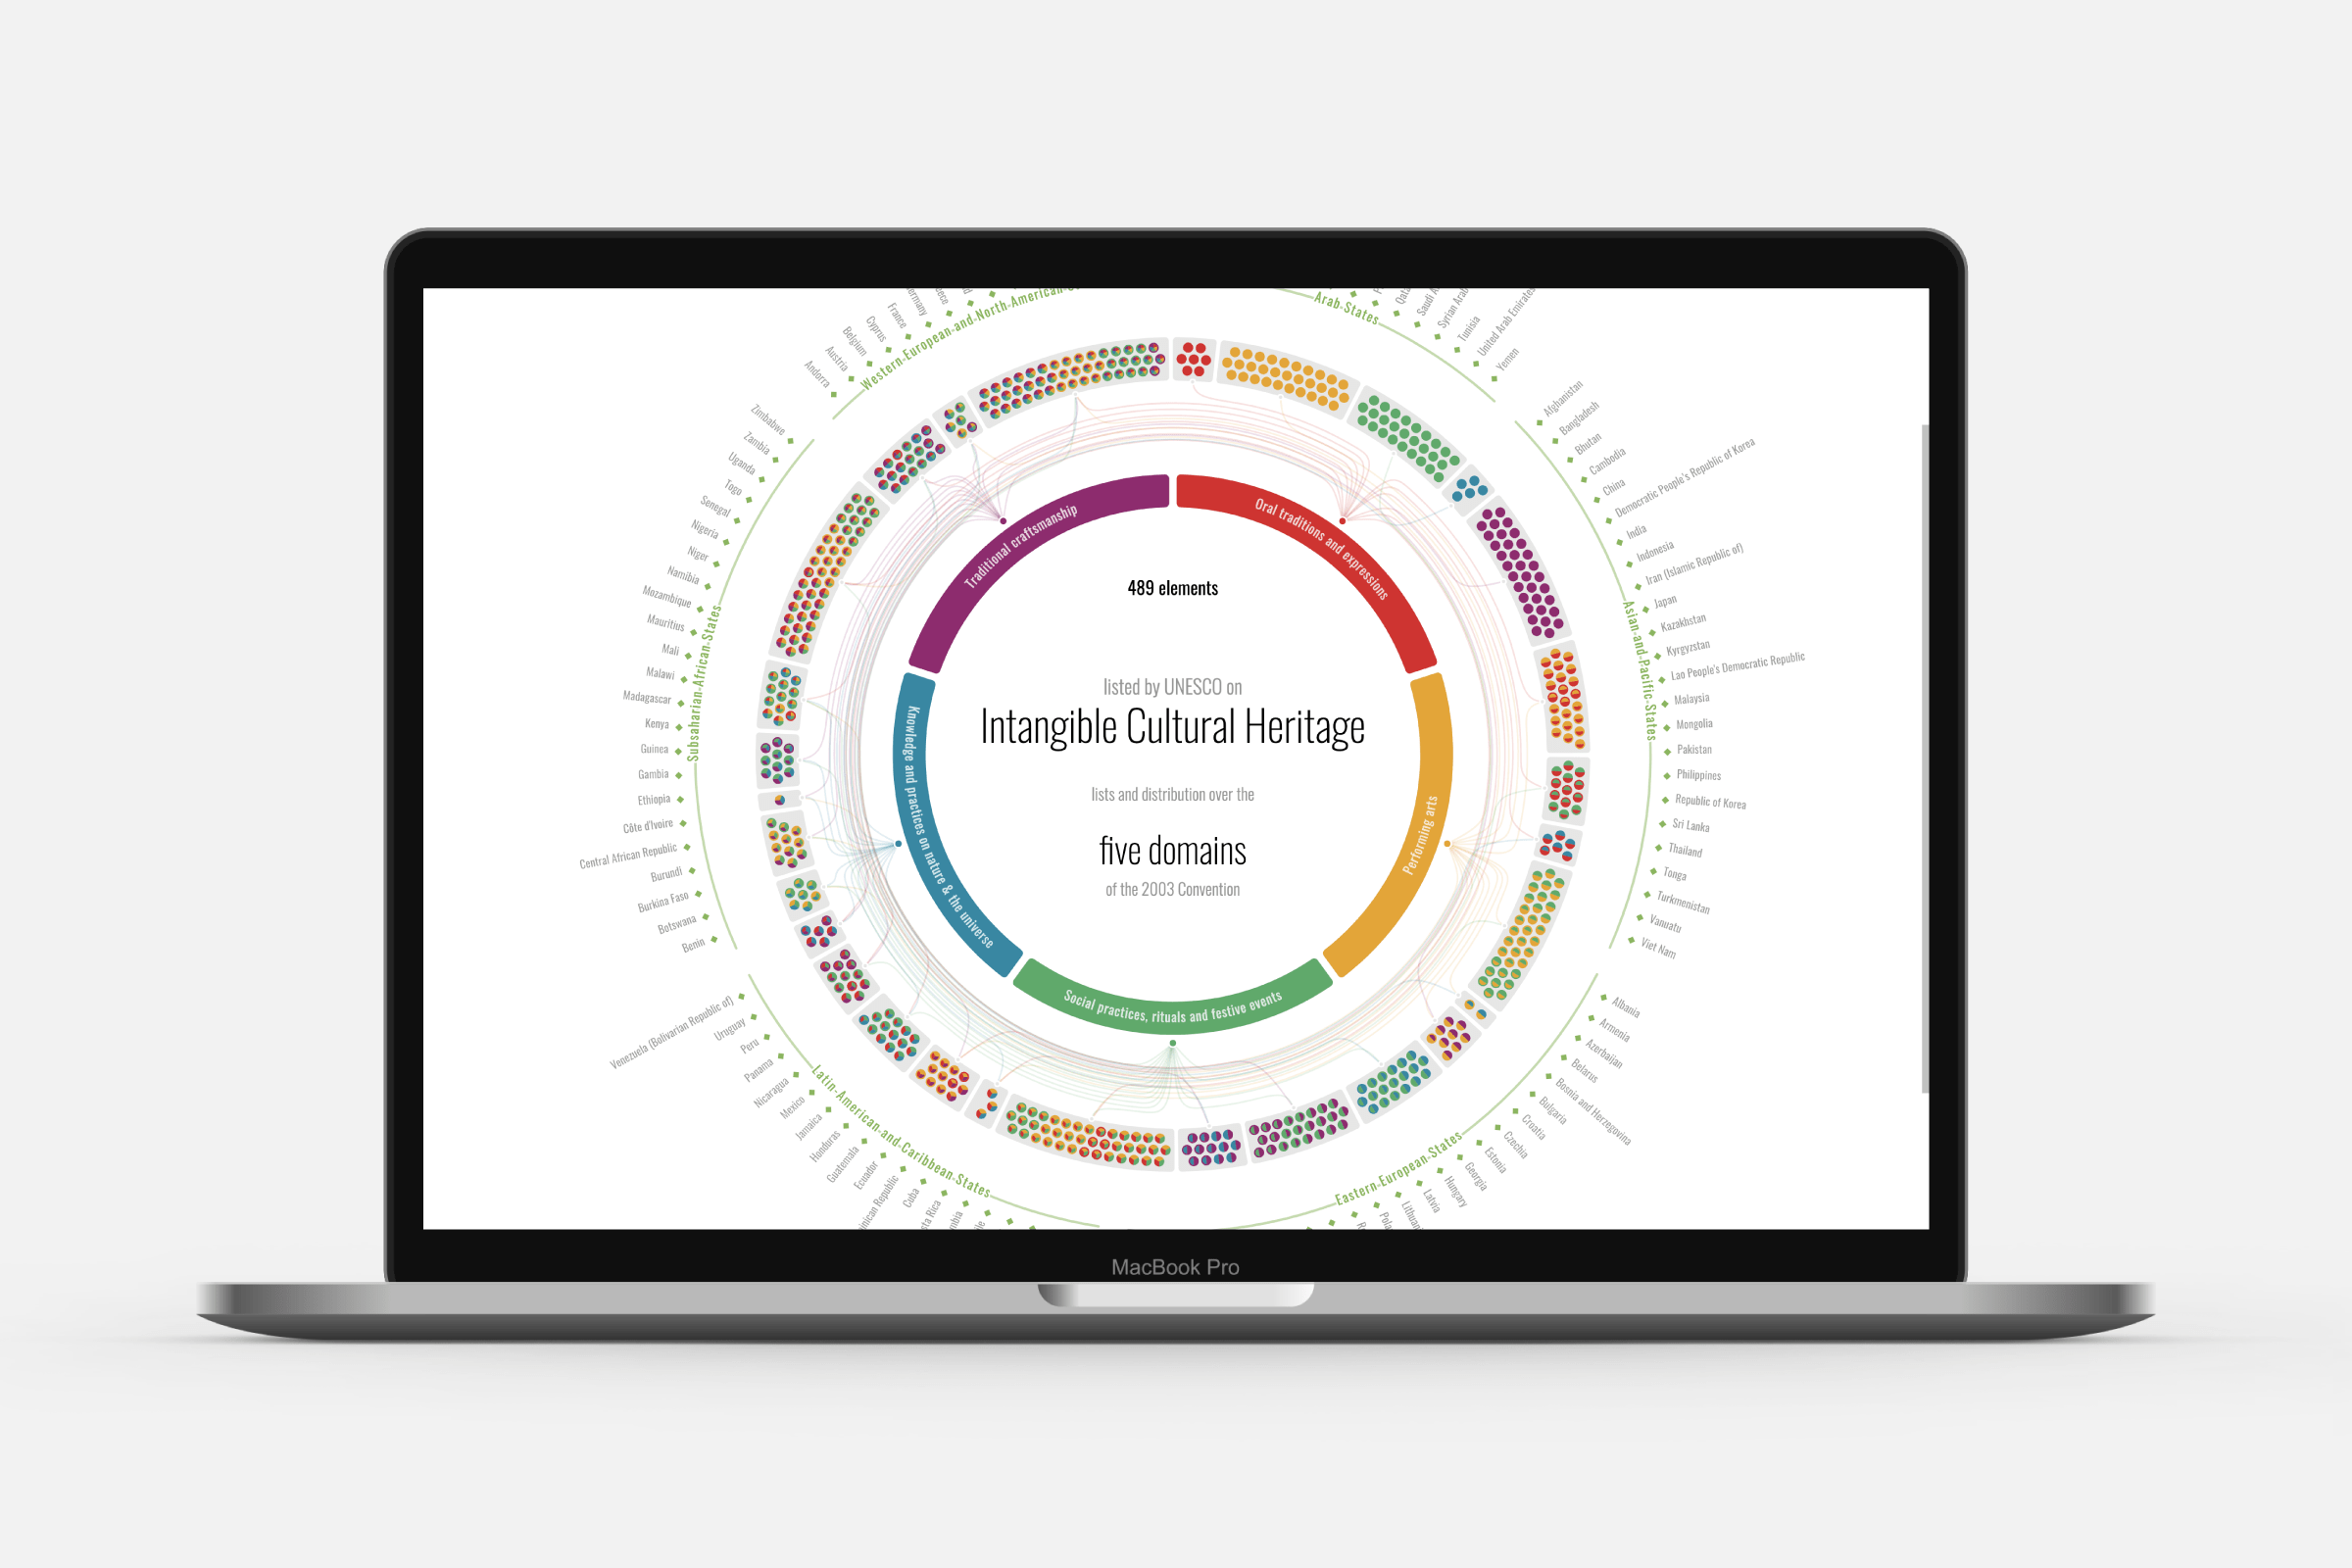
Here are direct links to full-screen versions of each of the four visuals: the main Constellation, the Biome Constellation, the Domain visual and the Threats visual.