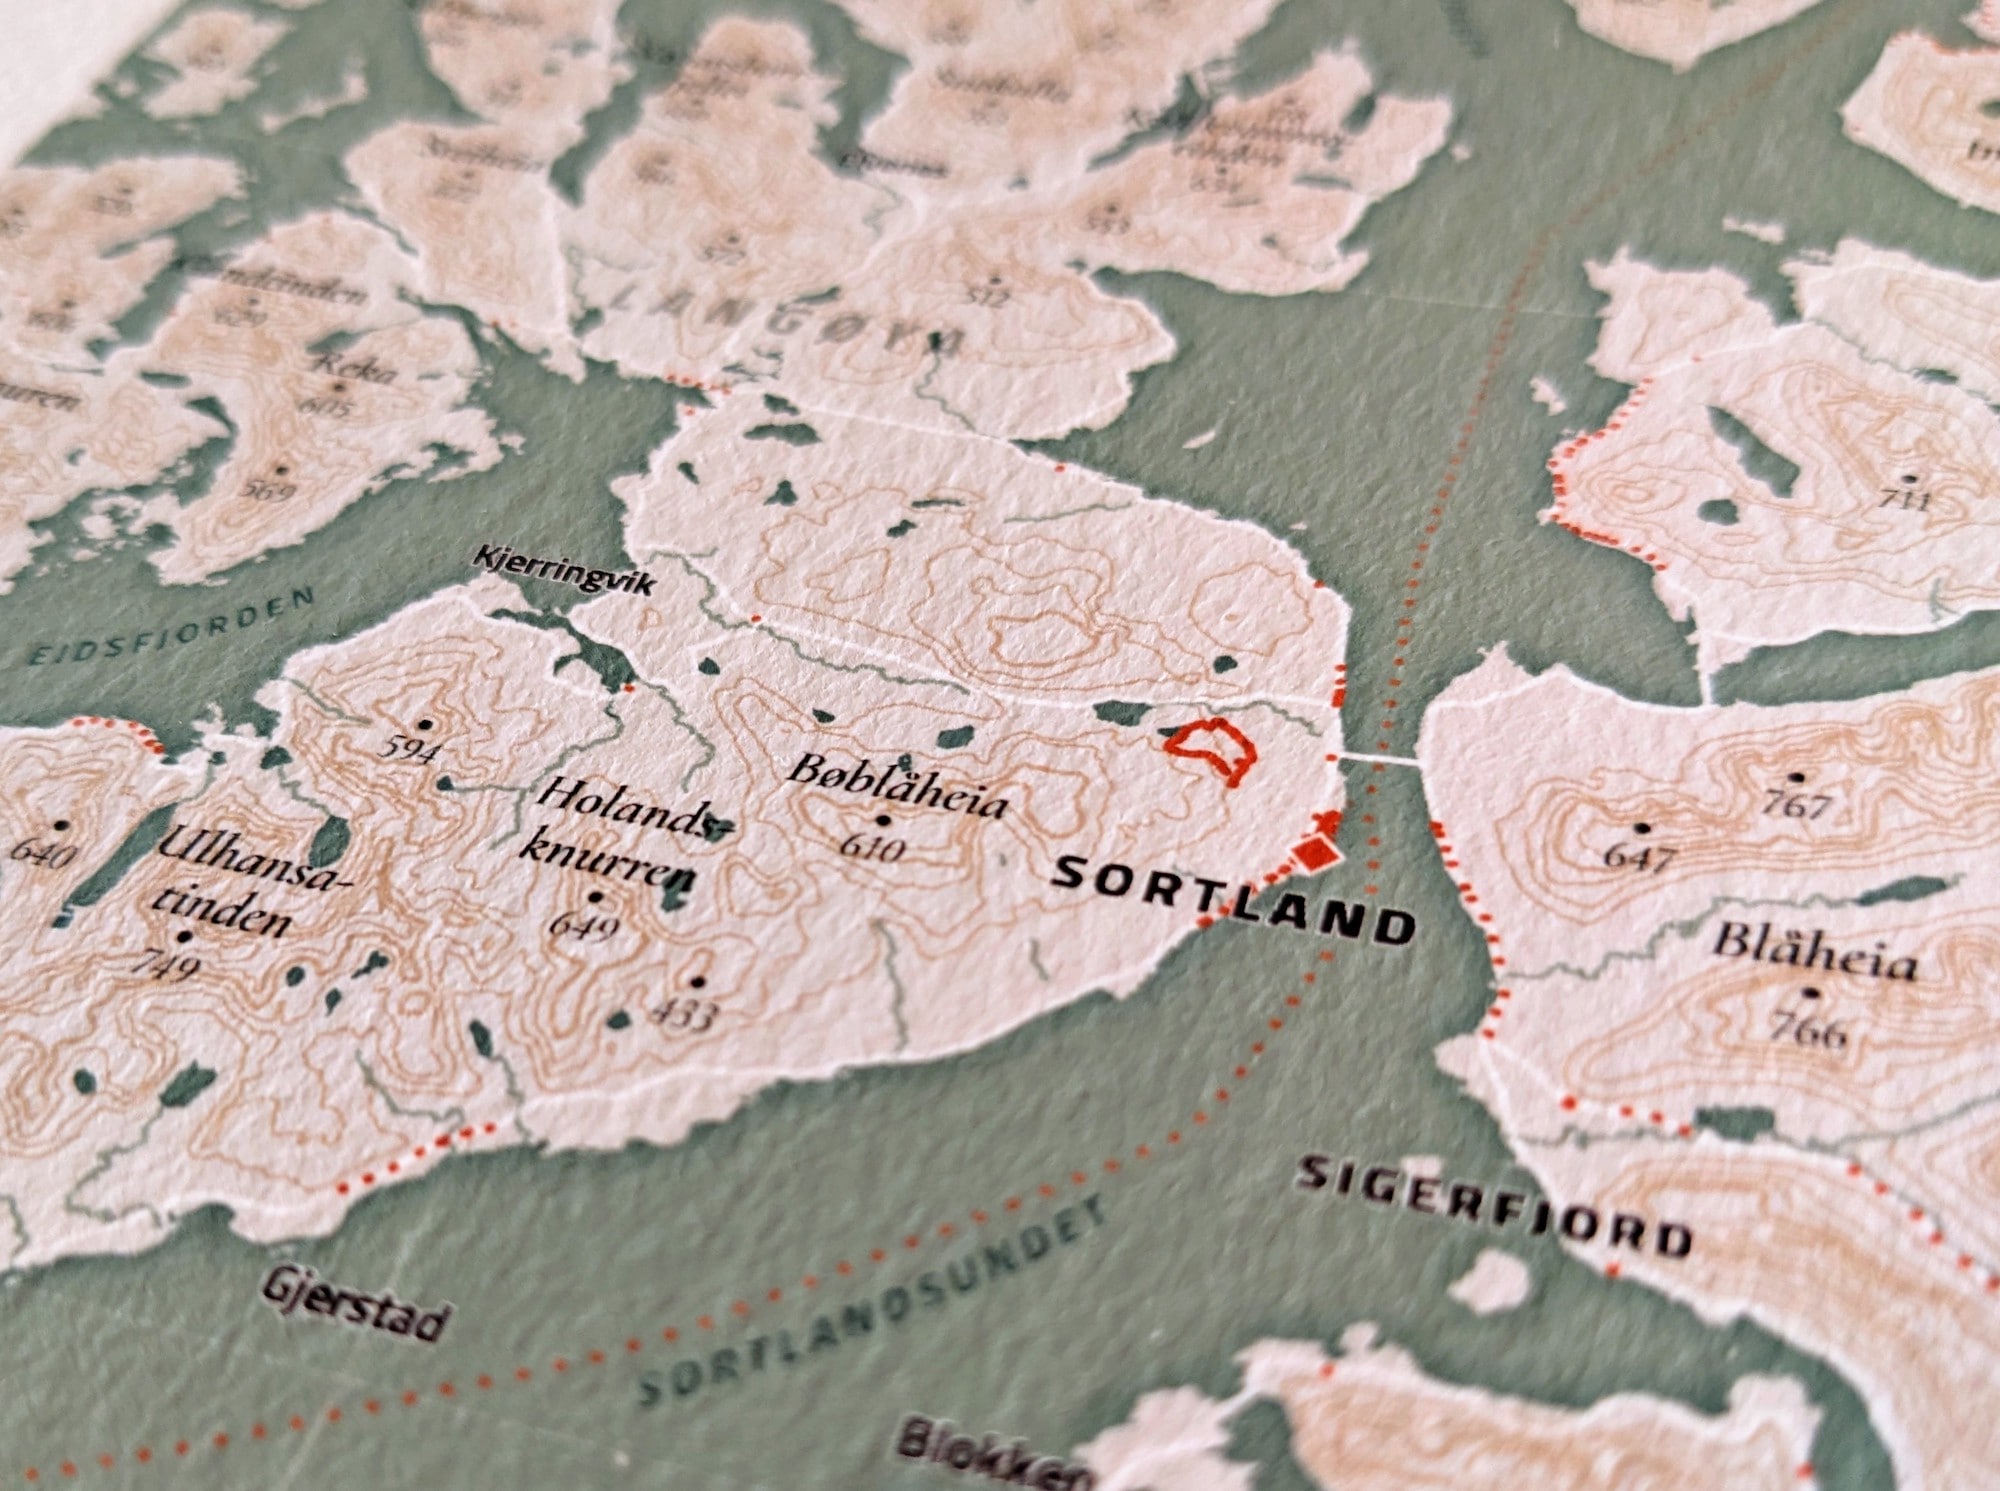
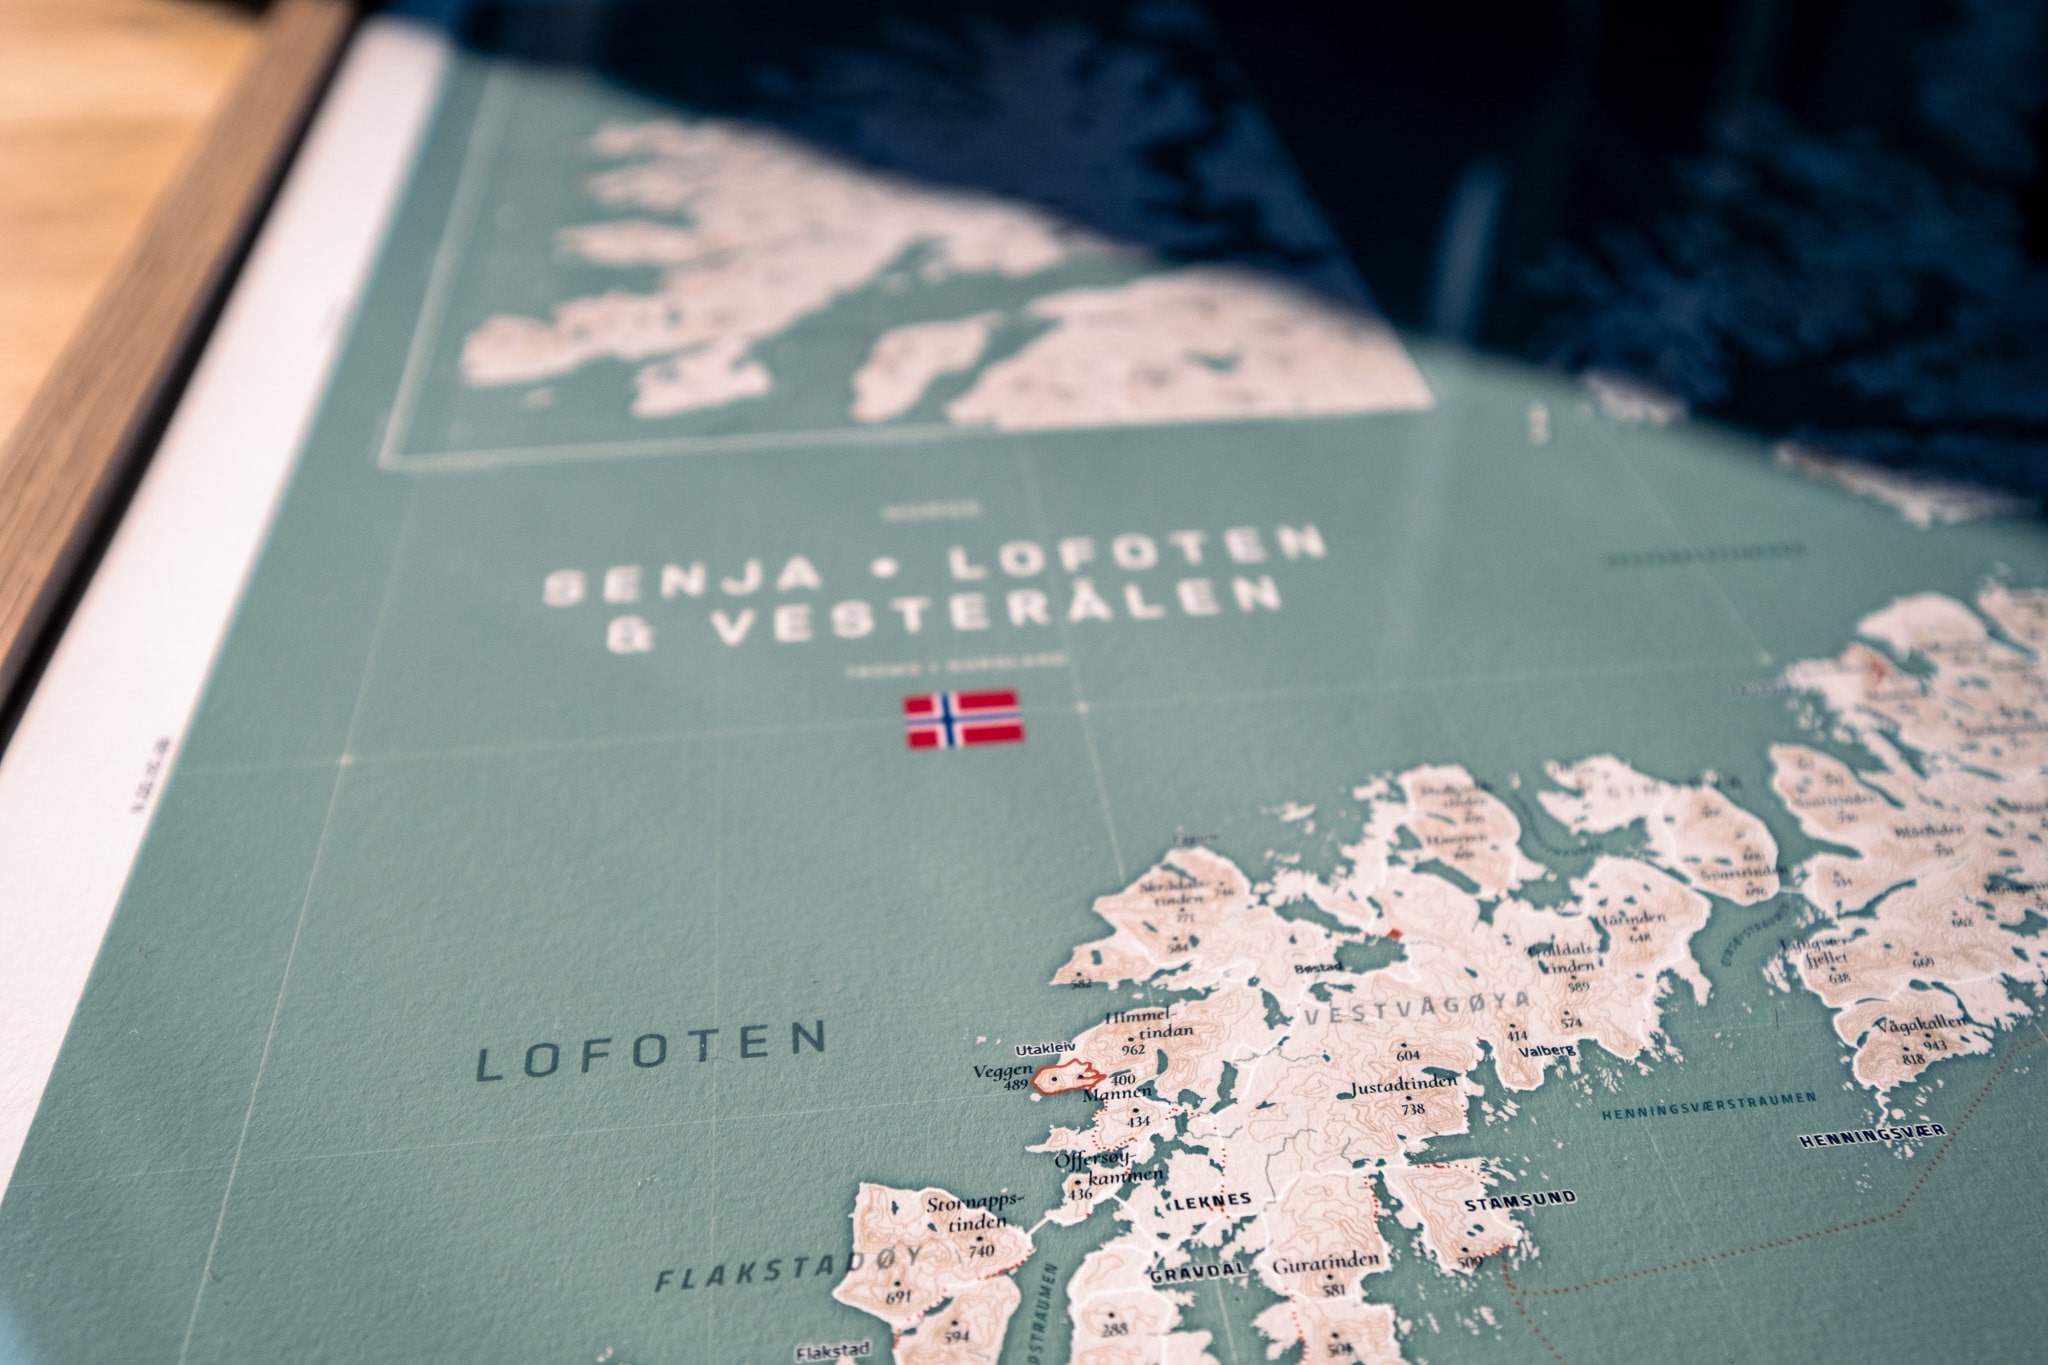
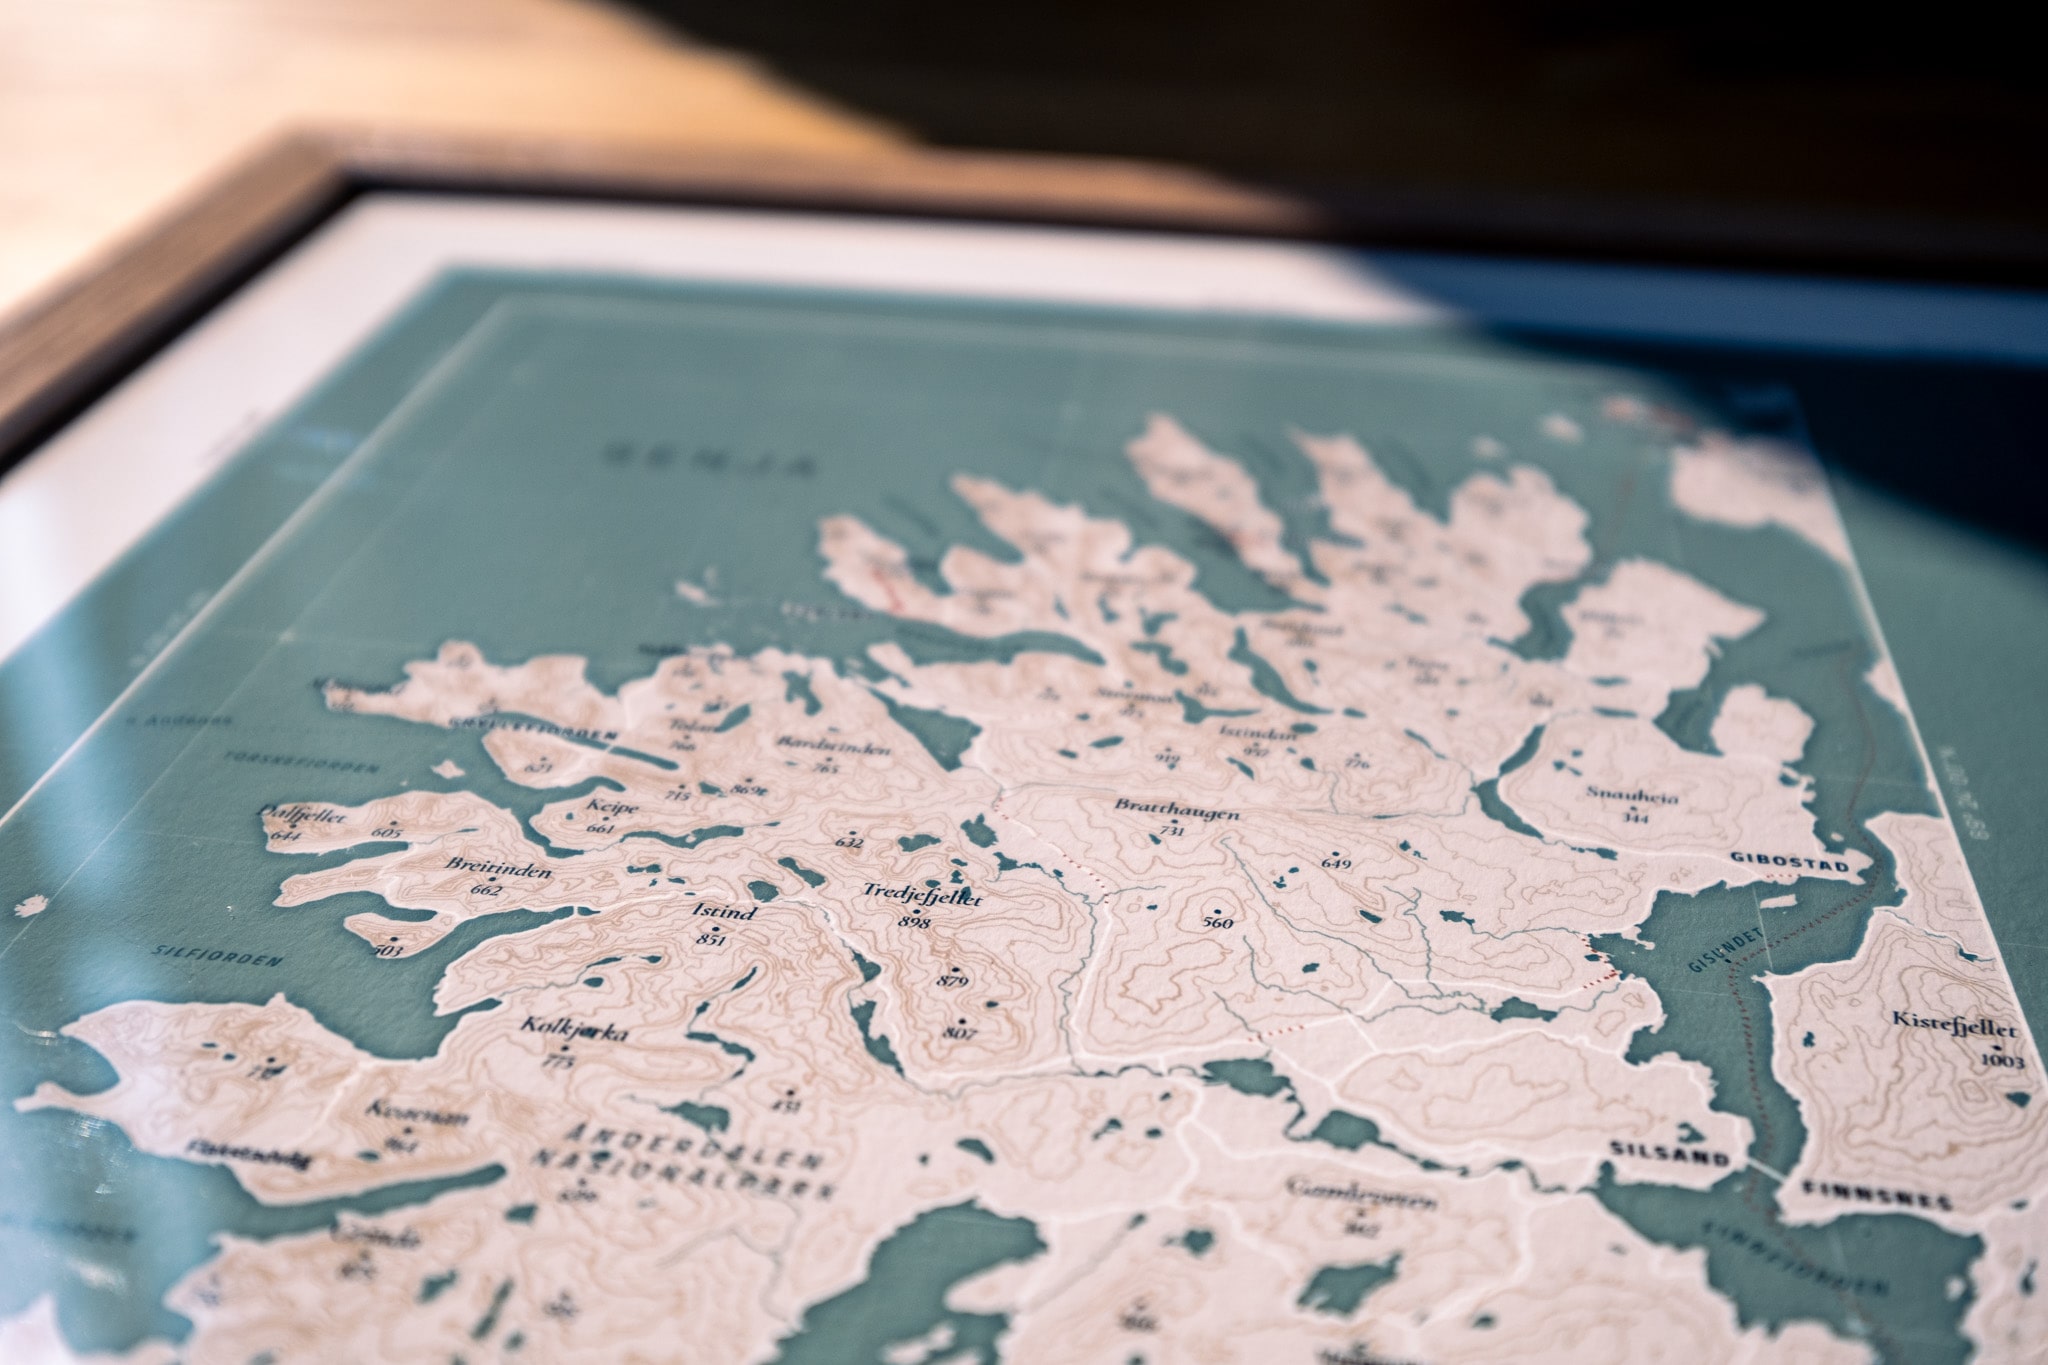
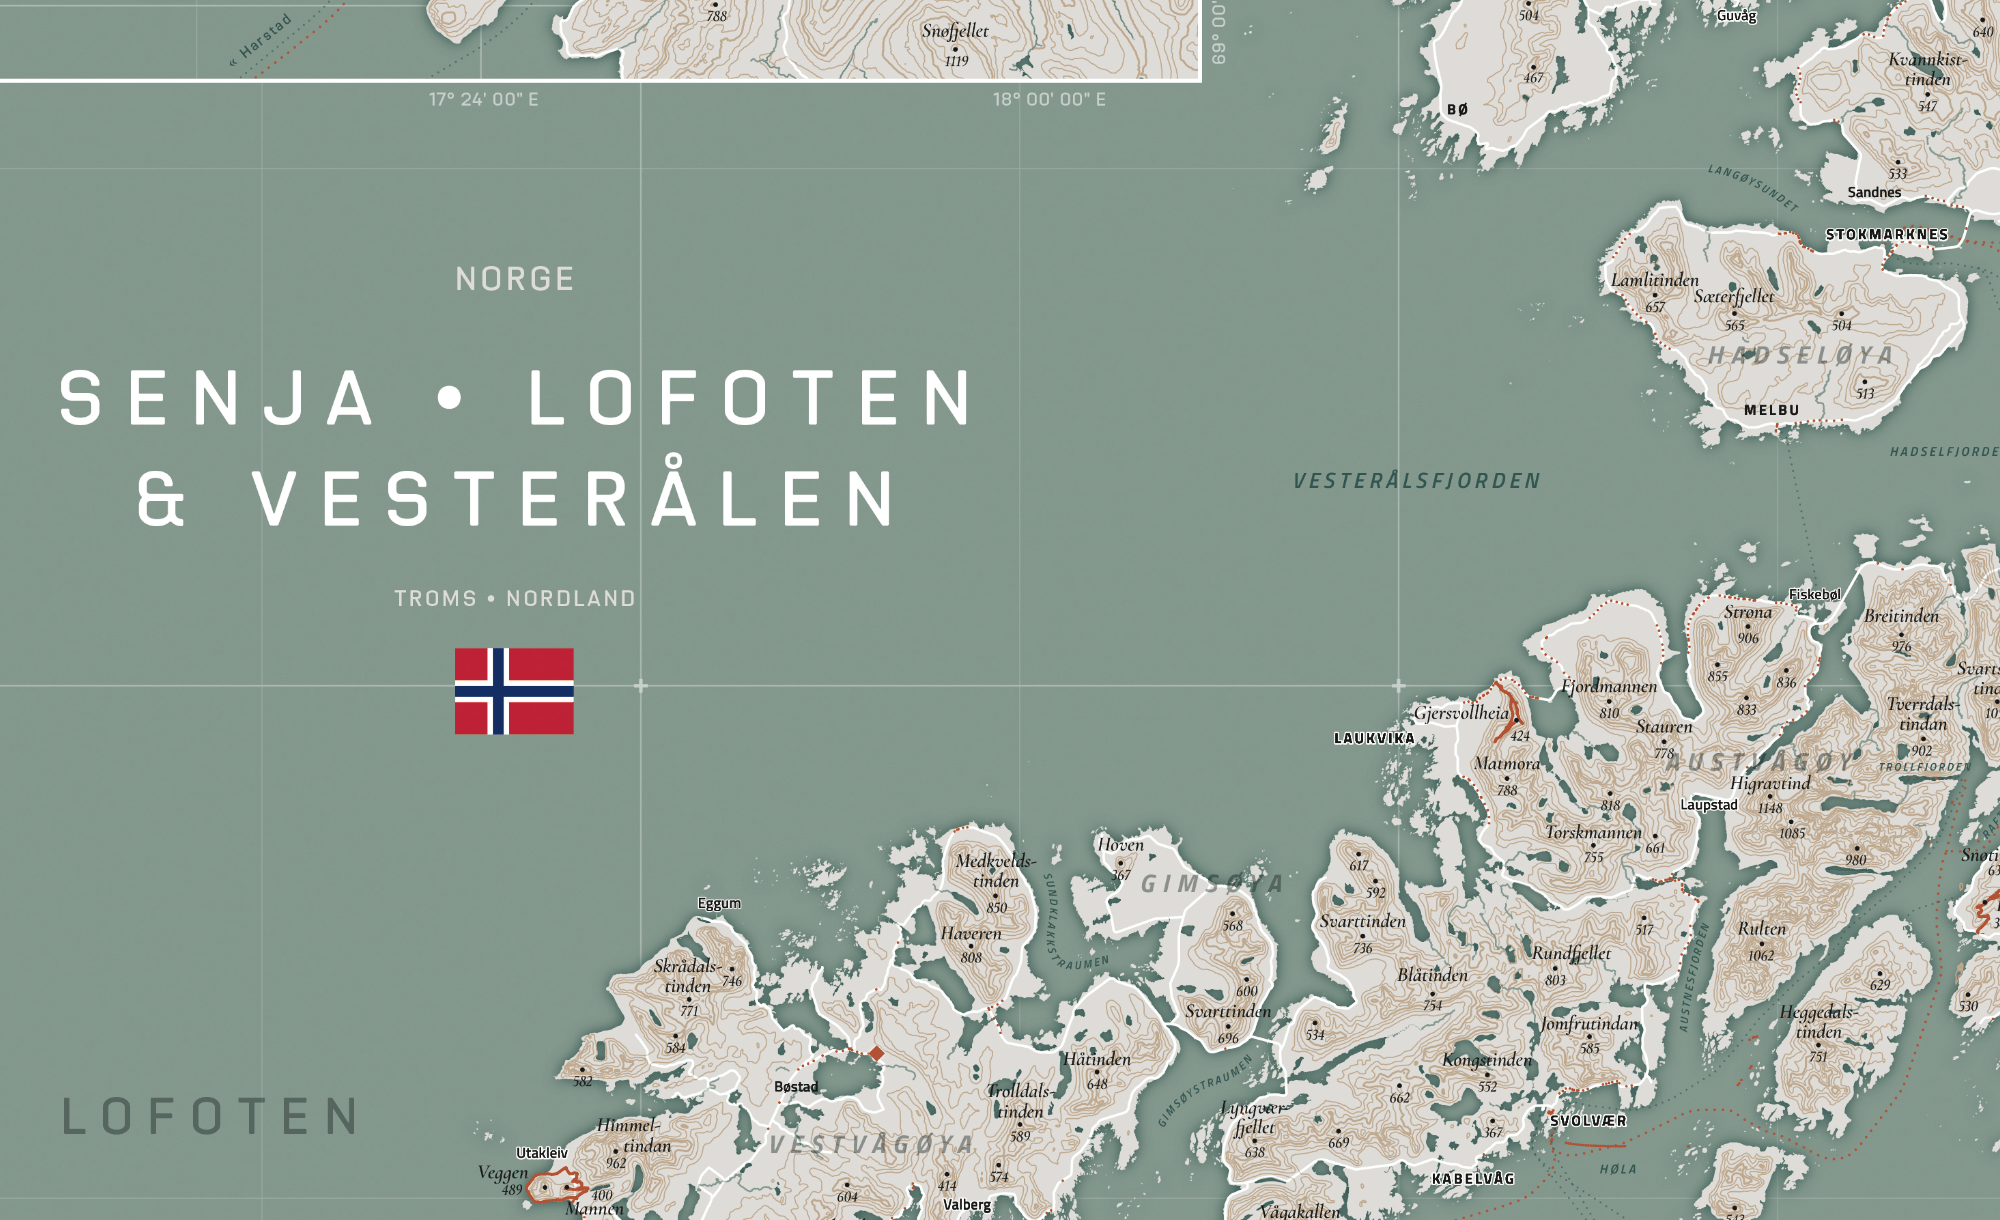
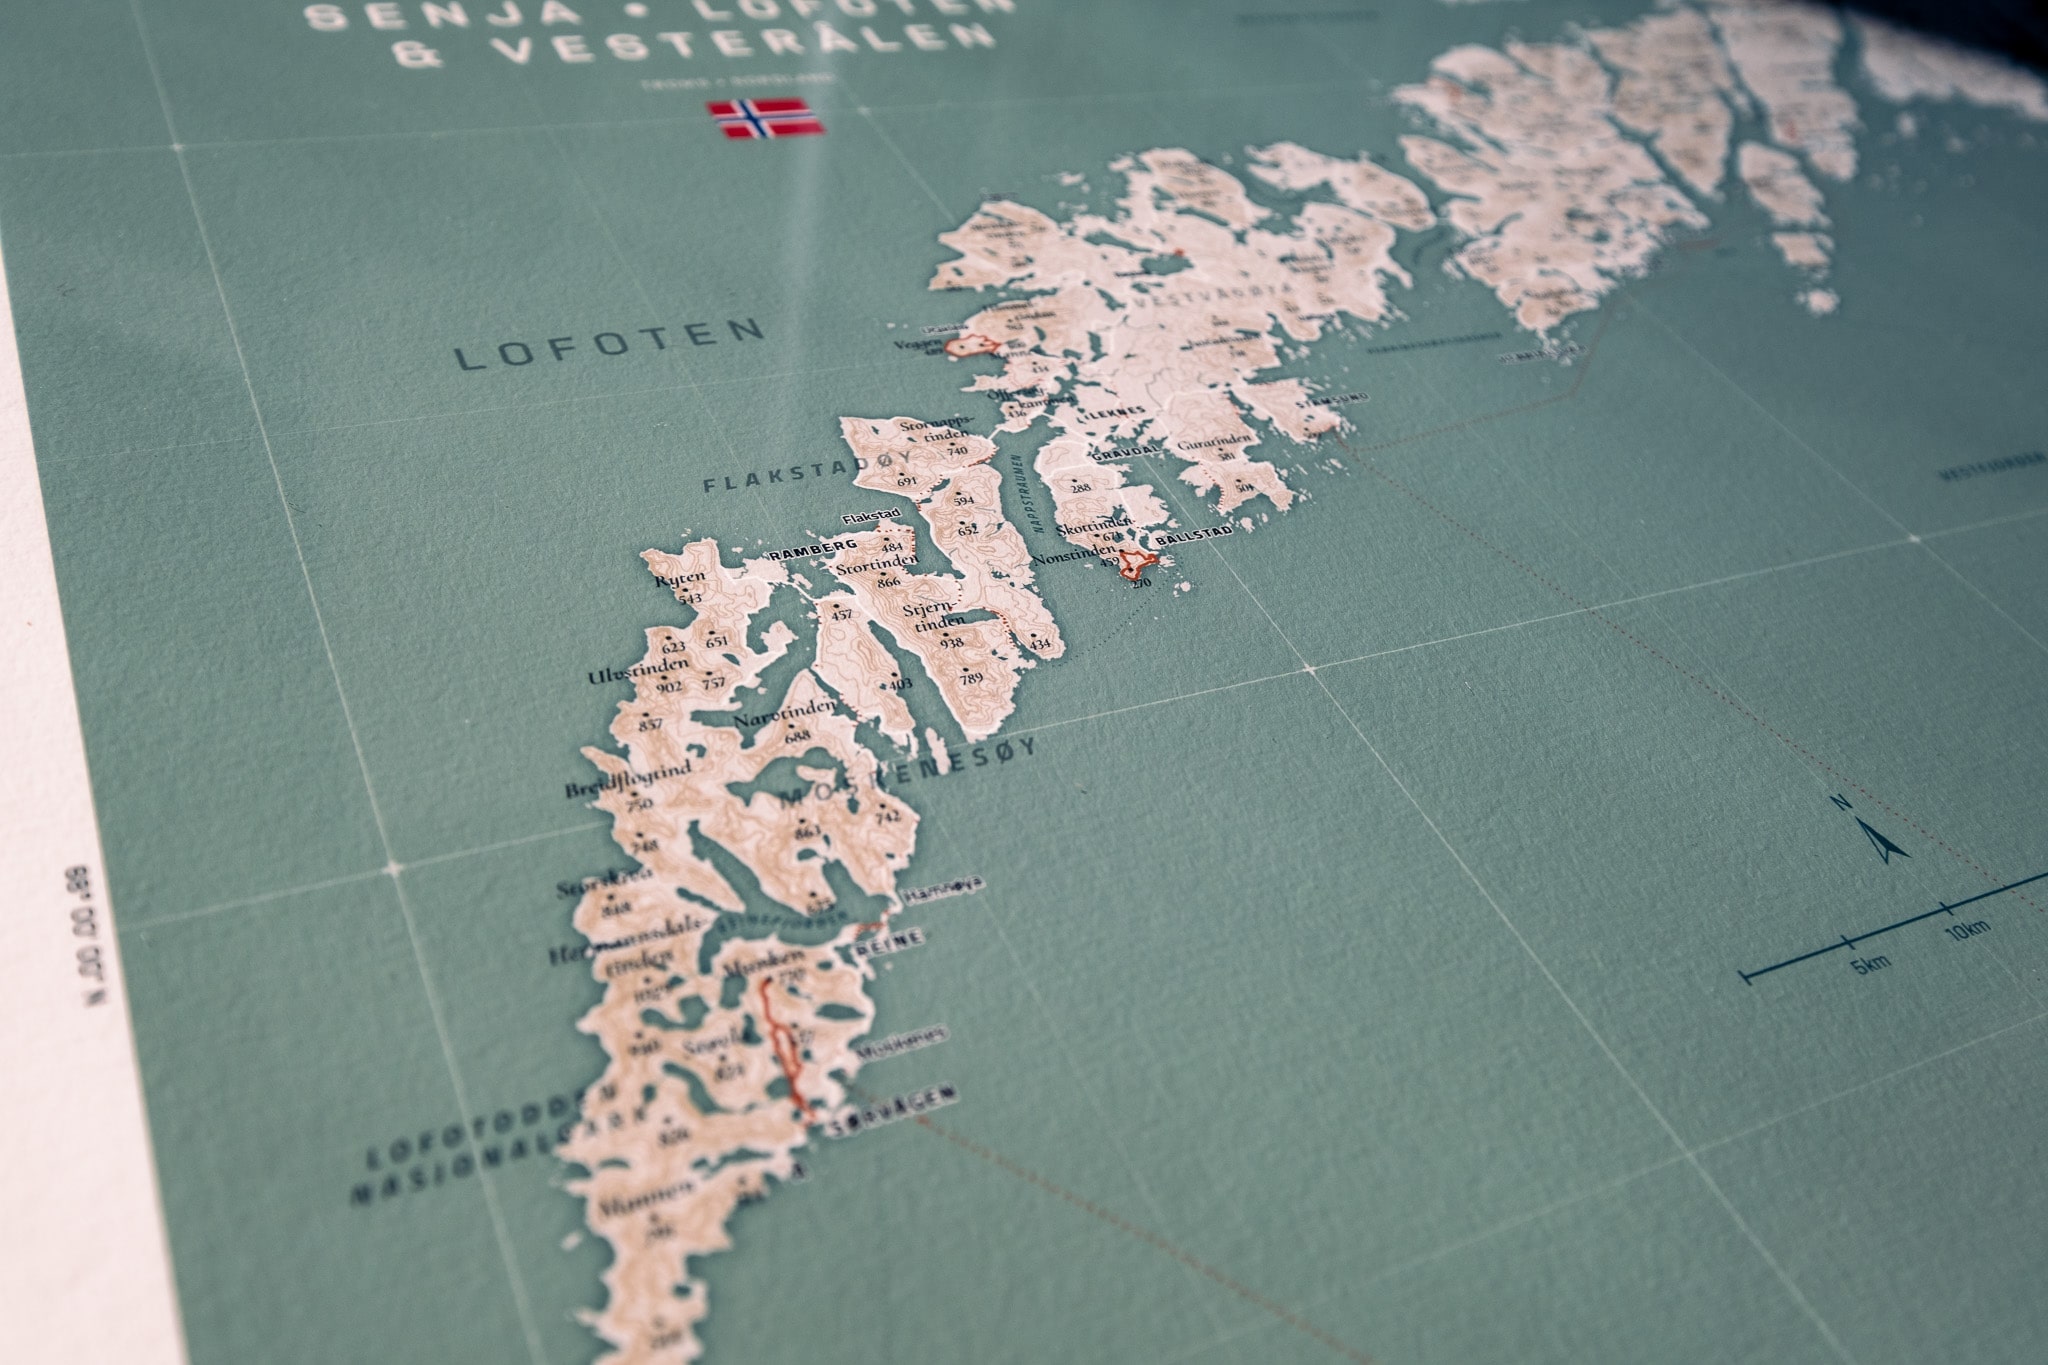
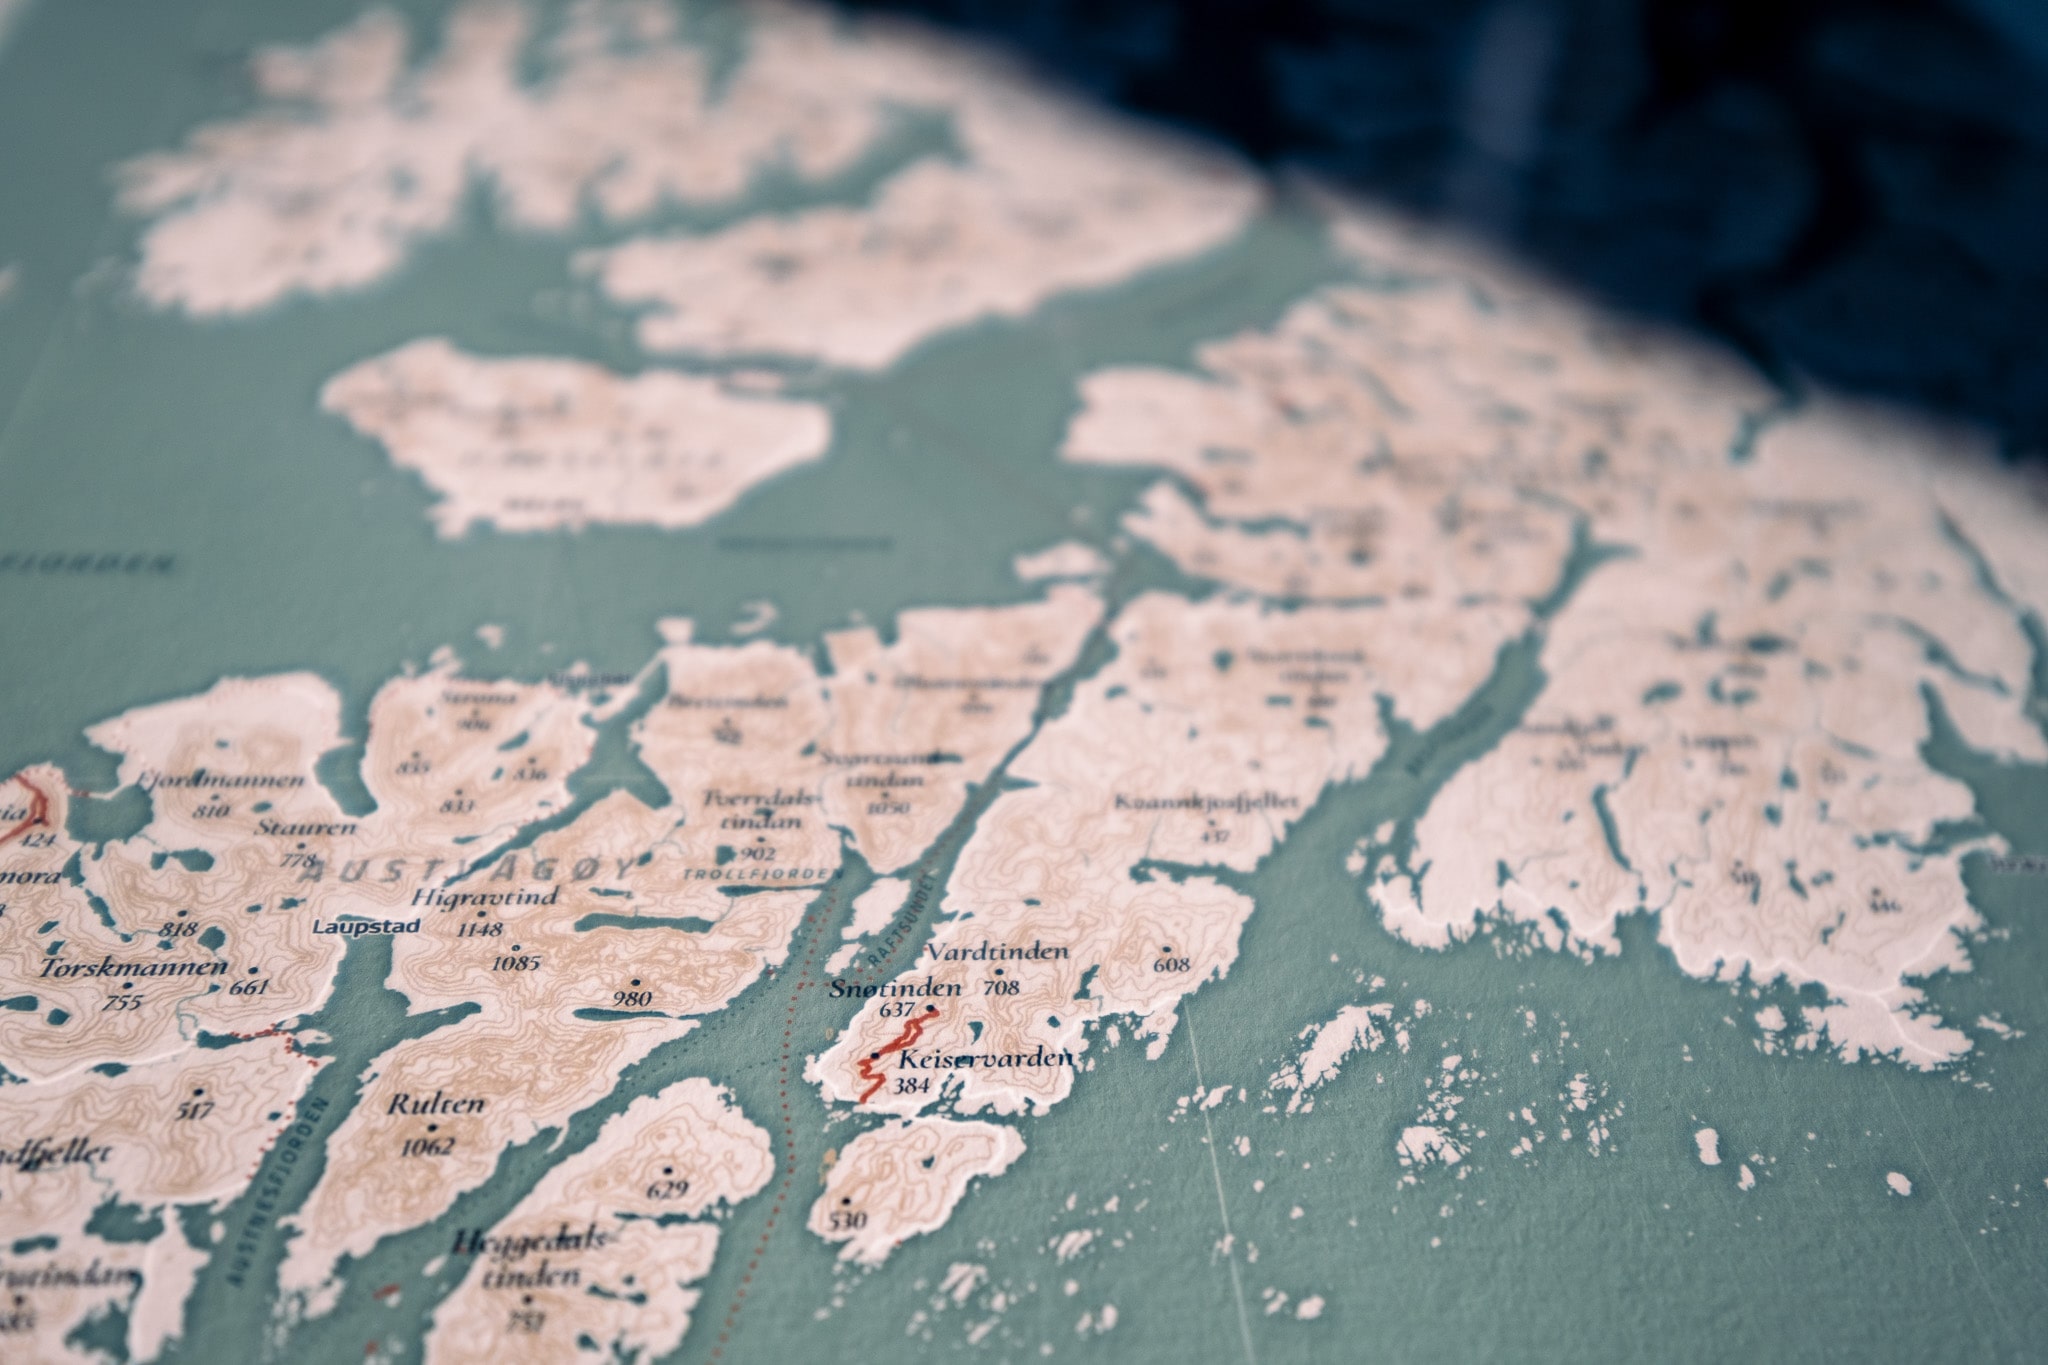
I created this map of Senja, Lofoten & Vesterålen to remember the five months I traveled through Norway in 2022. I loved the whole country, but these locations stole my heart. The map uses on data from the OpenStreetMap API and the height lines (contours) from Amazon Web Services Terrain Tiles. To make it more personal, I added several layers of personal geo data to the map as red elements: lines show our hikes, small dots along the road are the Google location history points, diamonds for the locations we stayed overnight, and more. I had the map printed at 50x60cm on fine-art paper and it is now hanging in a prime spot of our hallway.
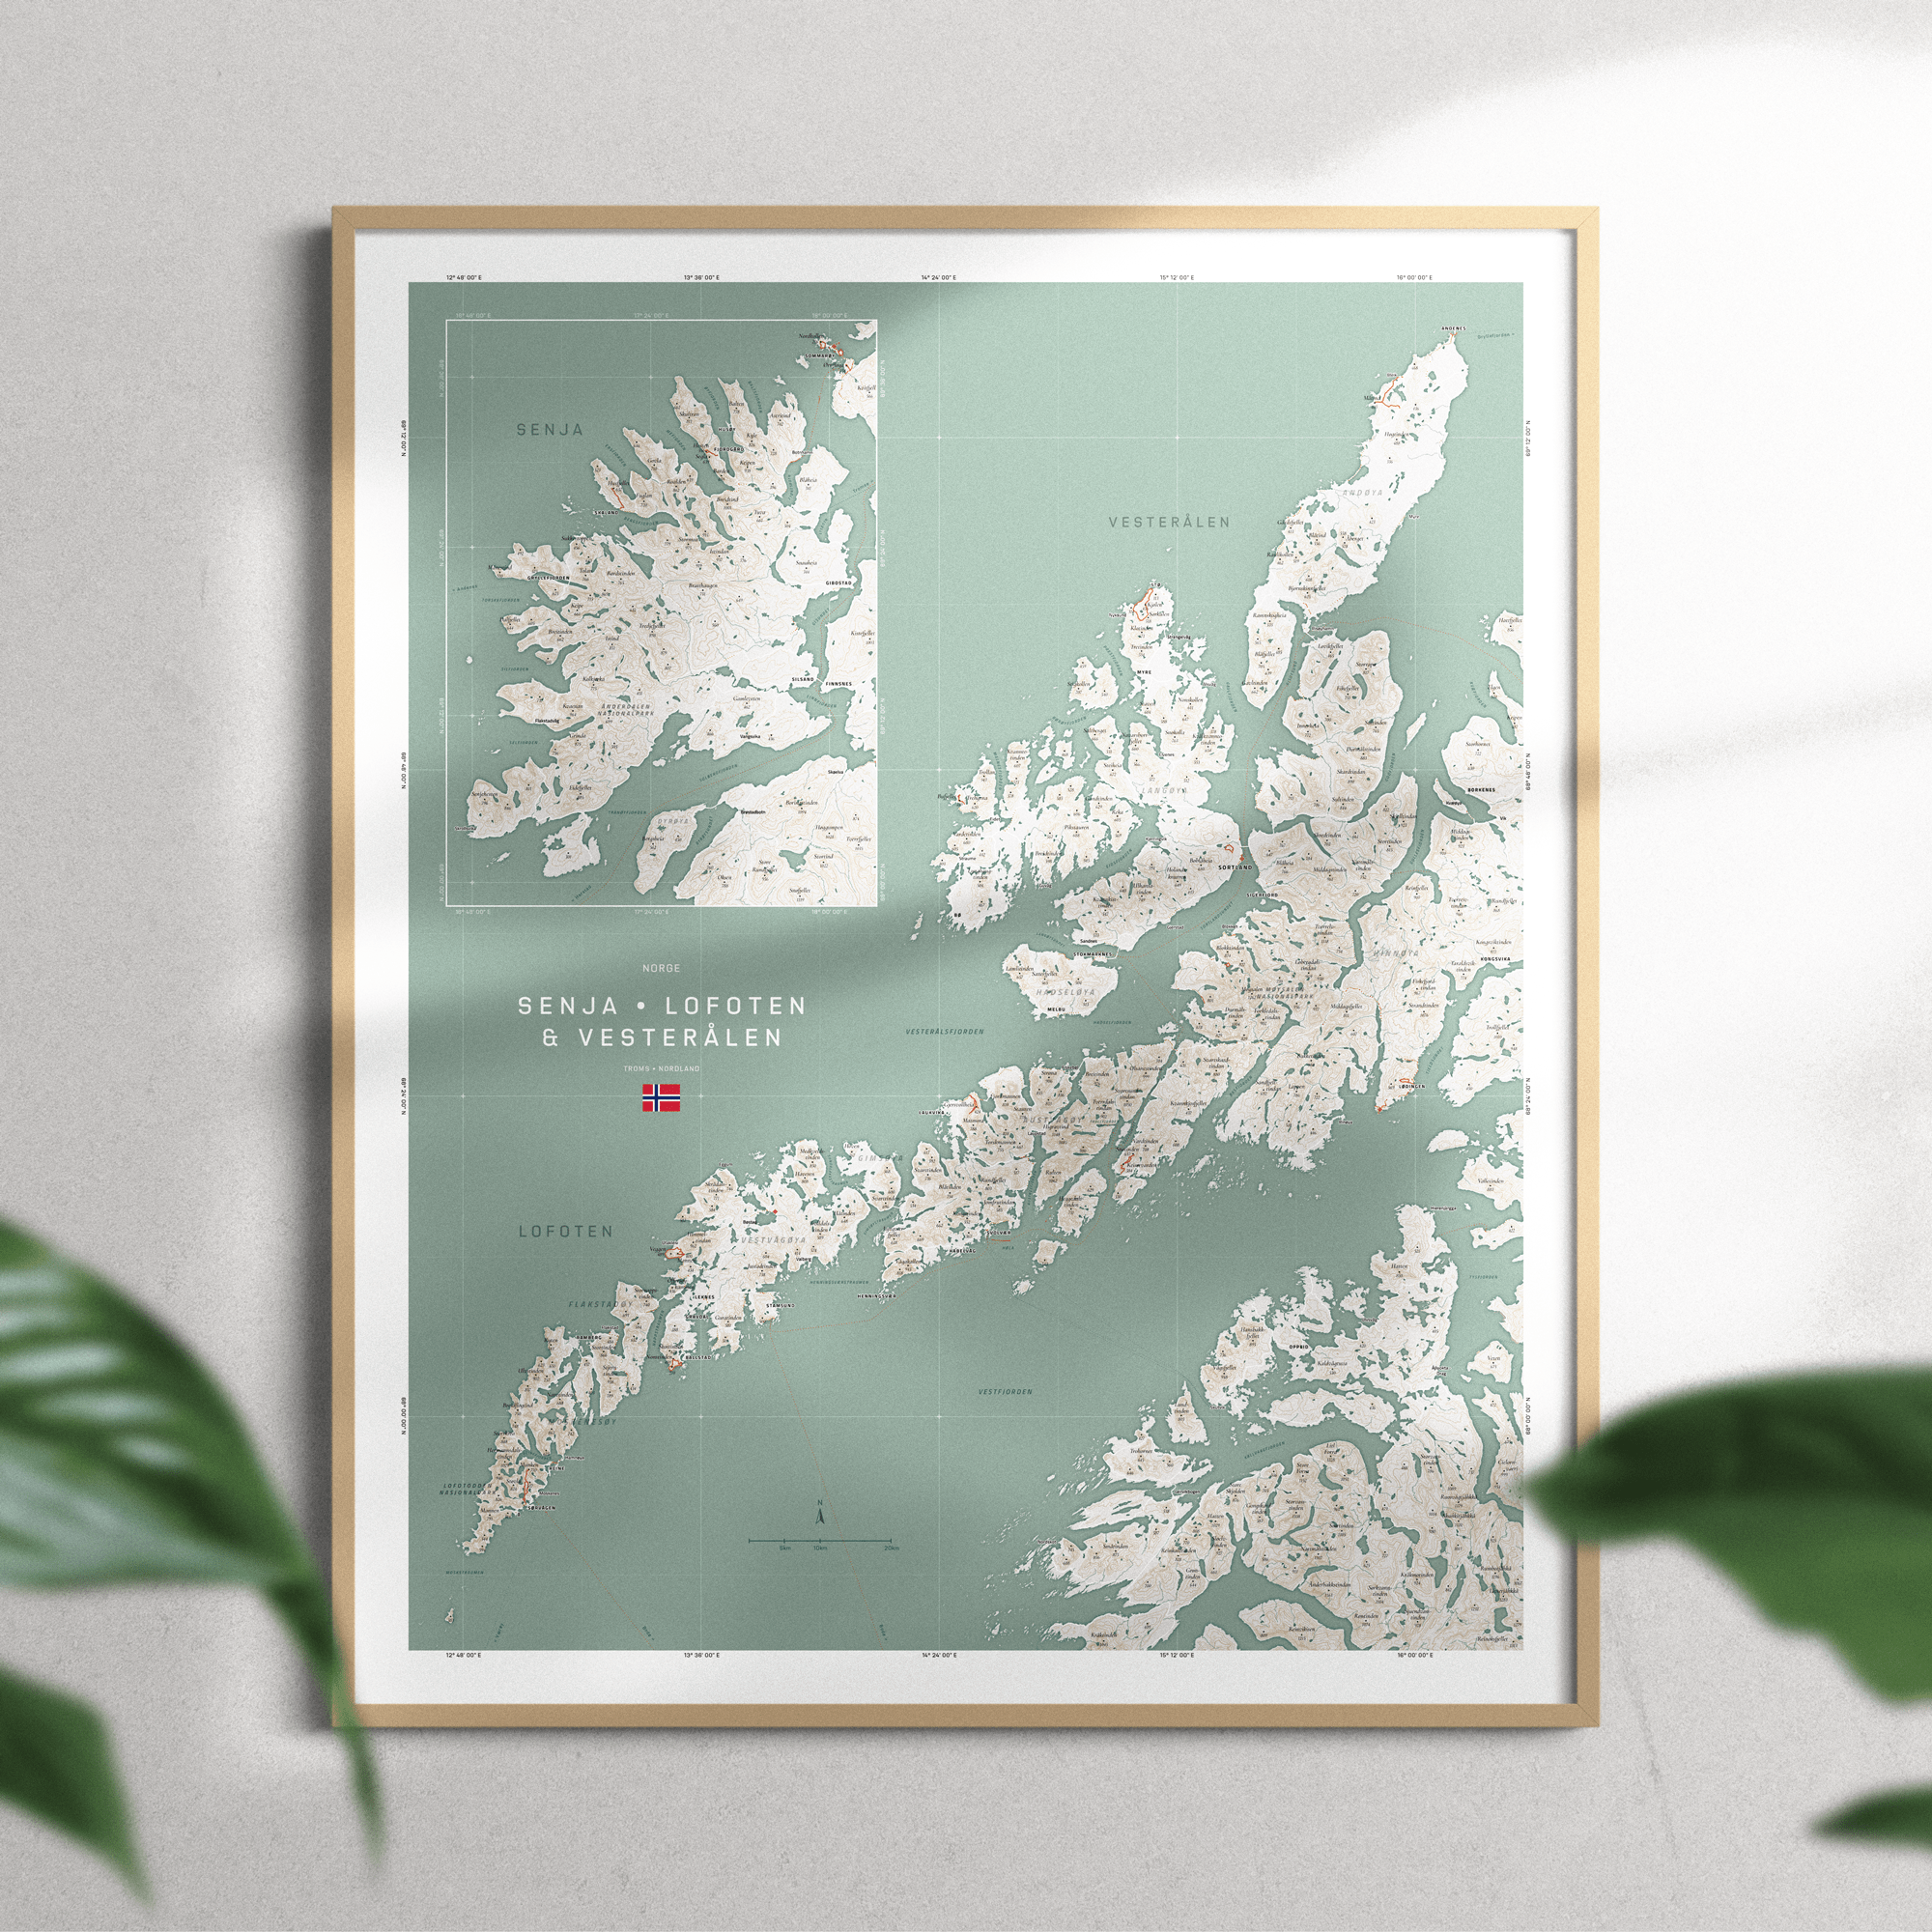
The design for this map is highly based on a fantastic map of Senja from Fjelltop. I was thinking about getting this map, but I also wanted to have a map of the Lofoten. I eventually decided to create the map myself. But I used the styling of that original map as the base for many of my color choices.
Since I wanted complete creative control I created the map with JavaScript. Using the OpenStreetMap API through R, I downloaded all the elements I wanted to show: coastline, roads, lakes, mountains, and more, cleaned each and saved to a file.
I added personal touches to the map to make it unique. Eventually, I gathered information about the locations we stayed at, our activity tracking data from our Garmin smartwatches to see the many hikes we did, and our Google location history.
I printed the final poster at 50x60cm as a Giclée on Hahnemühle German Etching paper to get a lovely textured feel while still having all the (small) texts crisp and legible.
You can find a full design blog on how I created this map here.