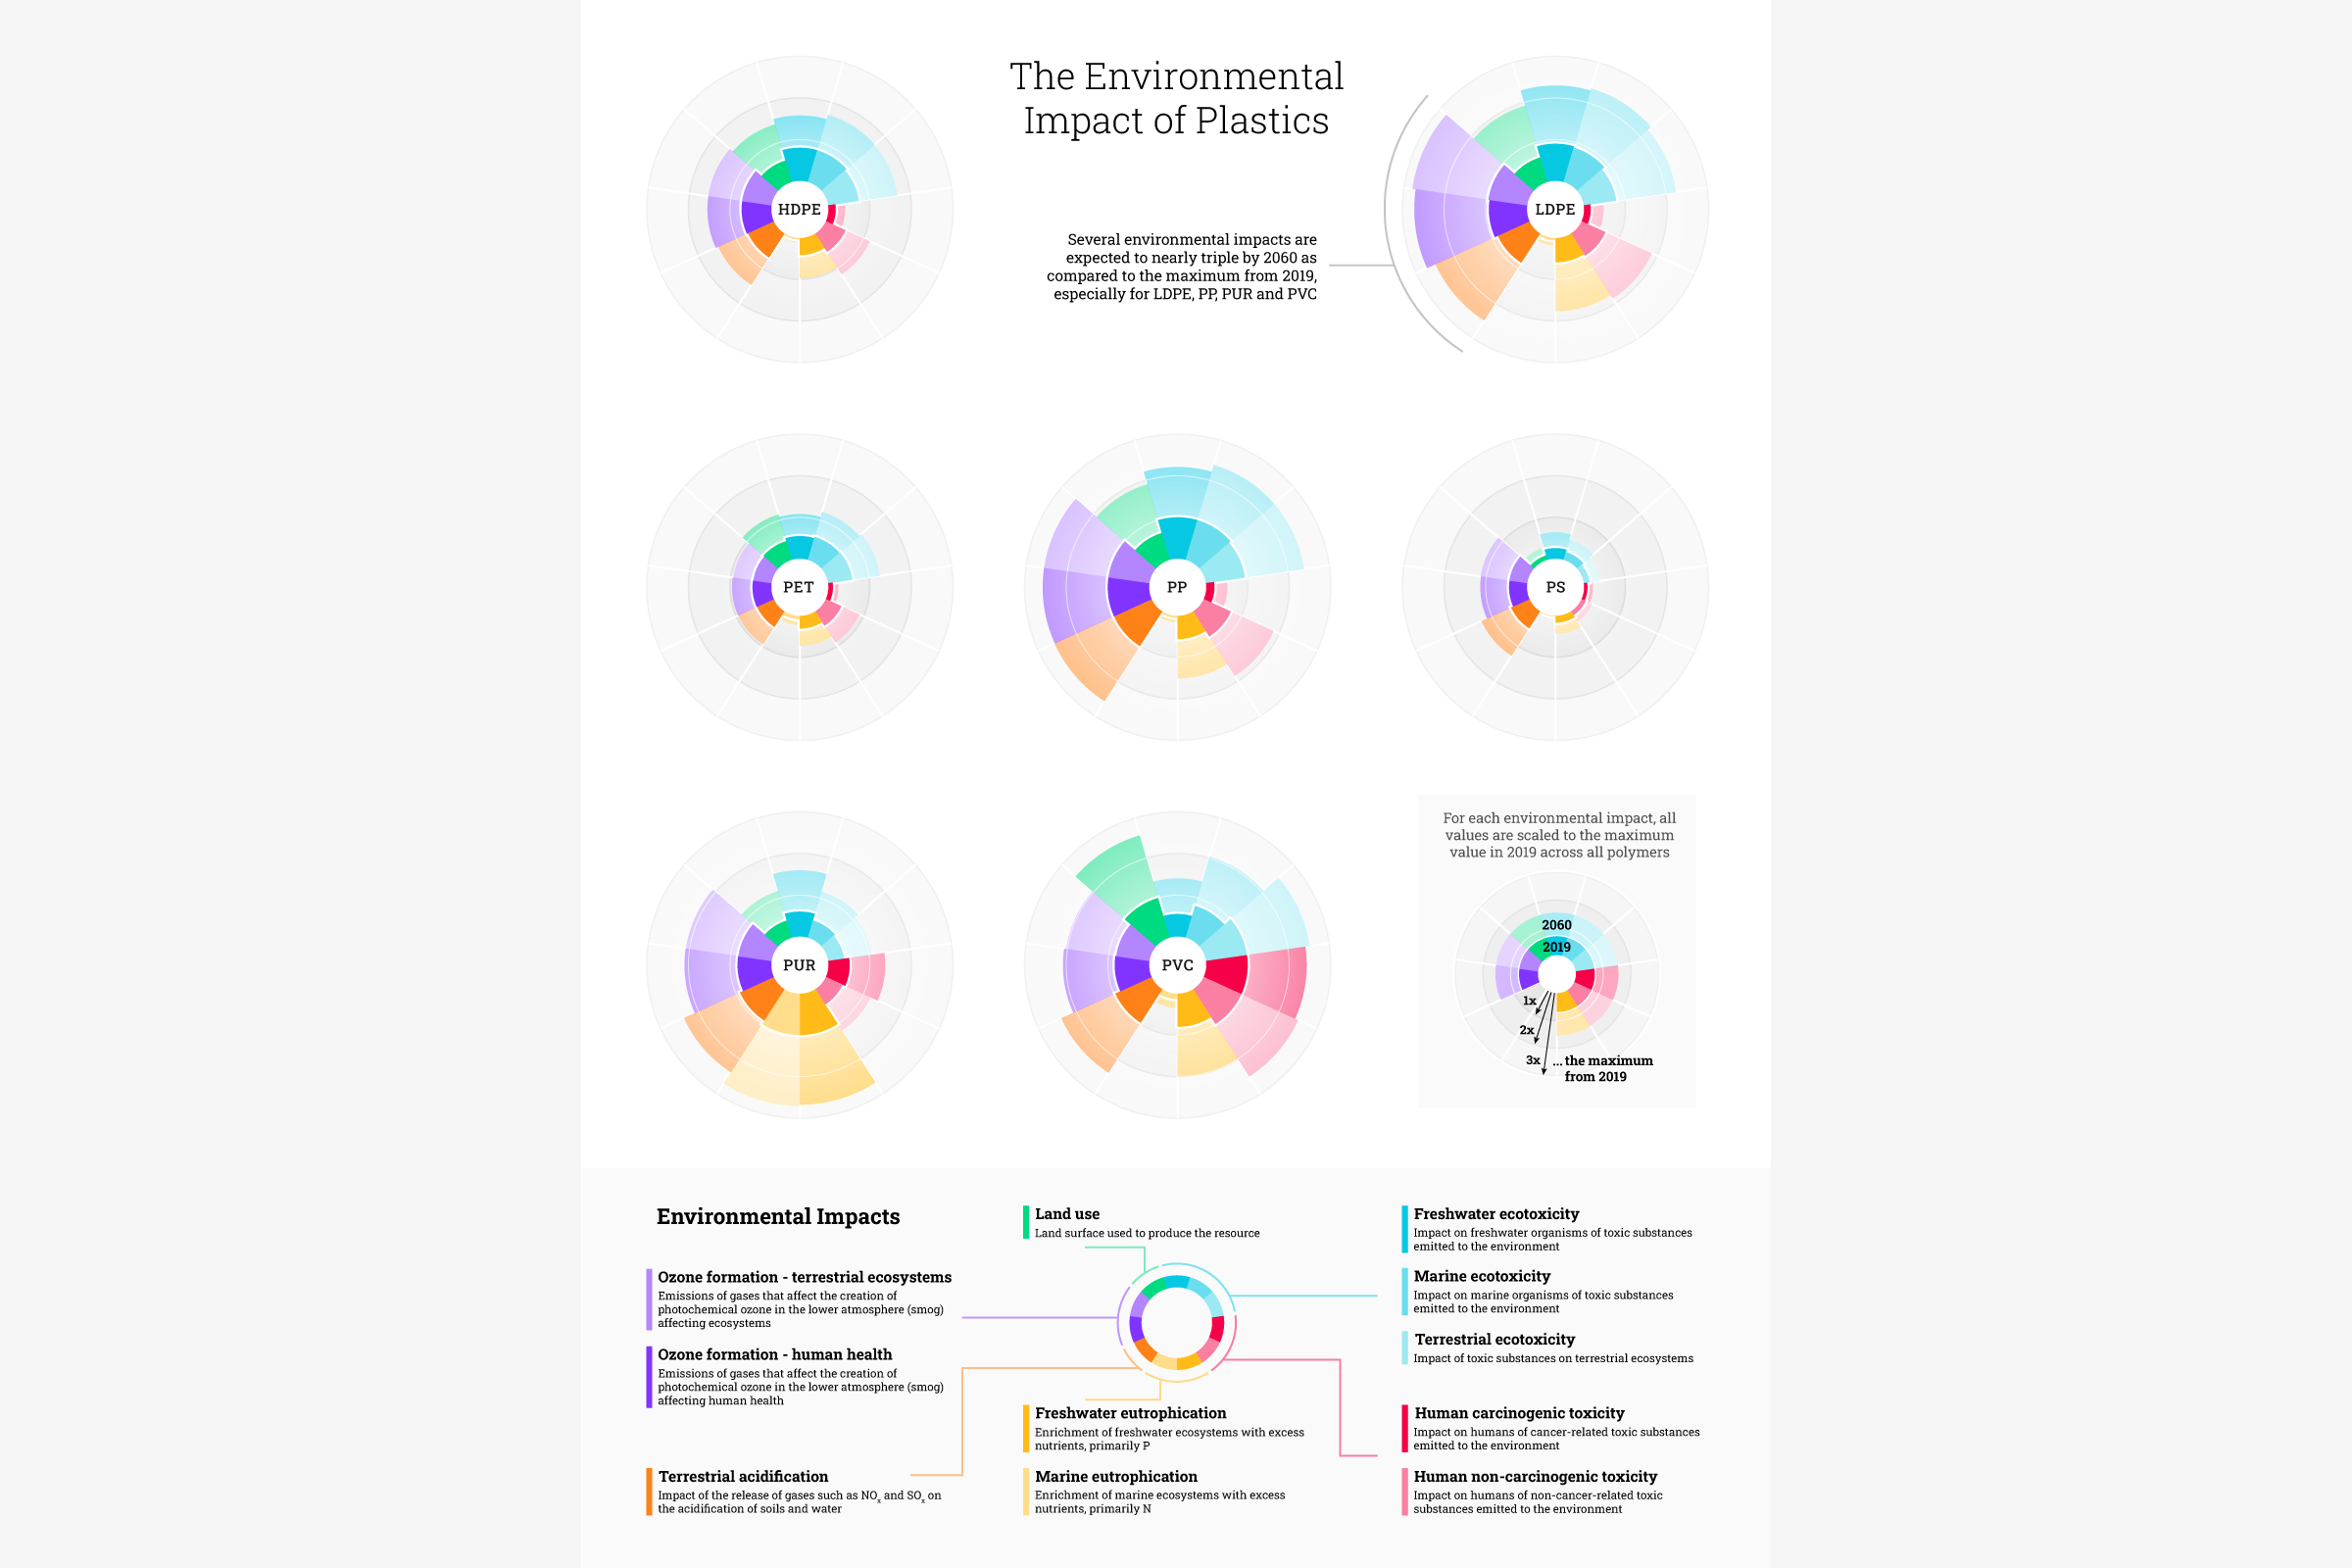
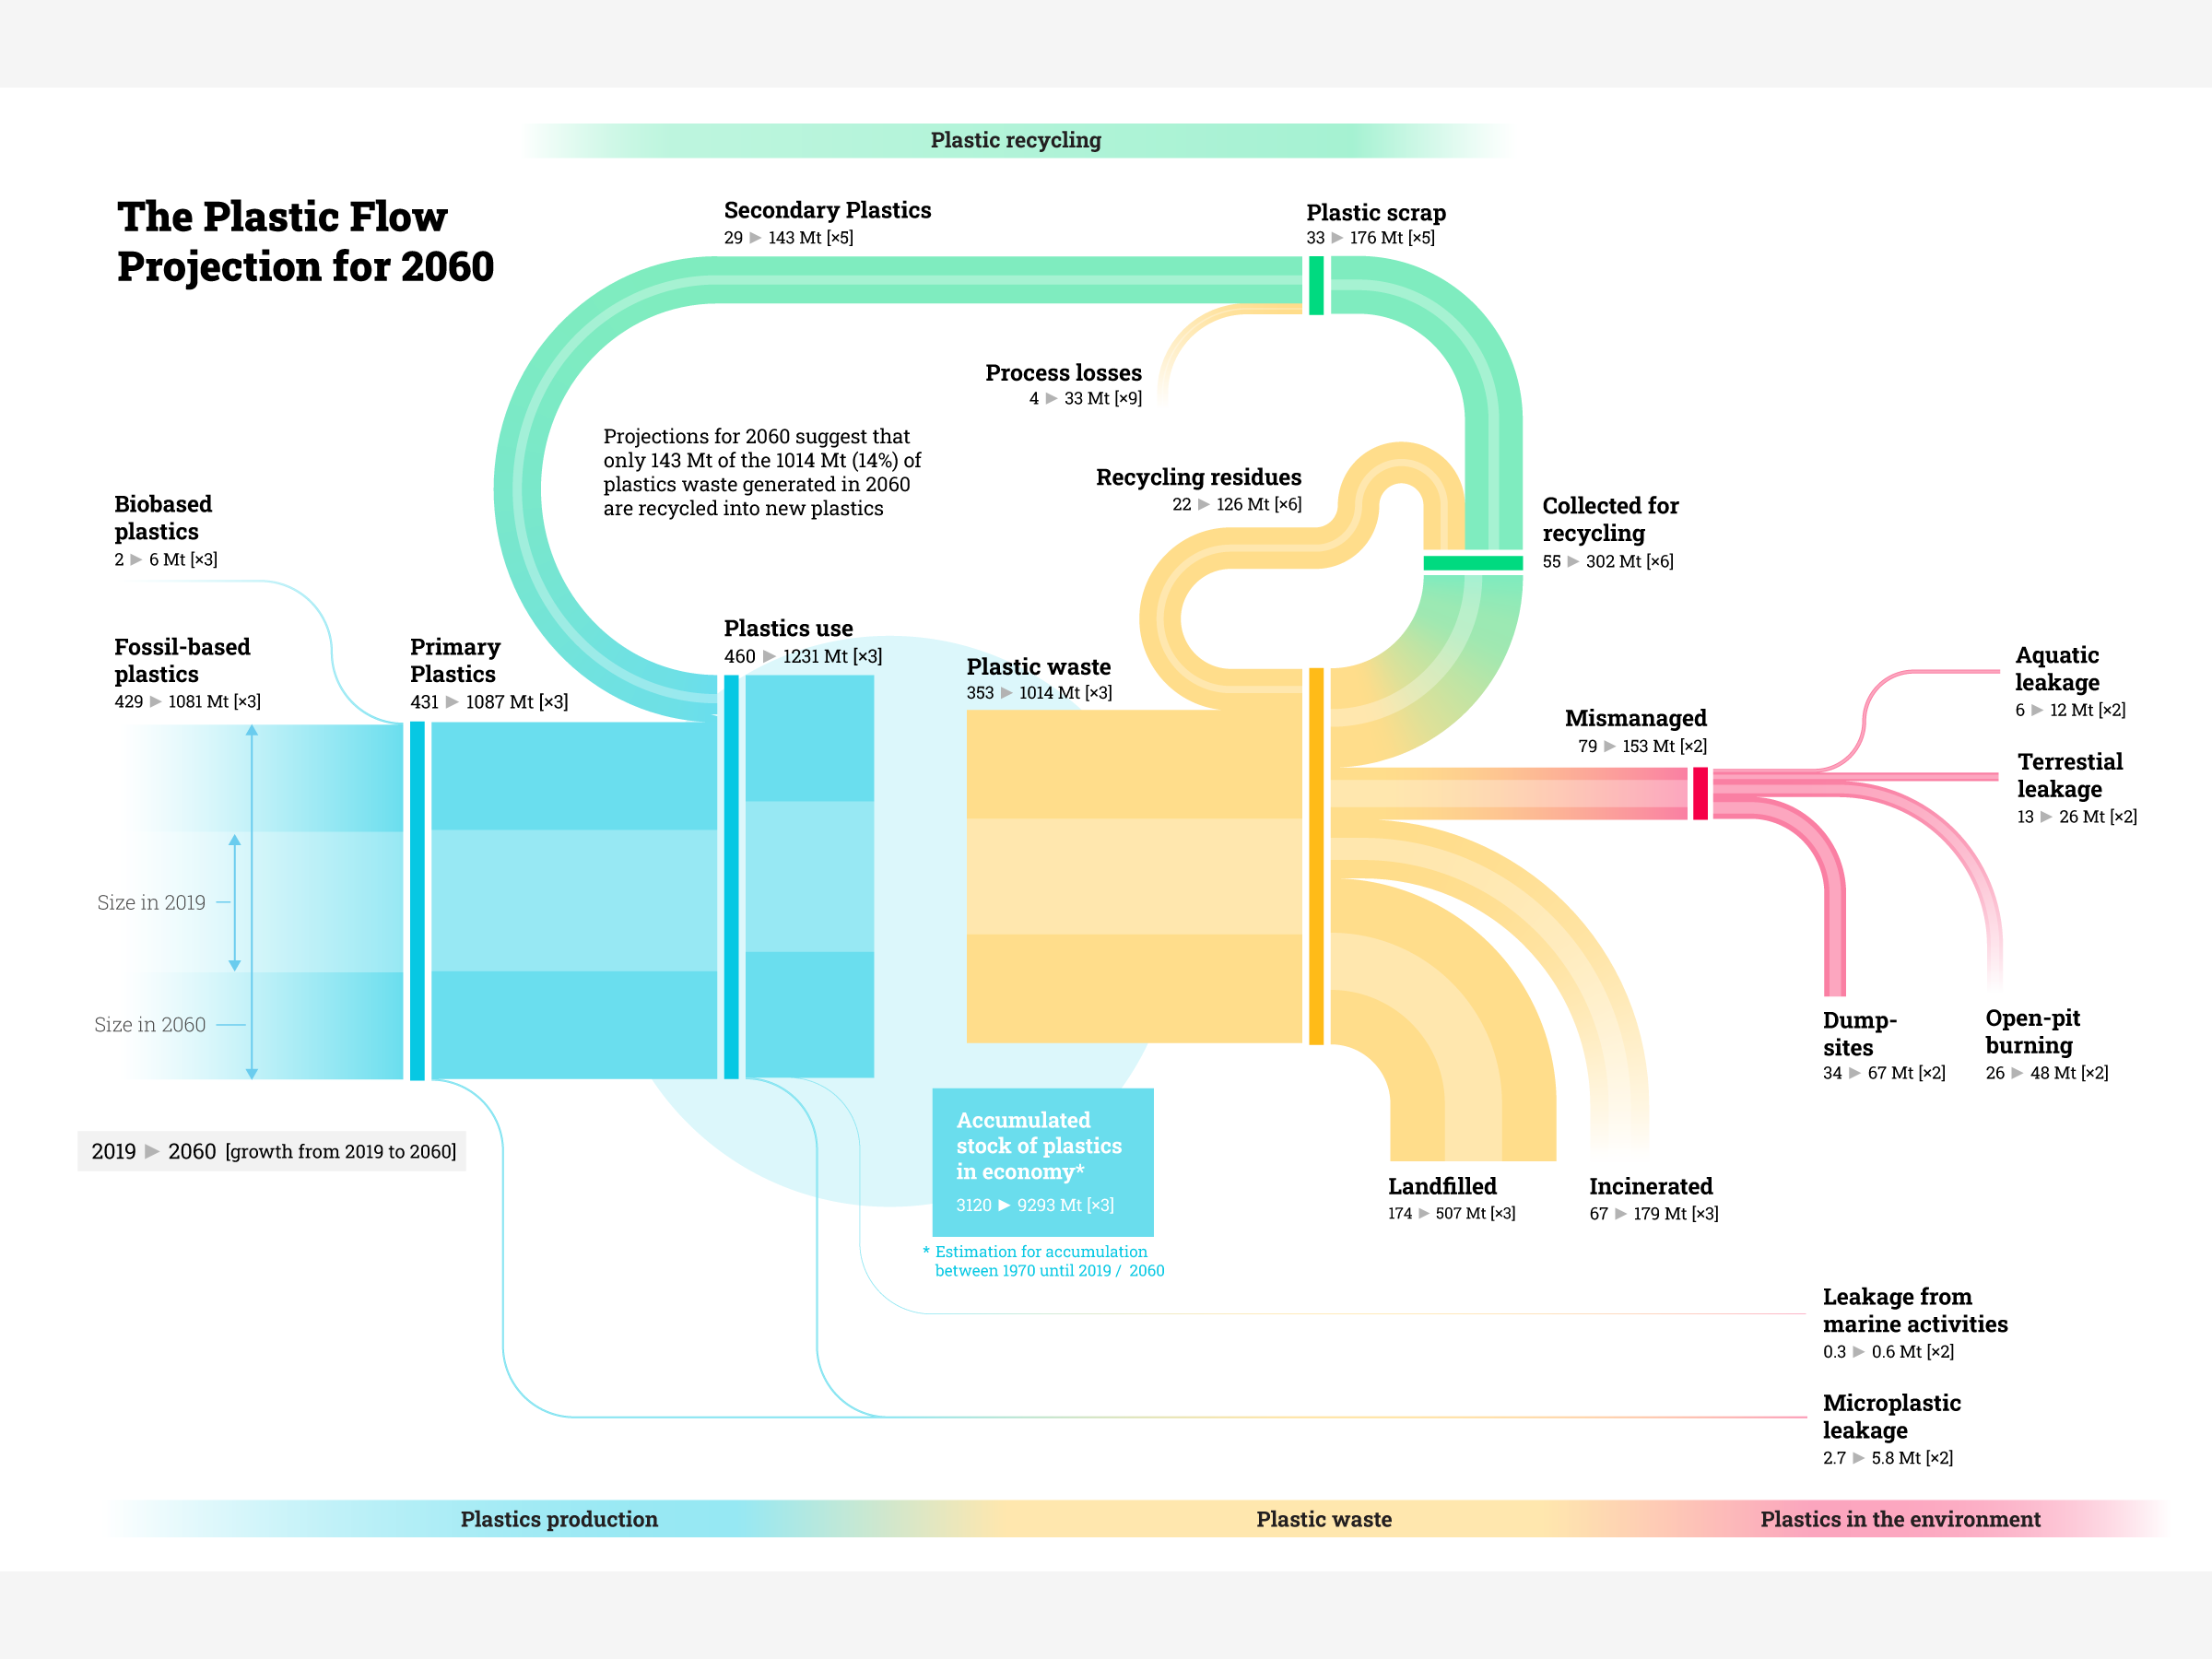
For the Global Plastics Outlook published by the OECD in June of 2022 I was asked to create 4 of the visualizations. About the flow of plastics in 2019 and how it would grow to 2060, visualizing the leakage into our rivers and oceans of plastic, about the life cycle analysis of several polymers, and the change in GDP for all countries between 2019 and 2060.
I was asked to tackle the four visuals from the report that the client felt were the most difficult to handle, such as showing a flow while also being able to compare two years.
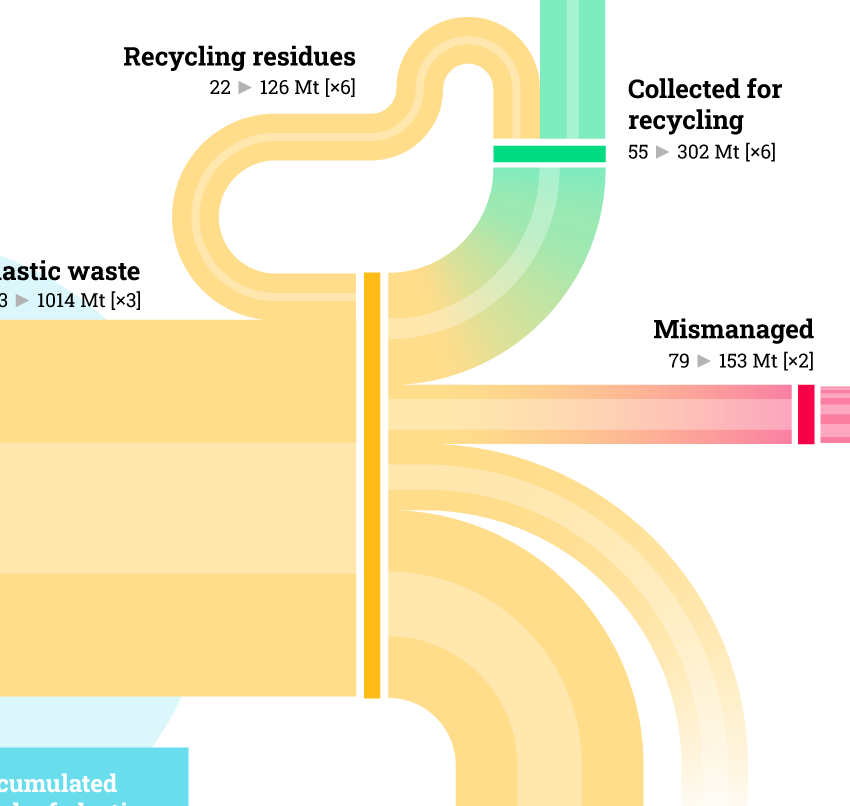
Usually I create all of my visuals with code. However, I realized that the plastic flow visual, the Sankey diagram in there, would have too many nuances in it. It would make it extremely time consuming to adjust any programming to handle all of these. Therefore, I created the flow visual manually in Adobe Illustrator.
You can find all four of the visuals that I created in the Global Plastics Outlook, which are figures 1.2, 1.7, 1.8 & 6.6 (these have been somewhat adjusted from the files I supplied to fit with the layout and design of the full report).