“Searching for Birds” is an interactive data storytelling project created for Google Trends that transforms millions of search queries into a visually rich exploration of how people connect with birds. Combining Google Trends data with various public datasets, I designed a fully bespoke visual language of illustrated birds, playful metaphors, and custom interactive charts that invite users to explore patterns across nearly 700 species. It blends rigorous analysis, crafted illustration, and thoughtful UX to turn complex data into an engaging, memorable experience for both birders and anybody even remotely interested in birds.
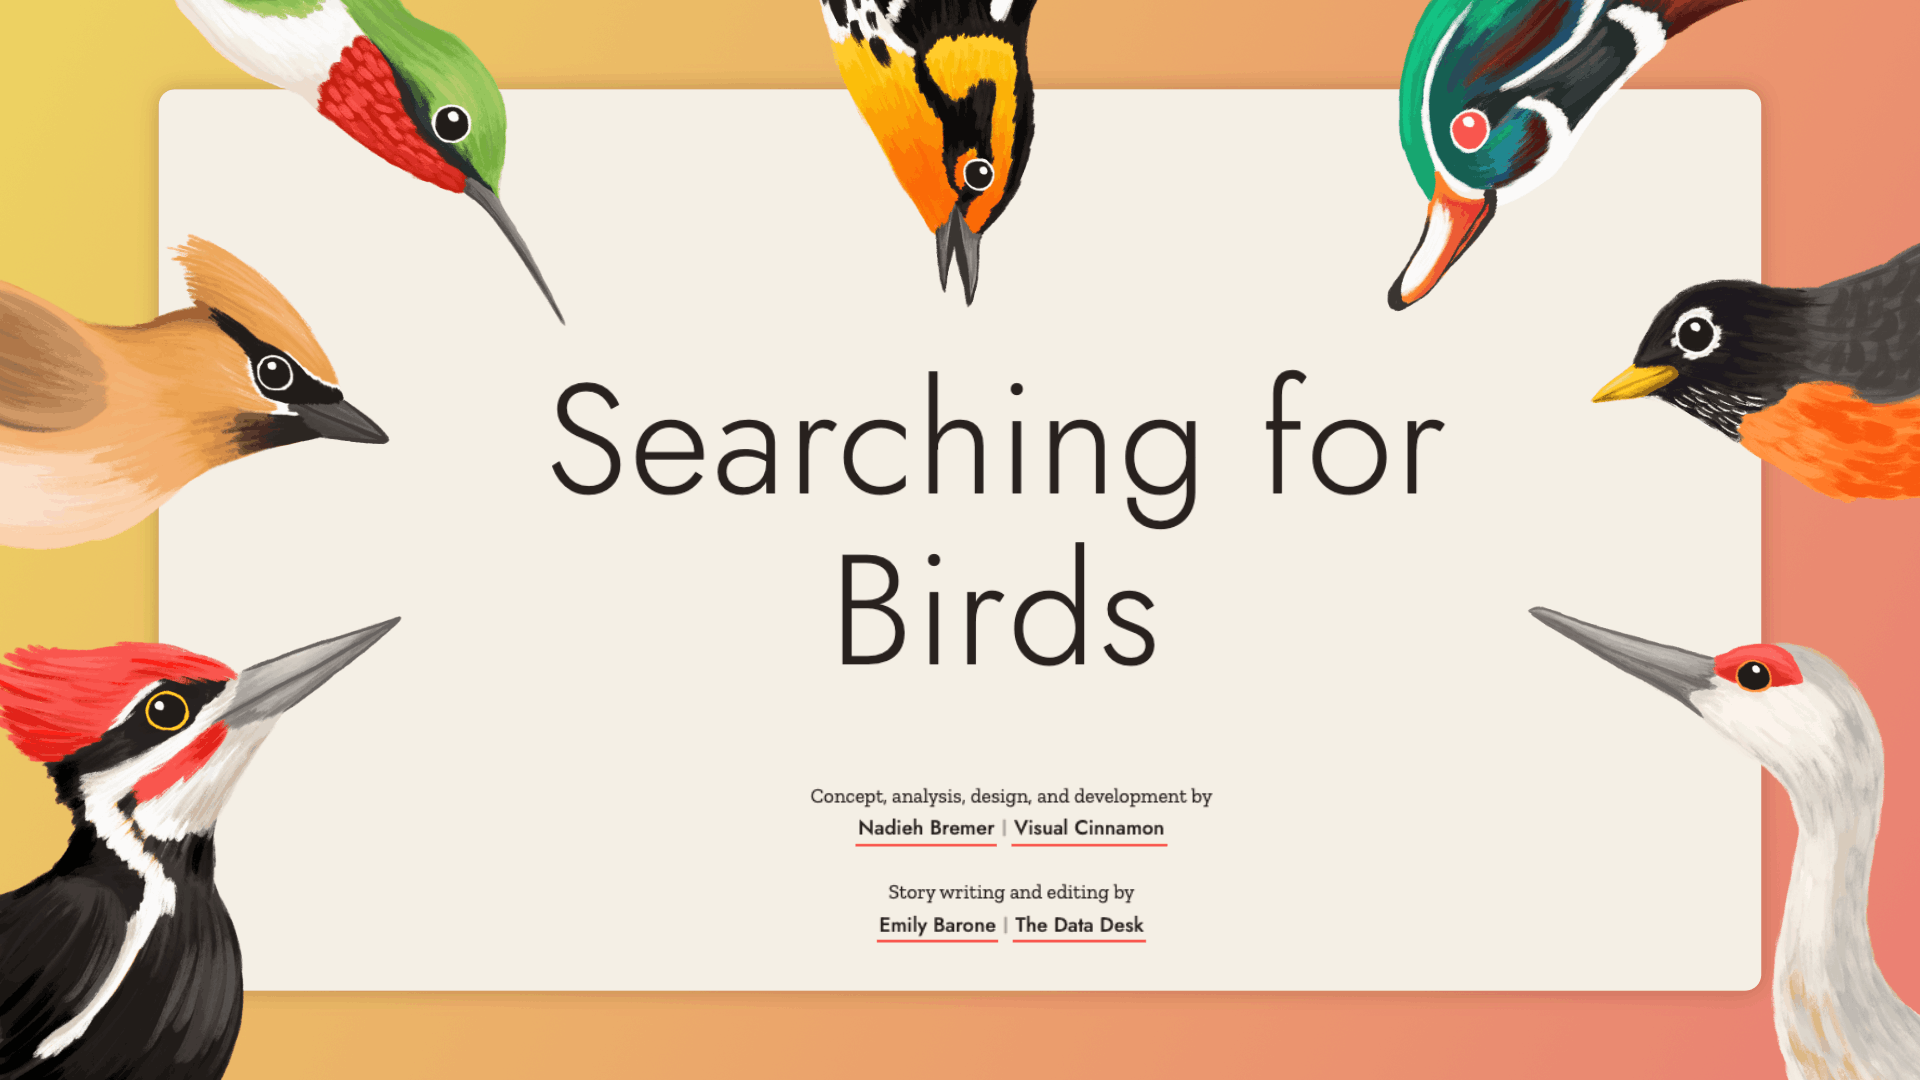
“Searching for Birds” was created for Google Trends with a clear design challenge: how can abstract search data be transformed into a visually rich, immersive experience that invites exploration rather than passive consumption?
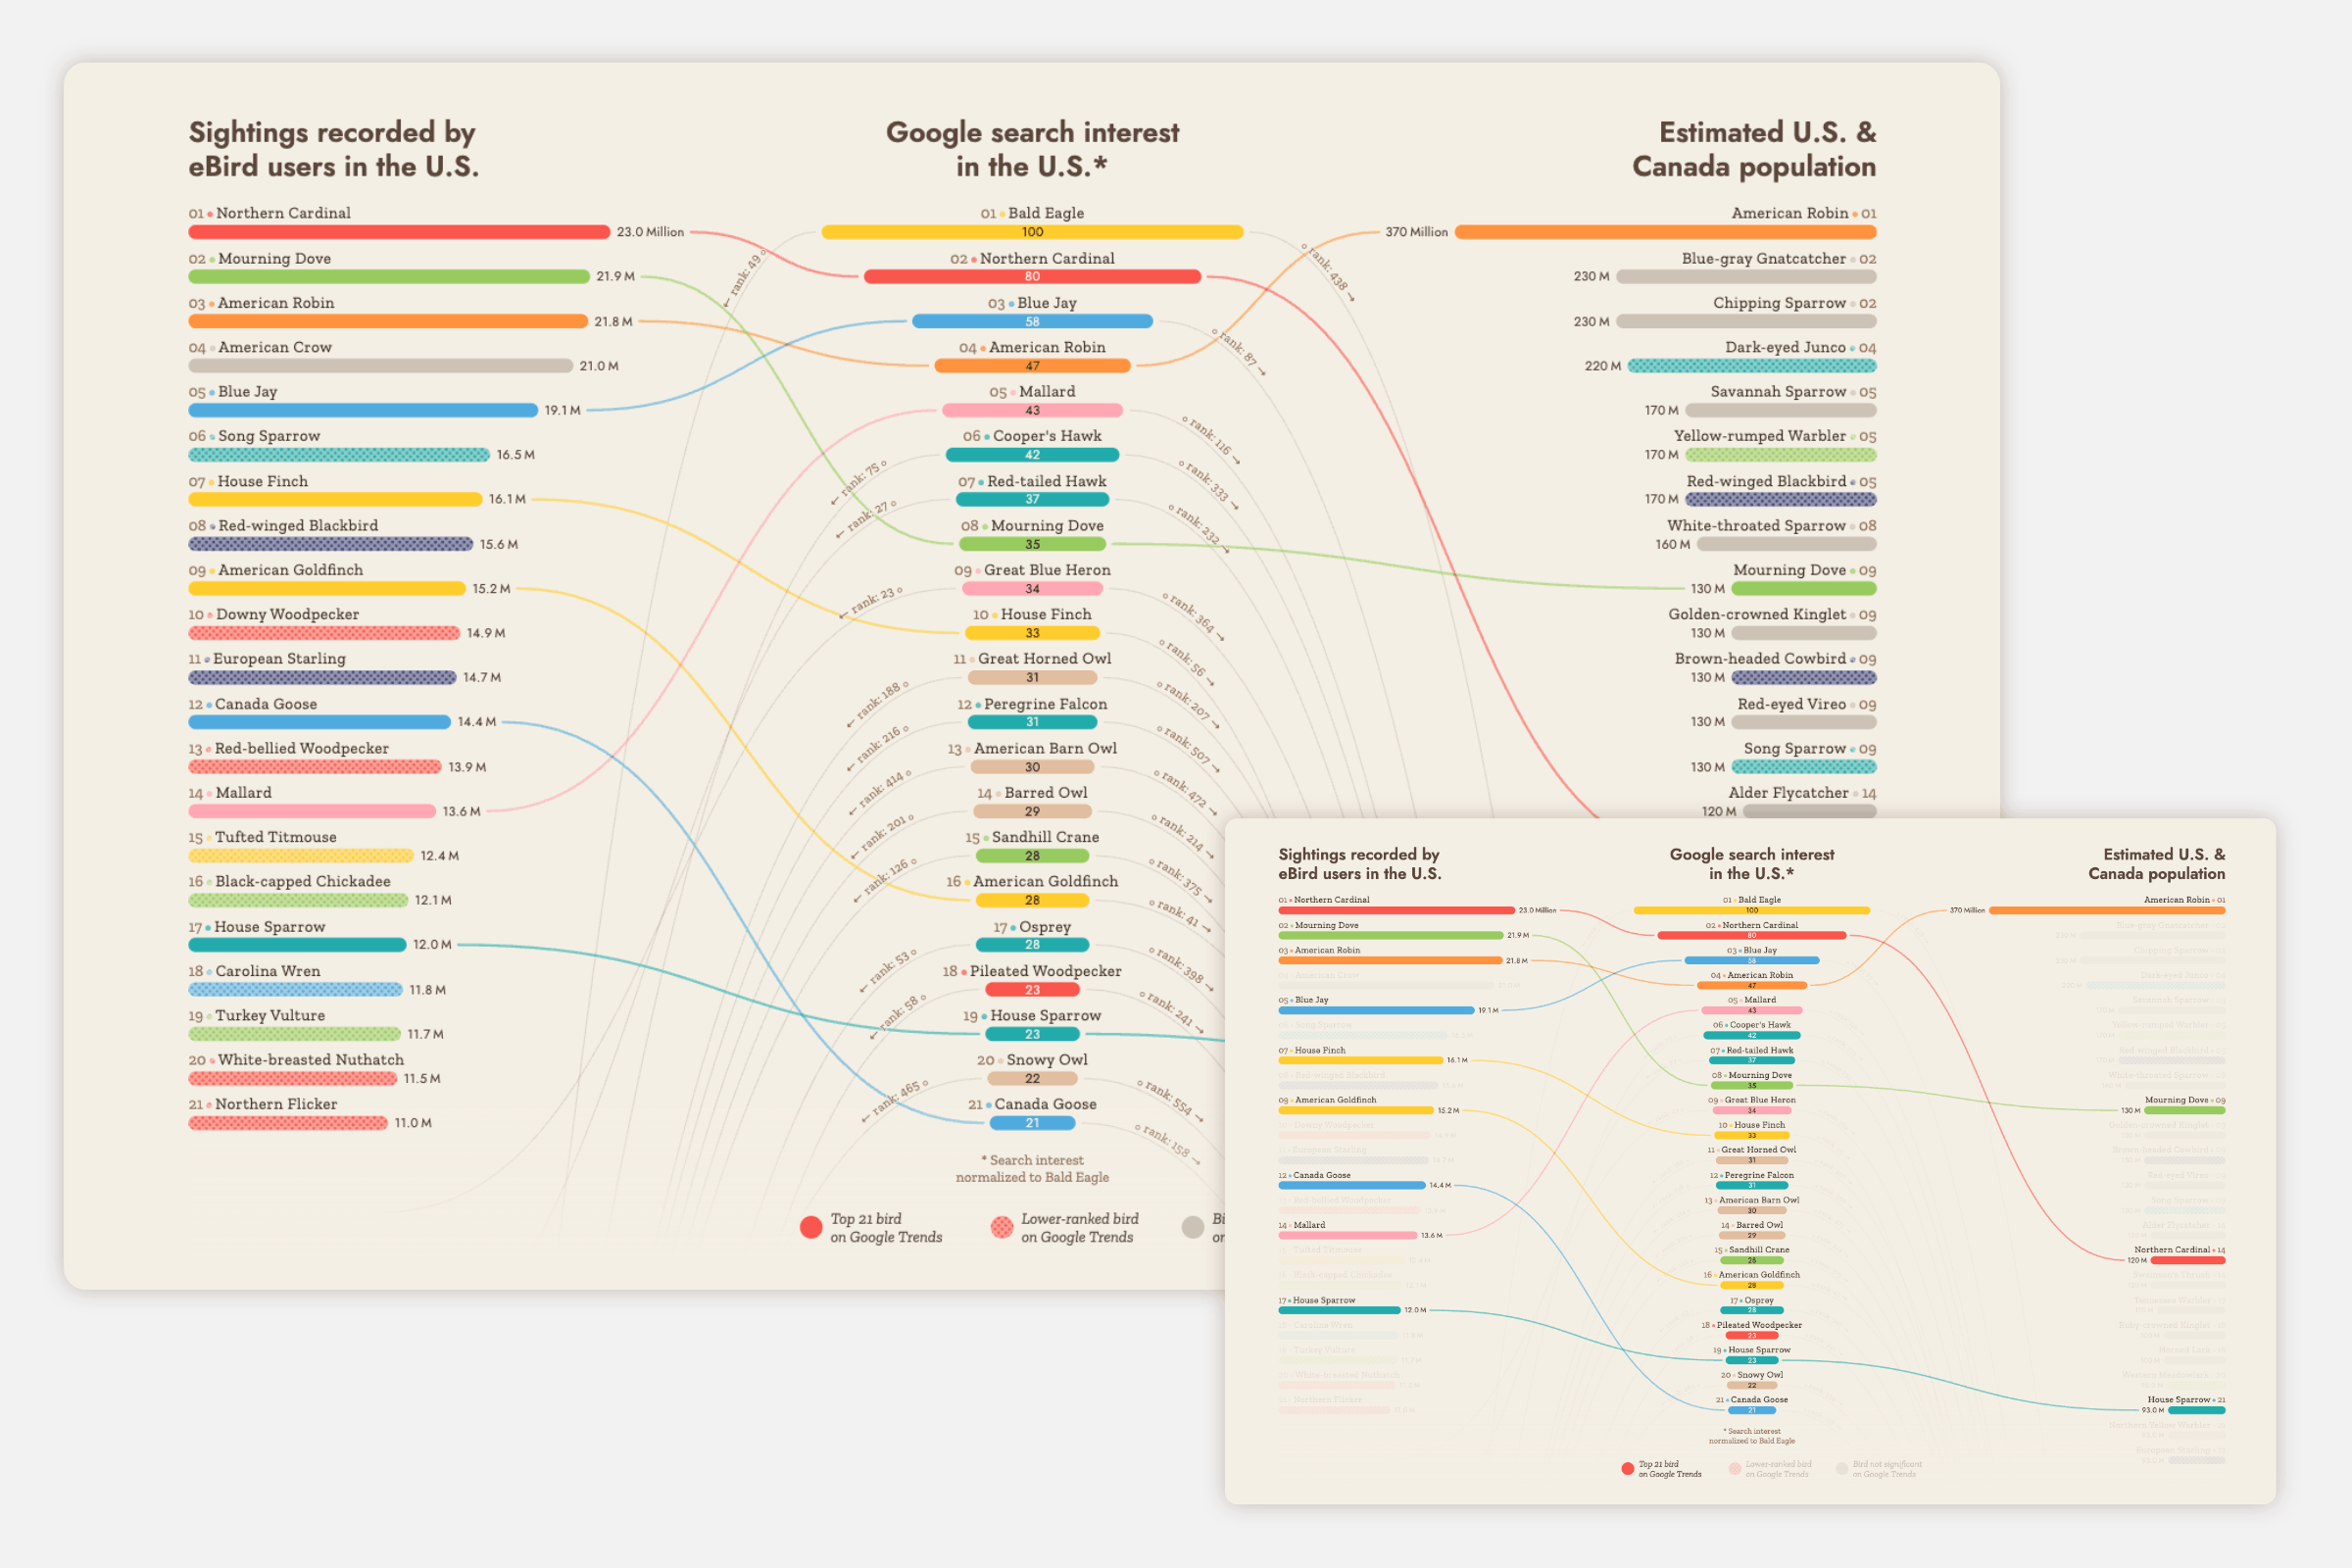
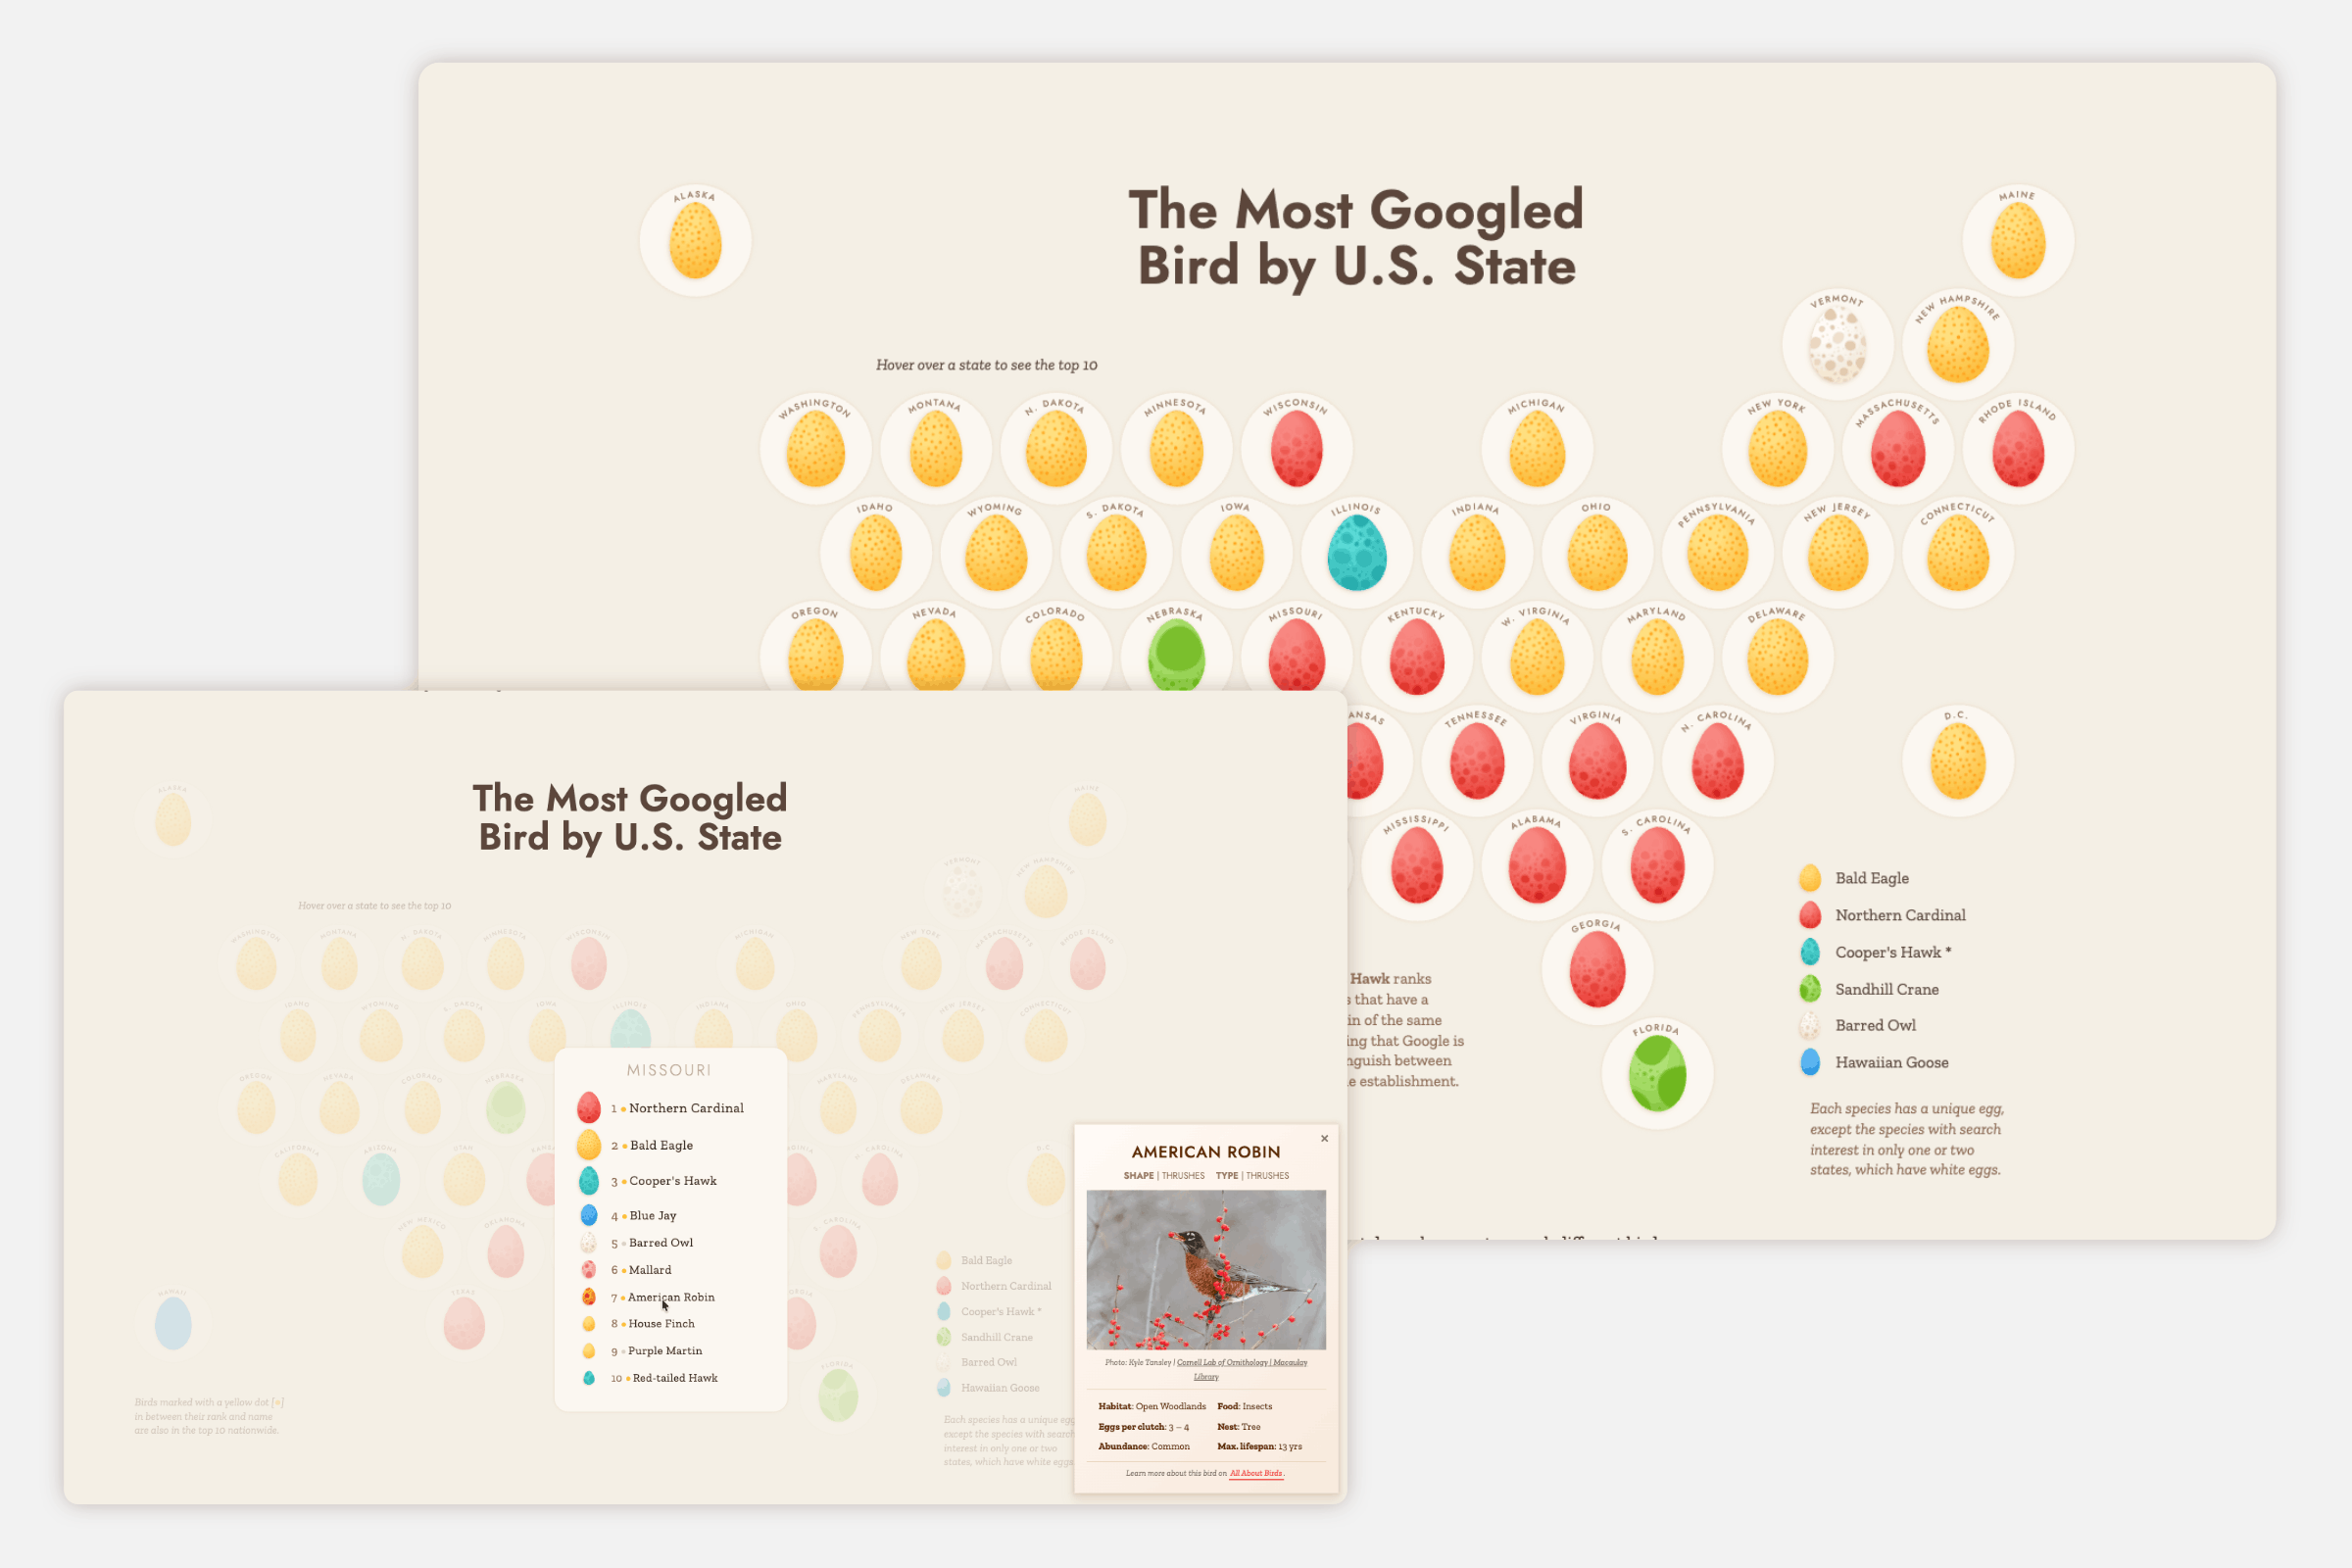
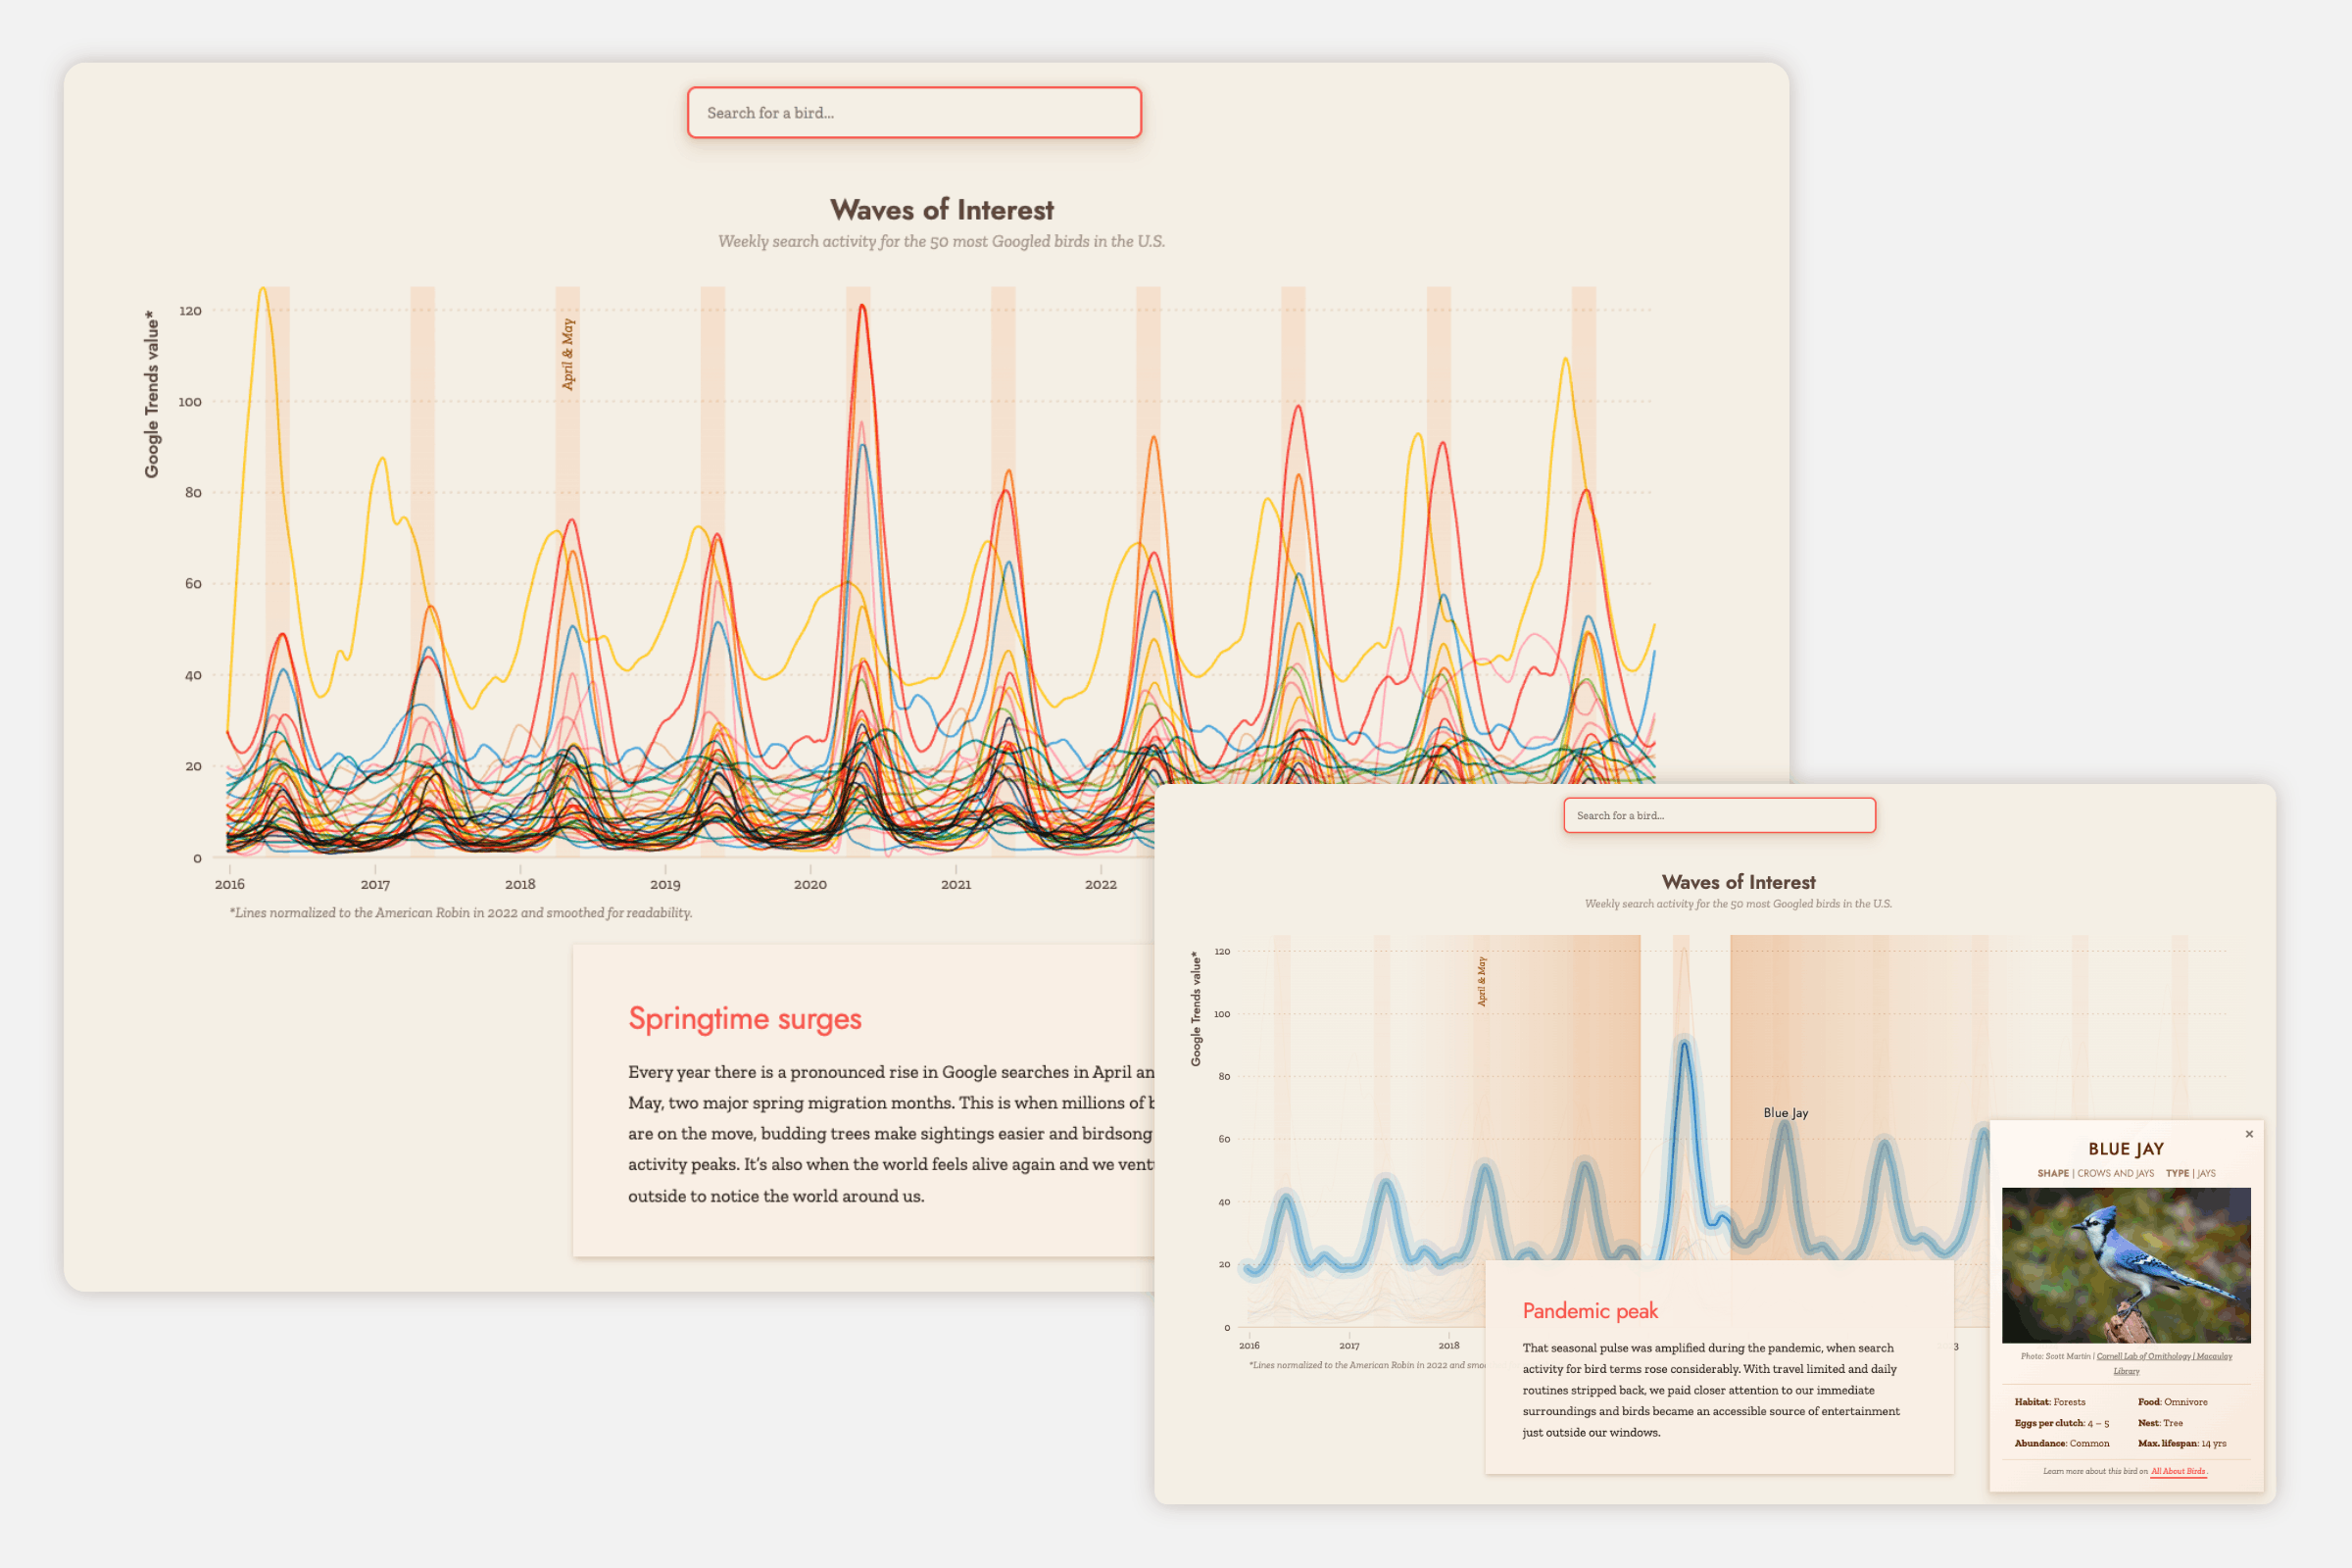
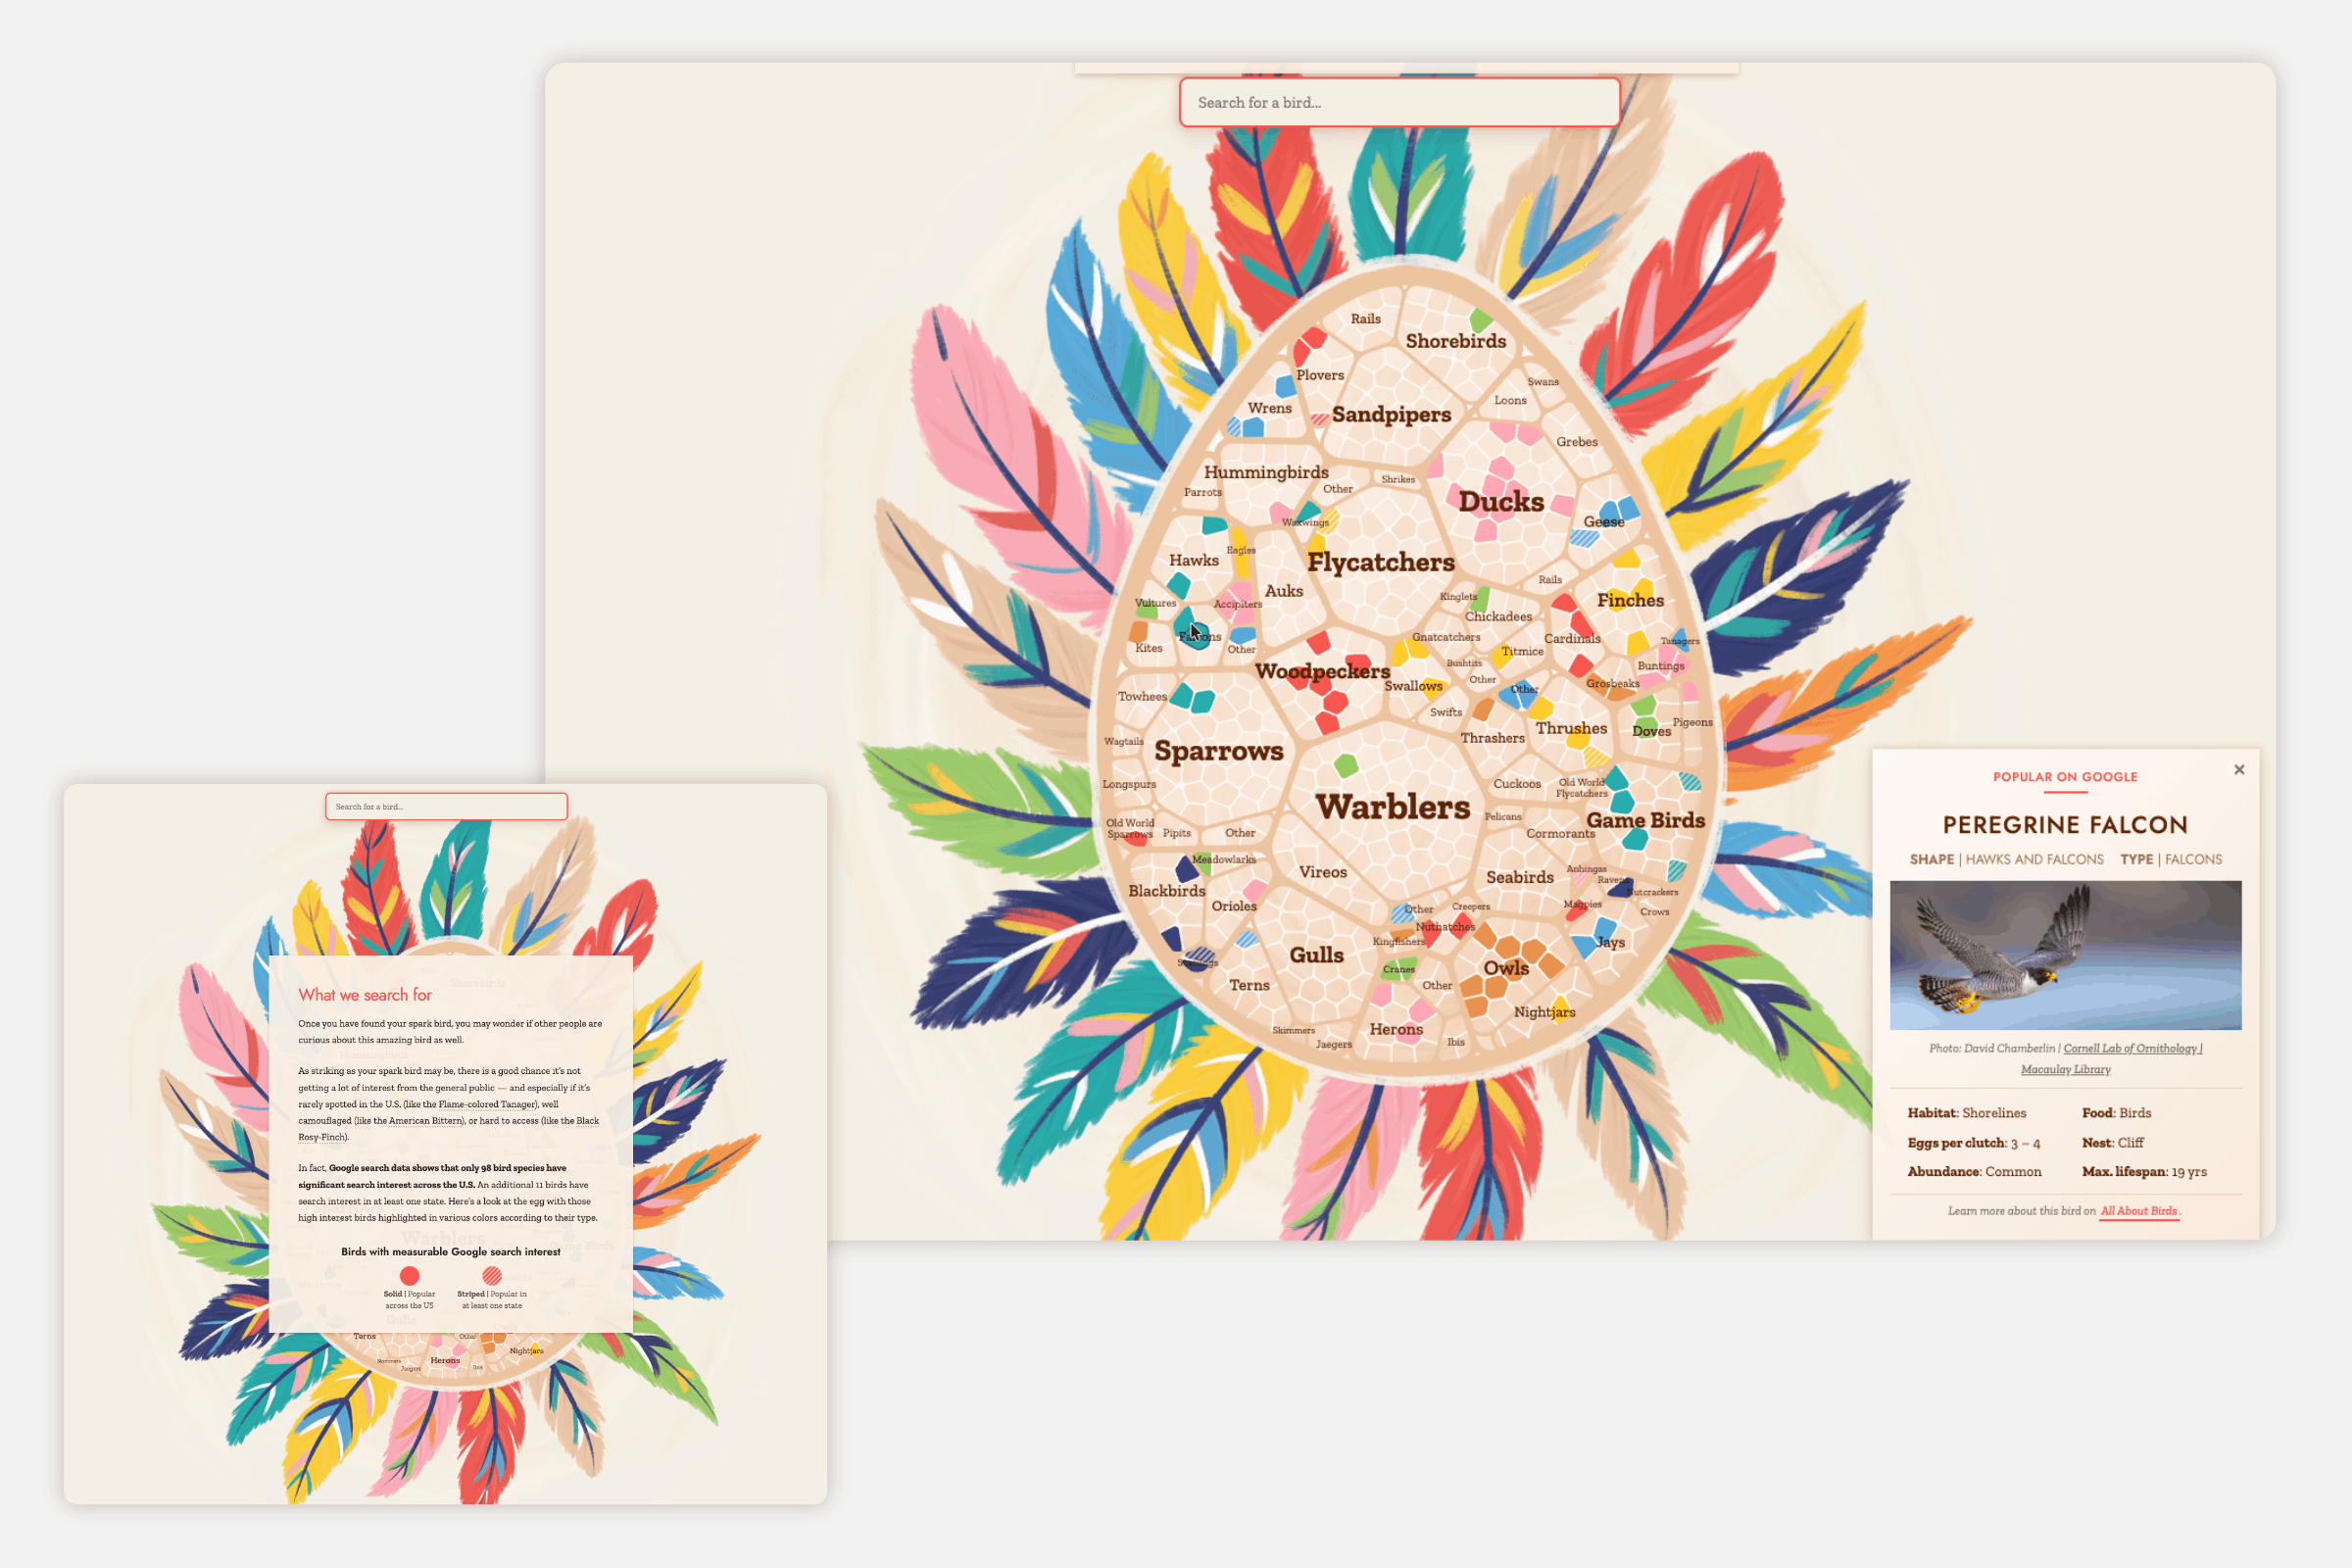
The project analyzes large-scale Google Trends data, enriched with various publicly available bird-related datasets such as eBird sightings and population counts, to reveal how people connect with birds through curiosity and search behavior. Instead of presenting this information through conventional charts or dashboards, I developed a fully bespoke visual language that merges data visualization with illustration.
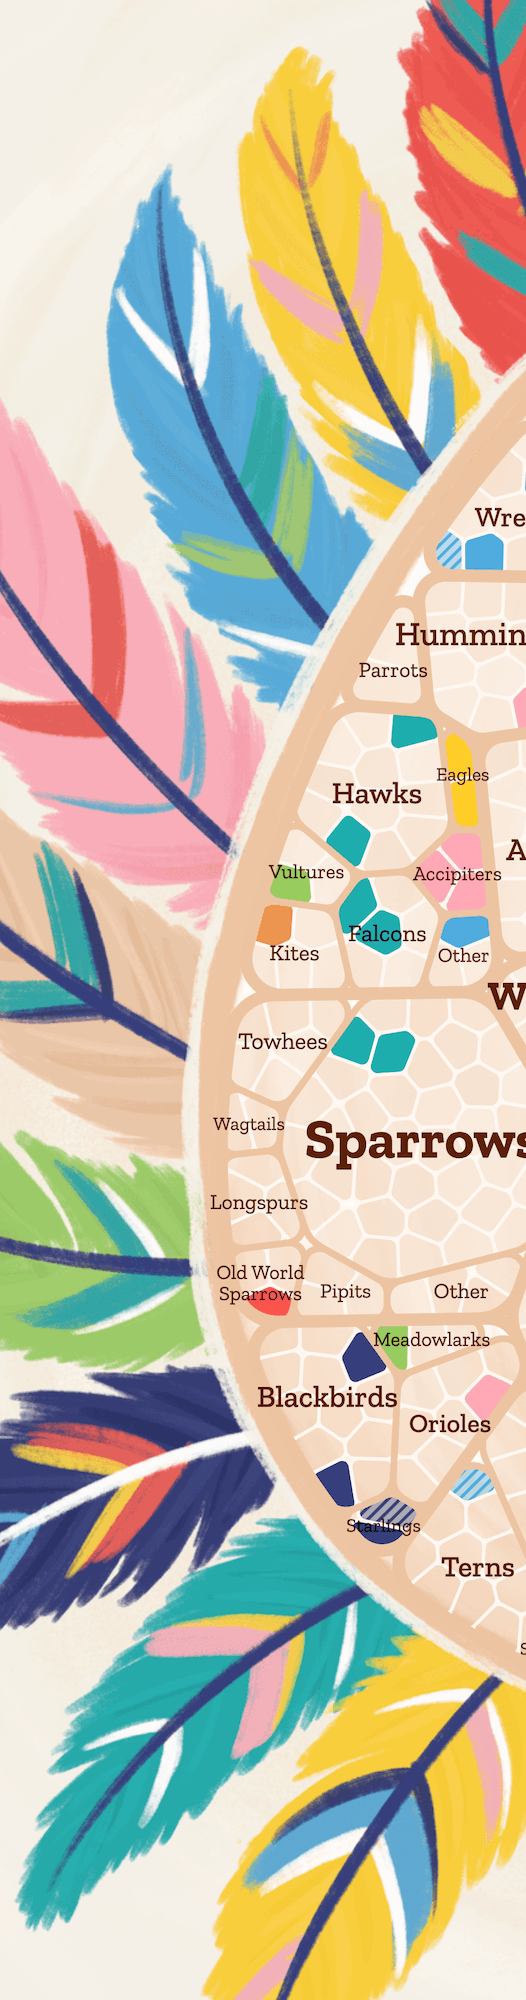
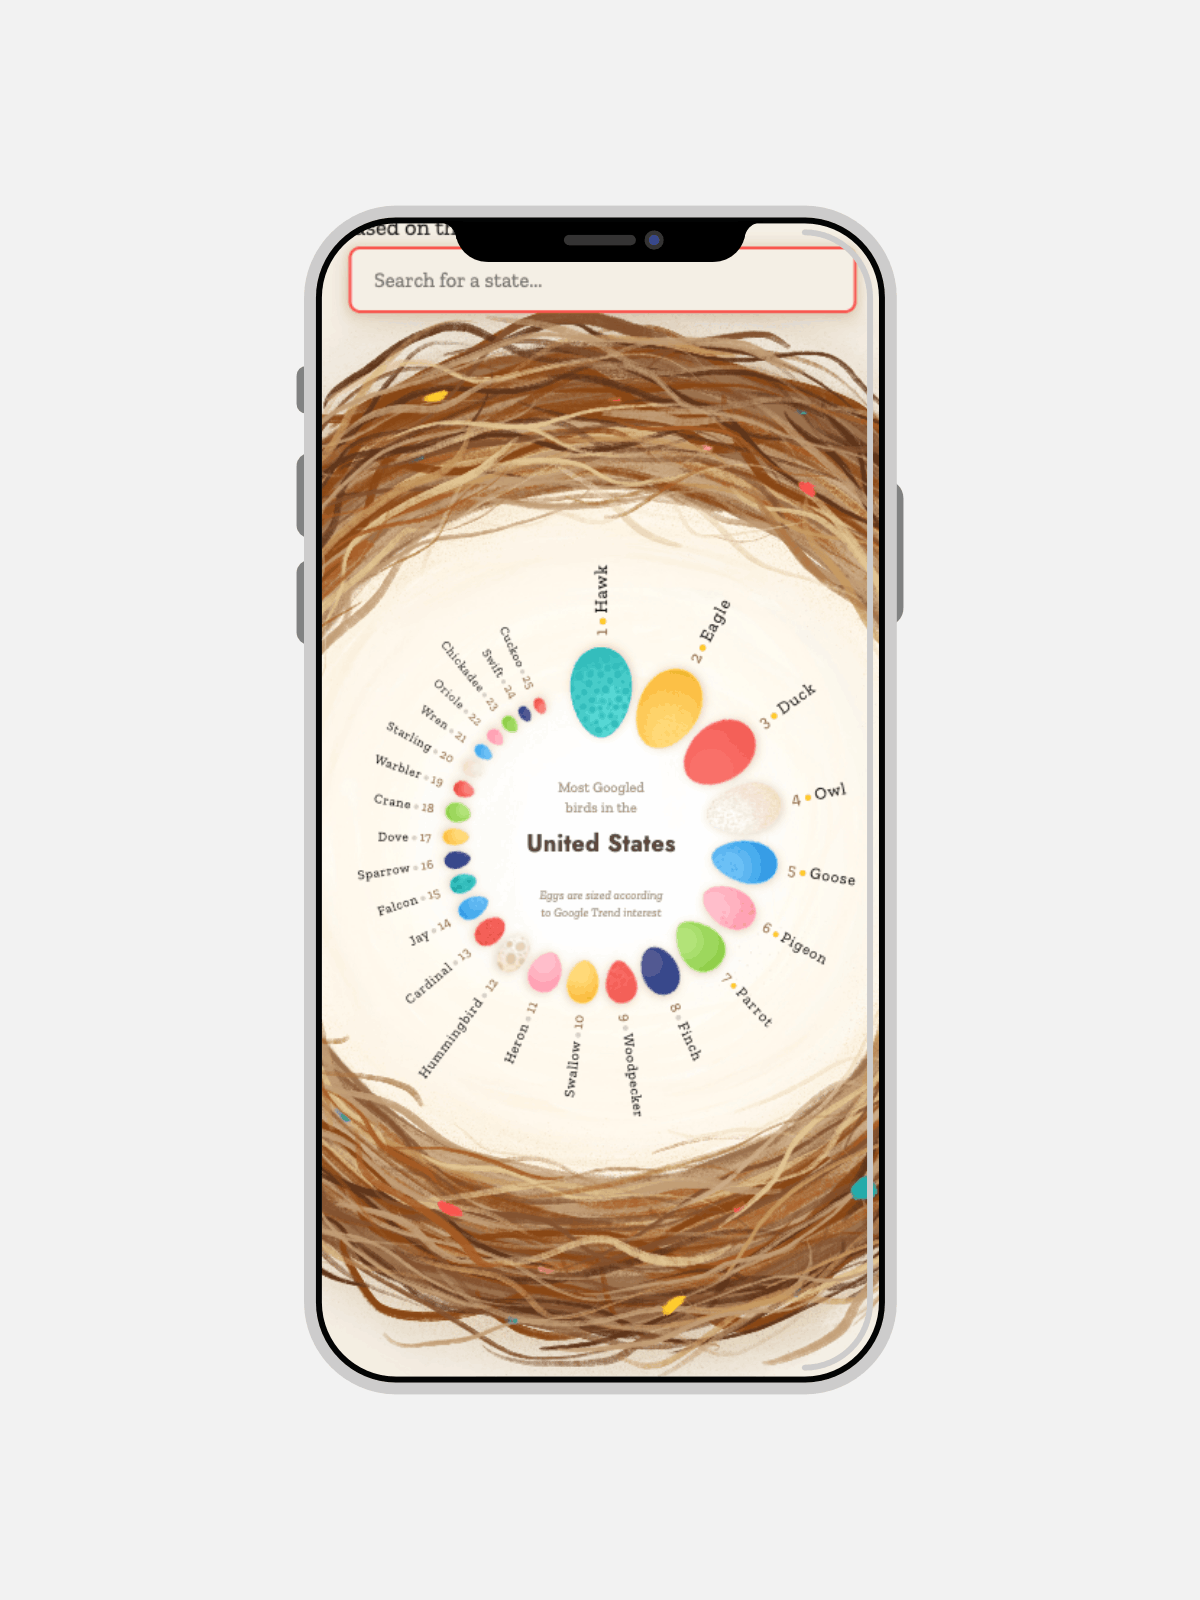
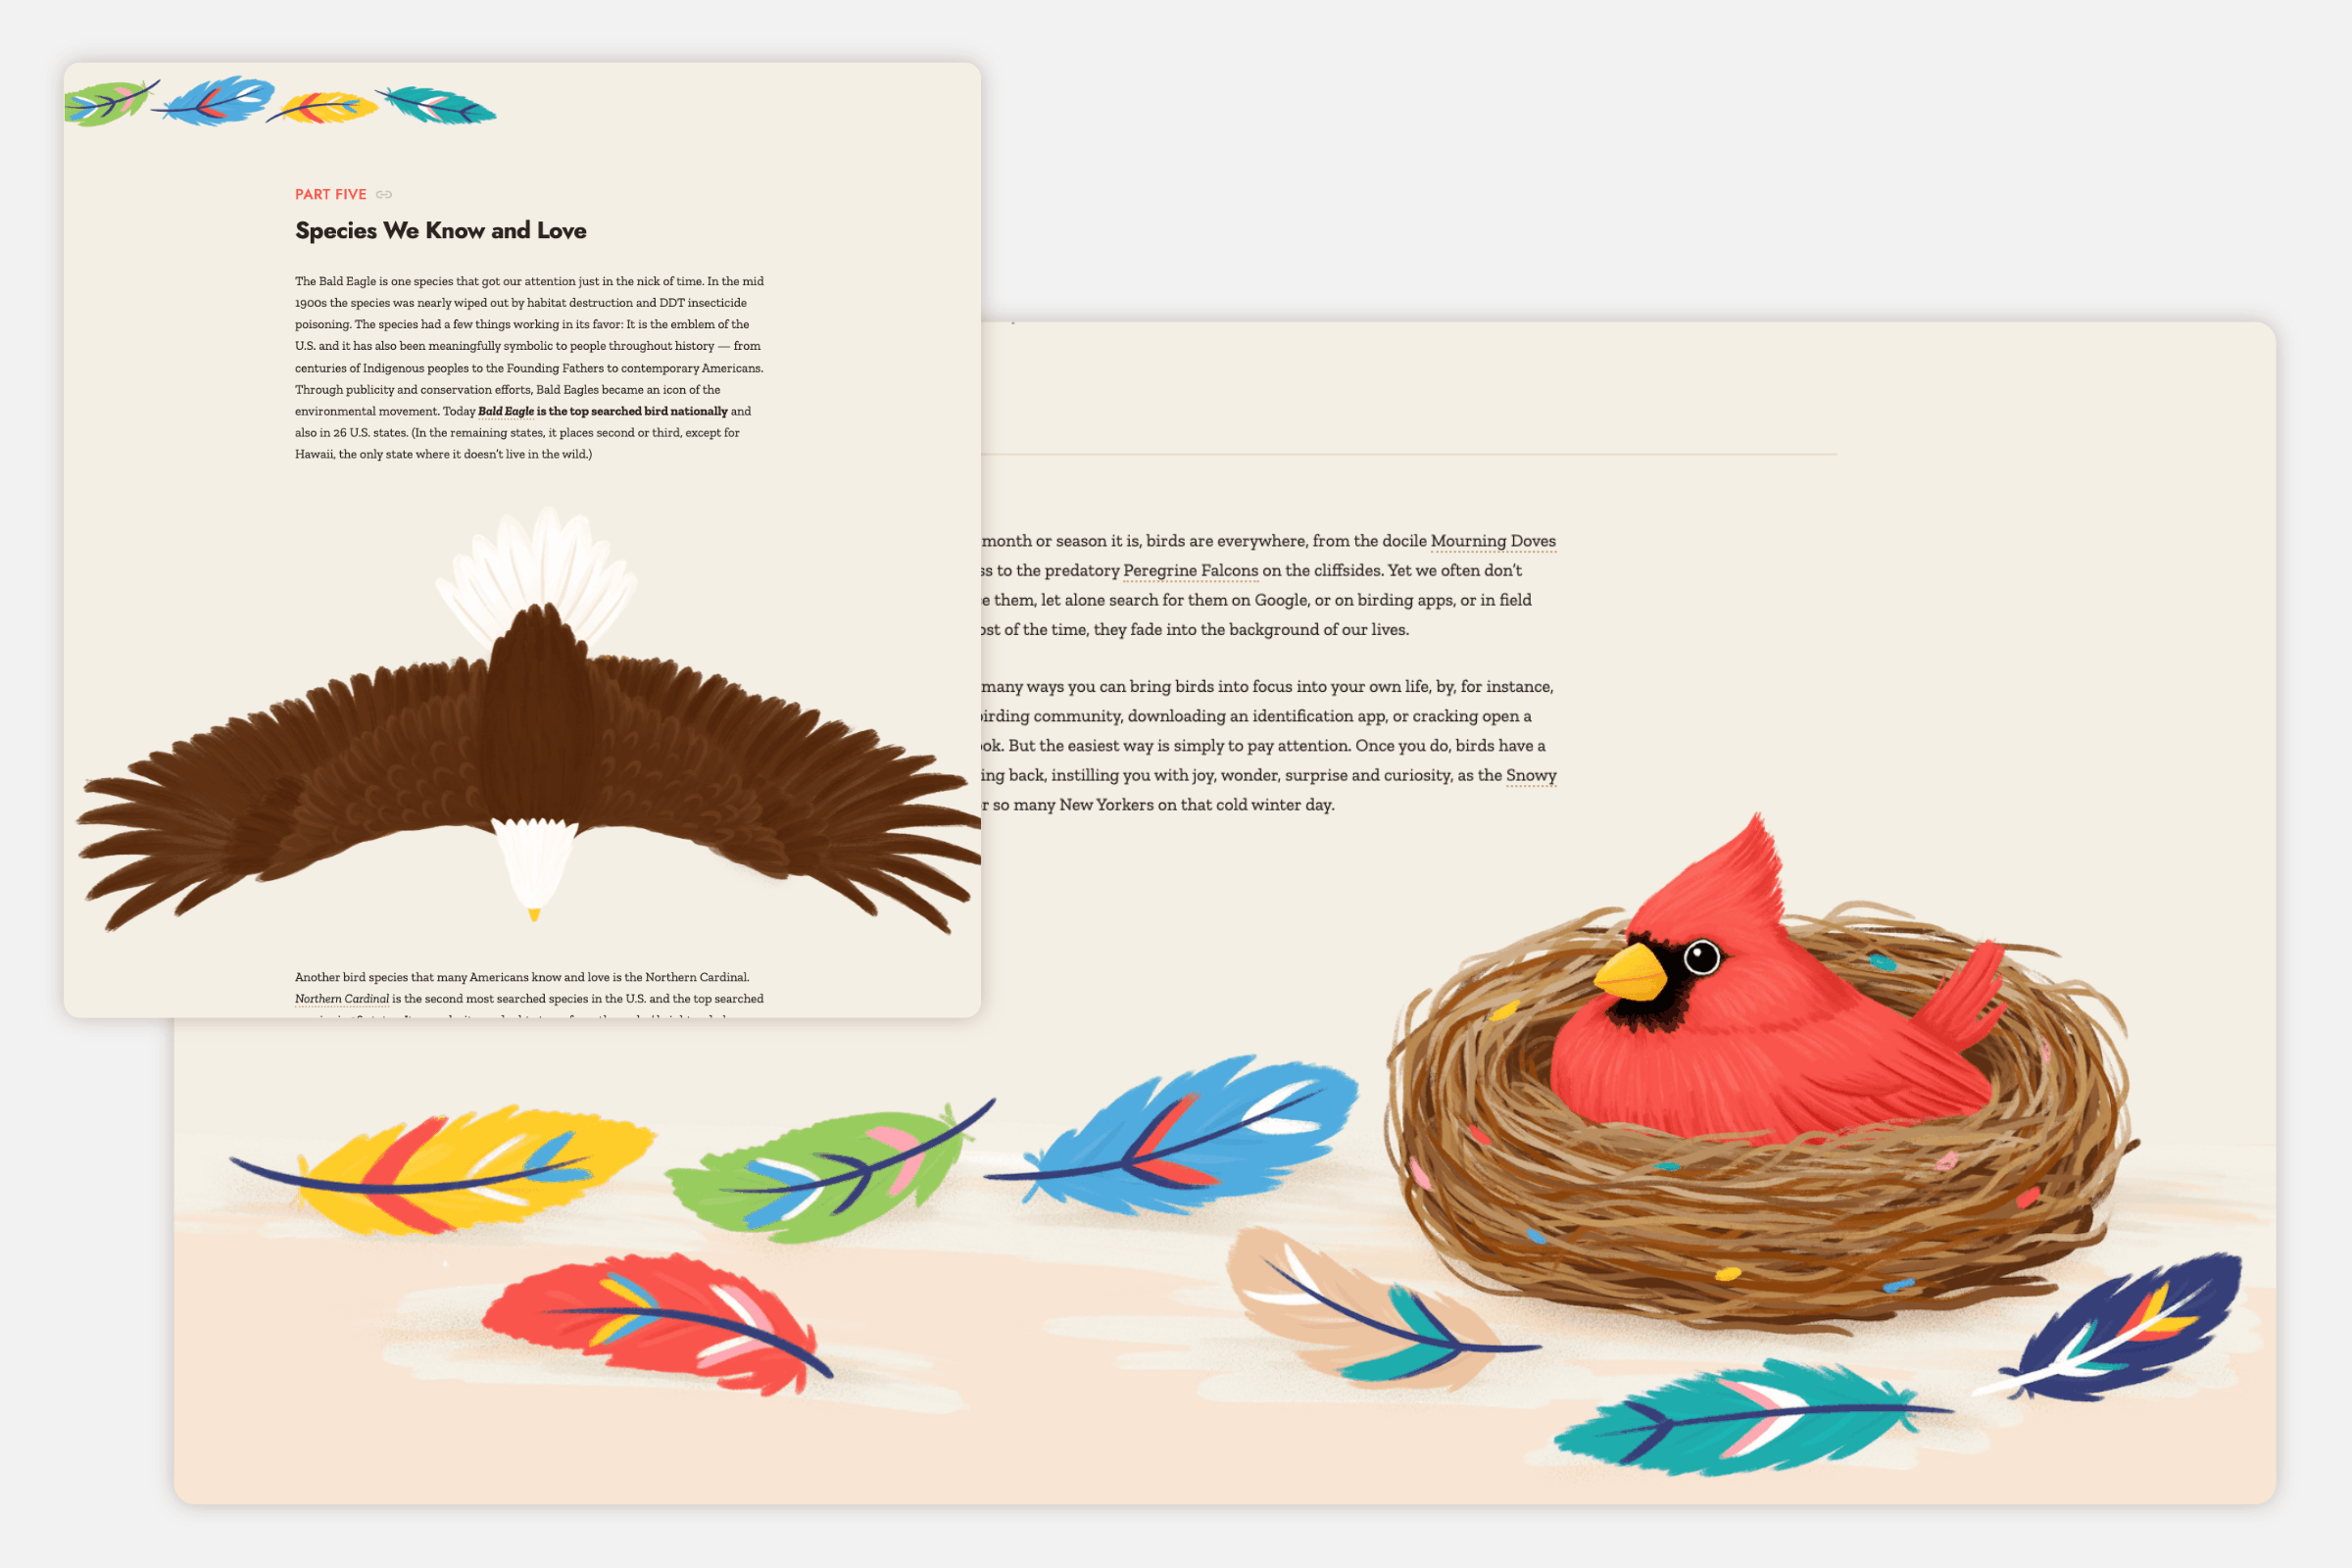
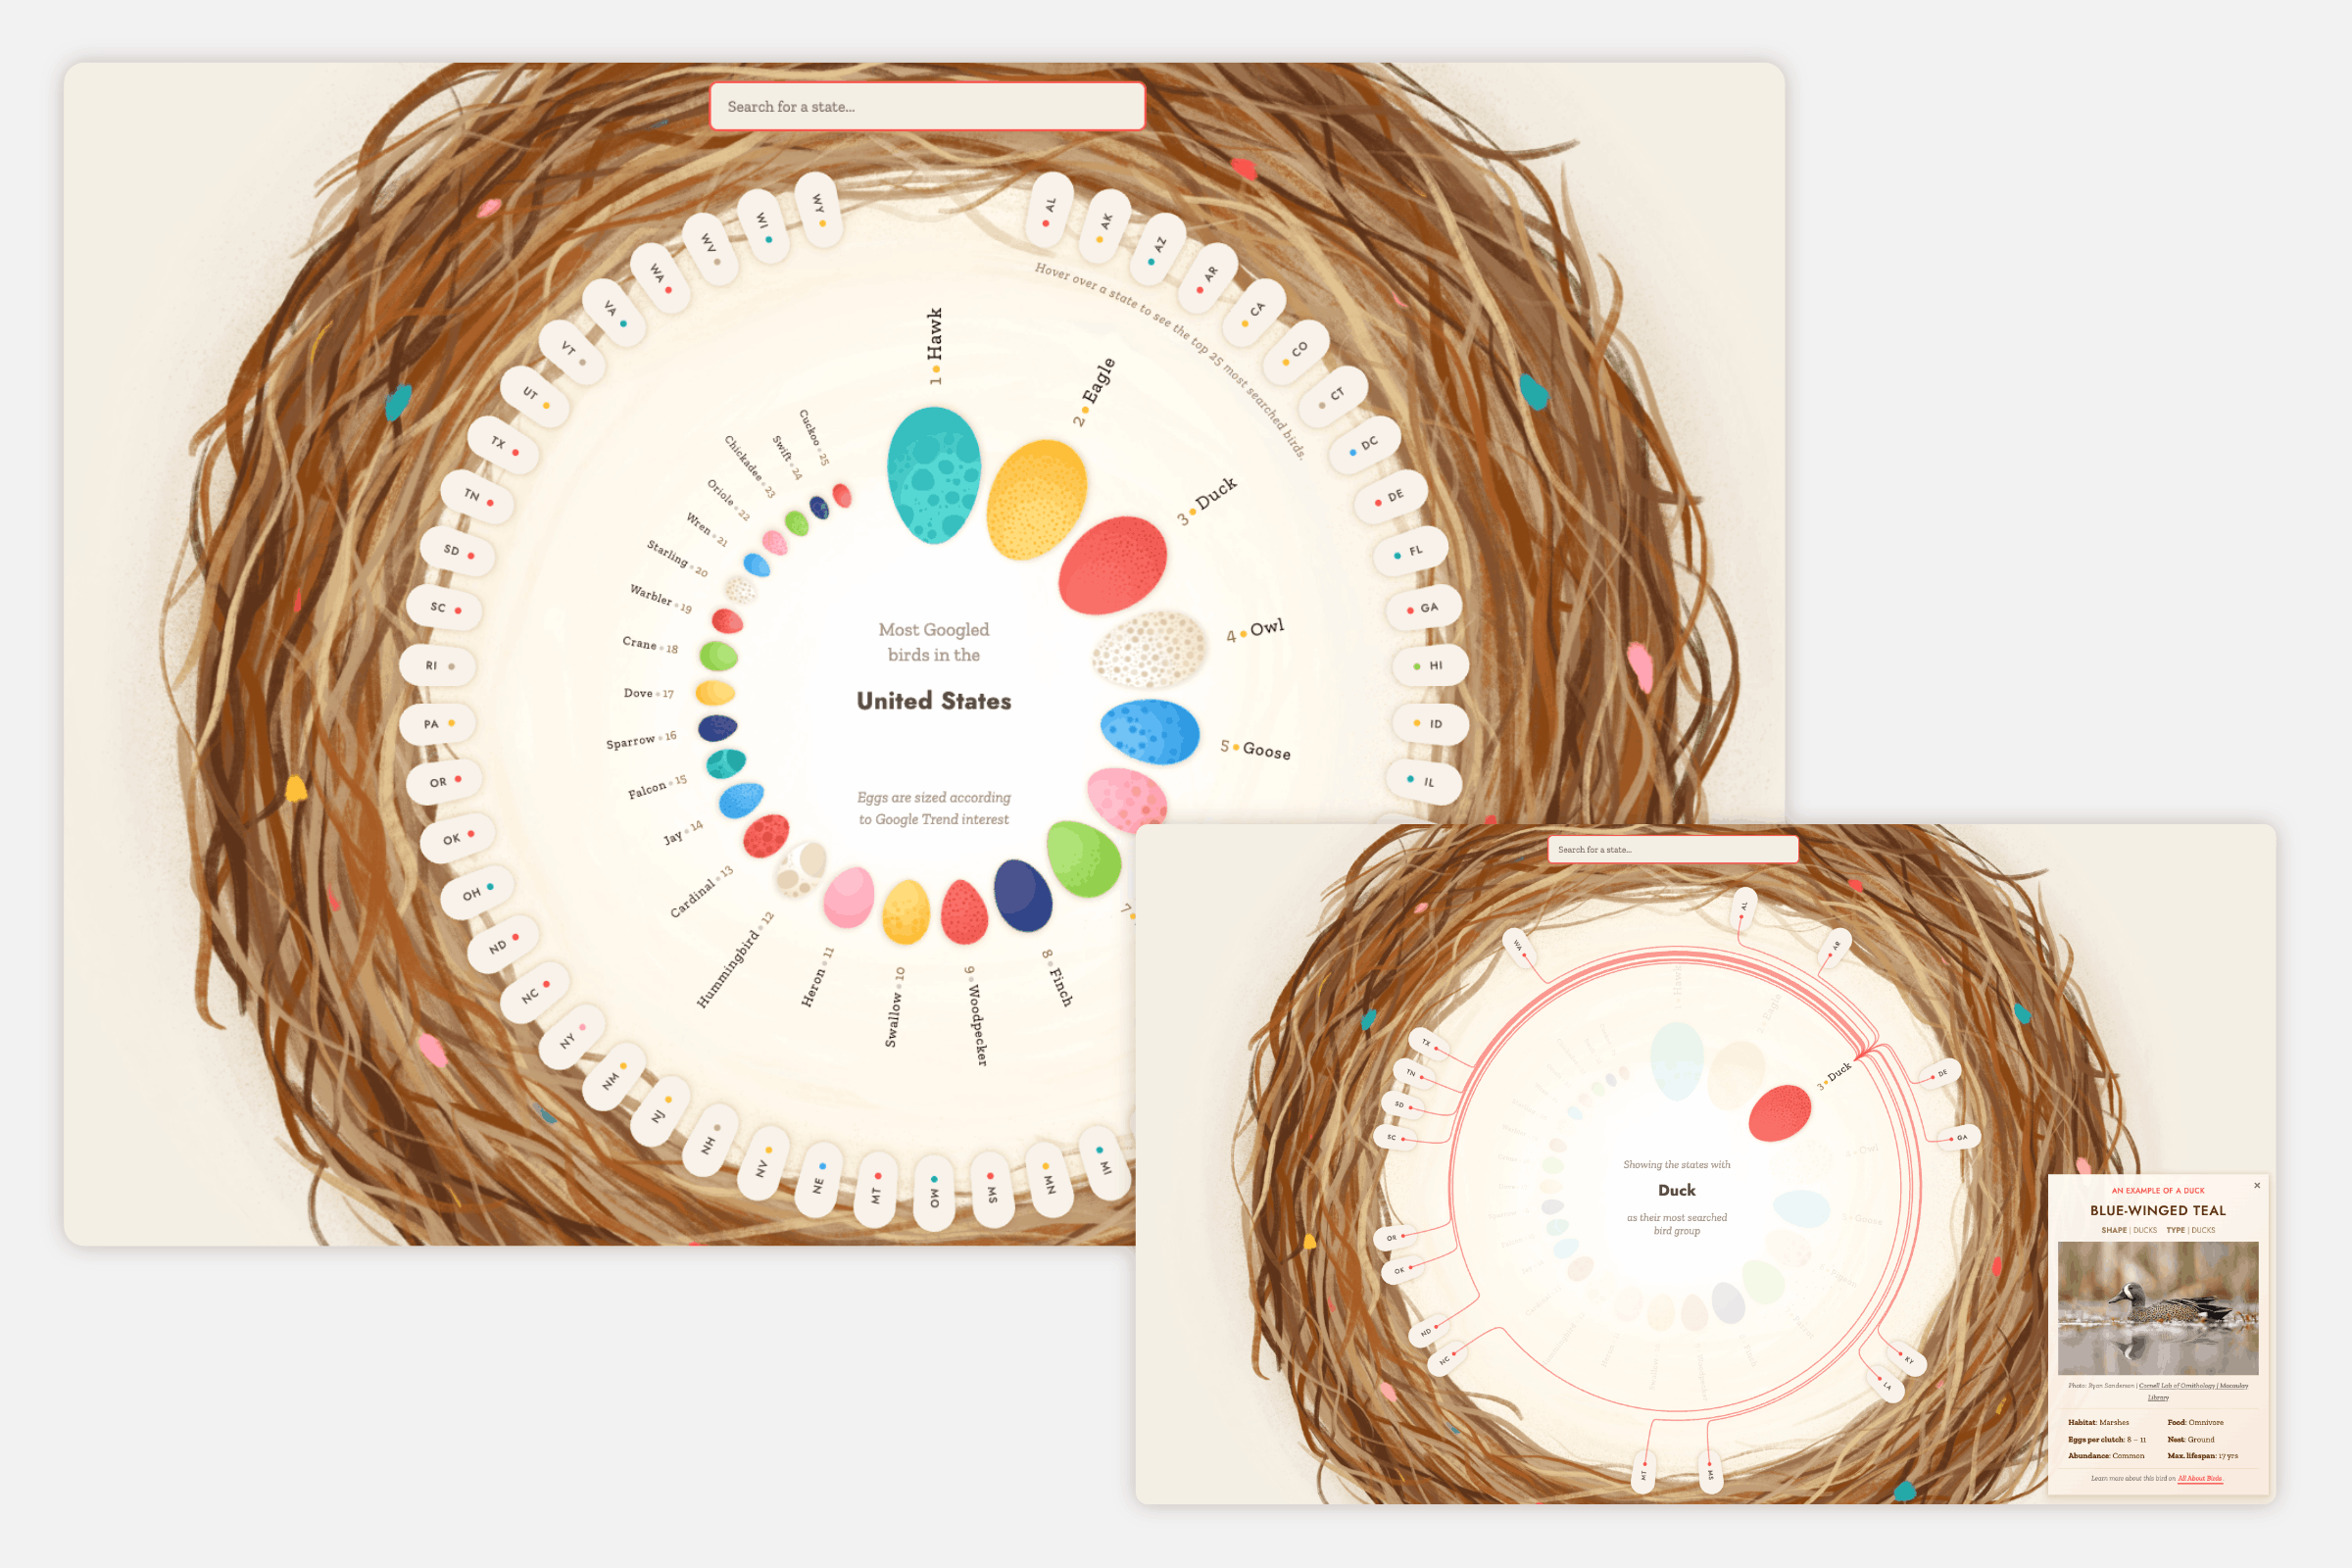
At the heart of the project is the integration of metaphor and data. Birds’ nests, eggs, and organic forms inspired the compositions. Custom illustrations are not decorative additions; they are embedded, an integral part of the data visualizations, guiding interpretation while preserving data accuracy.
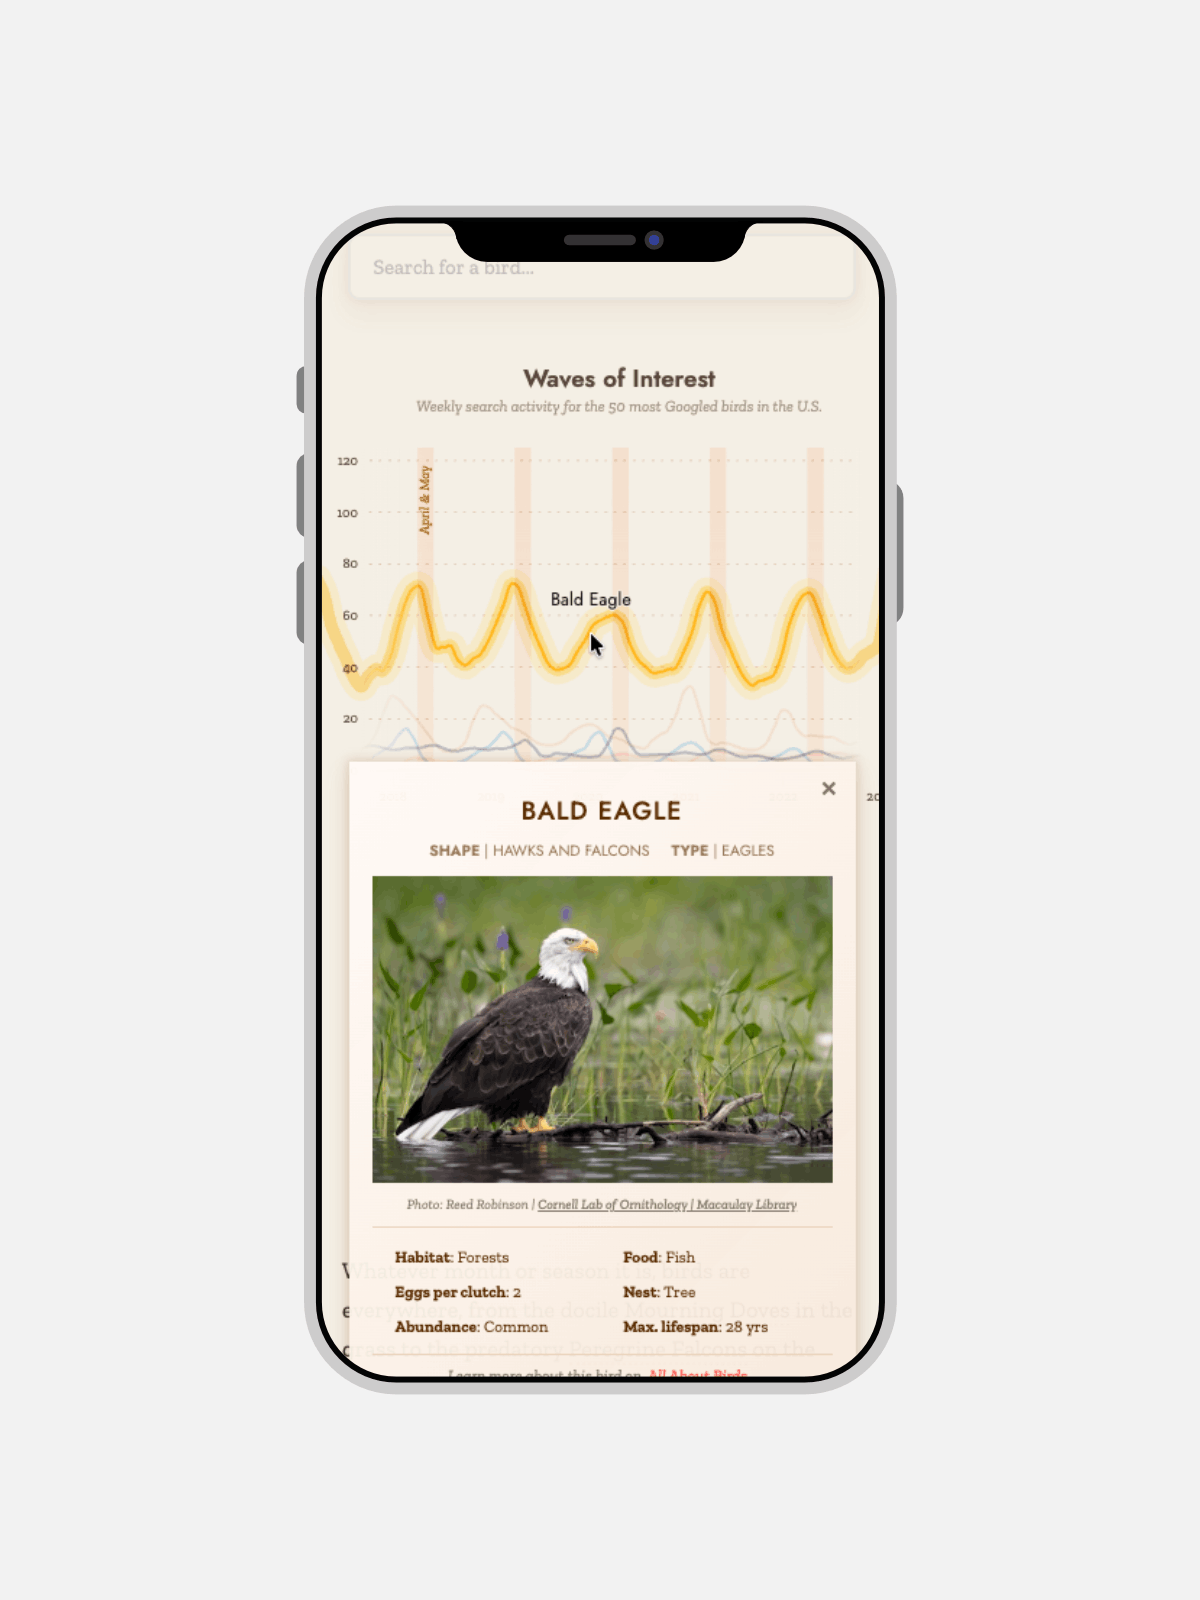
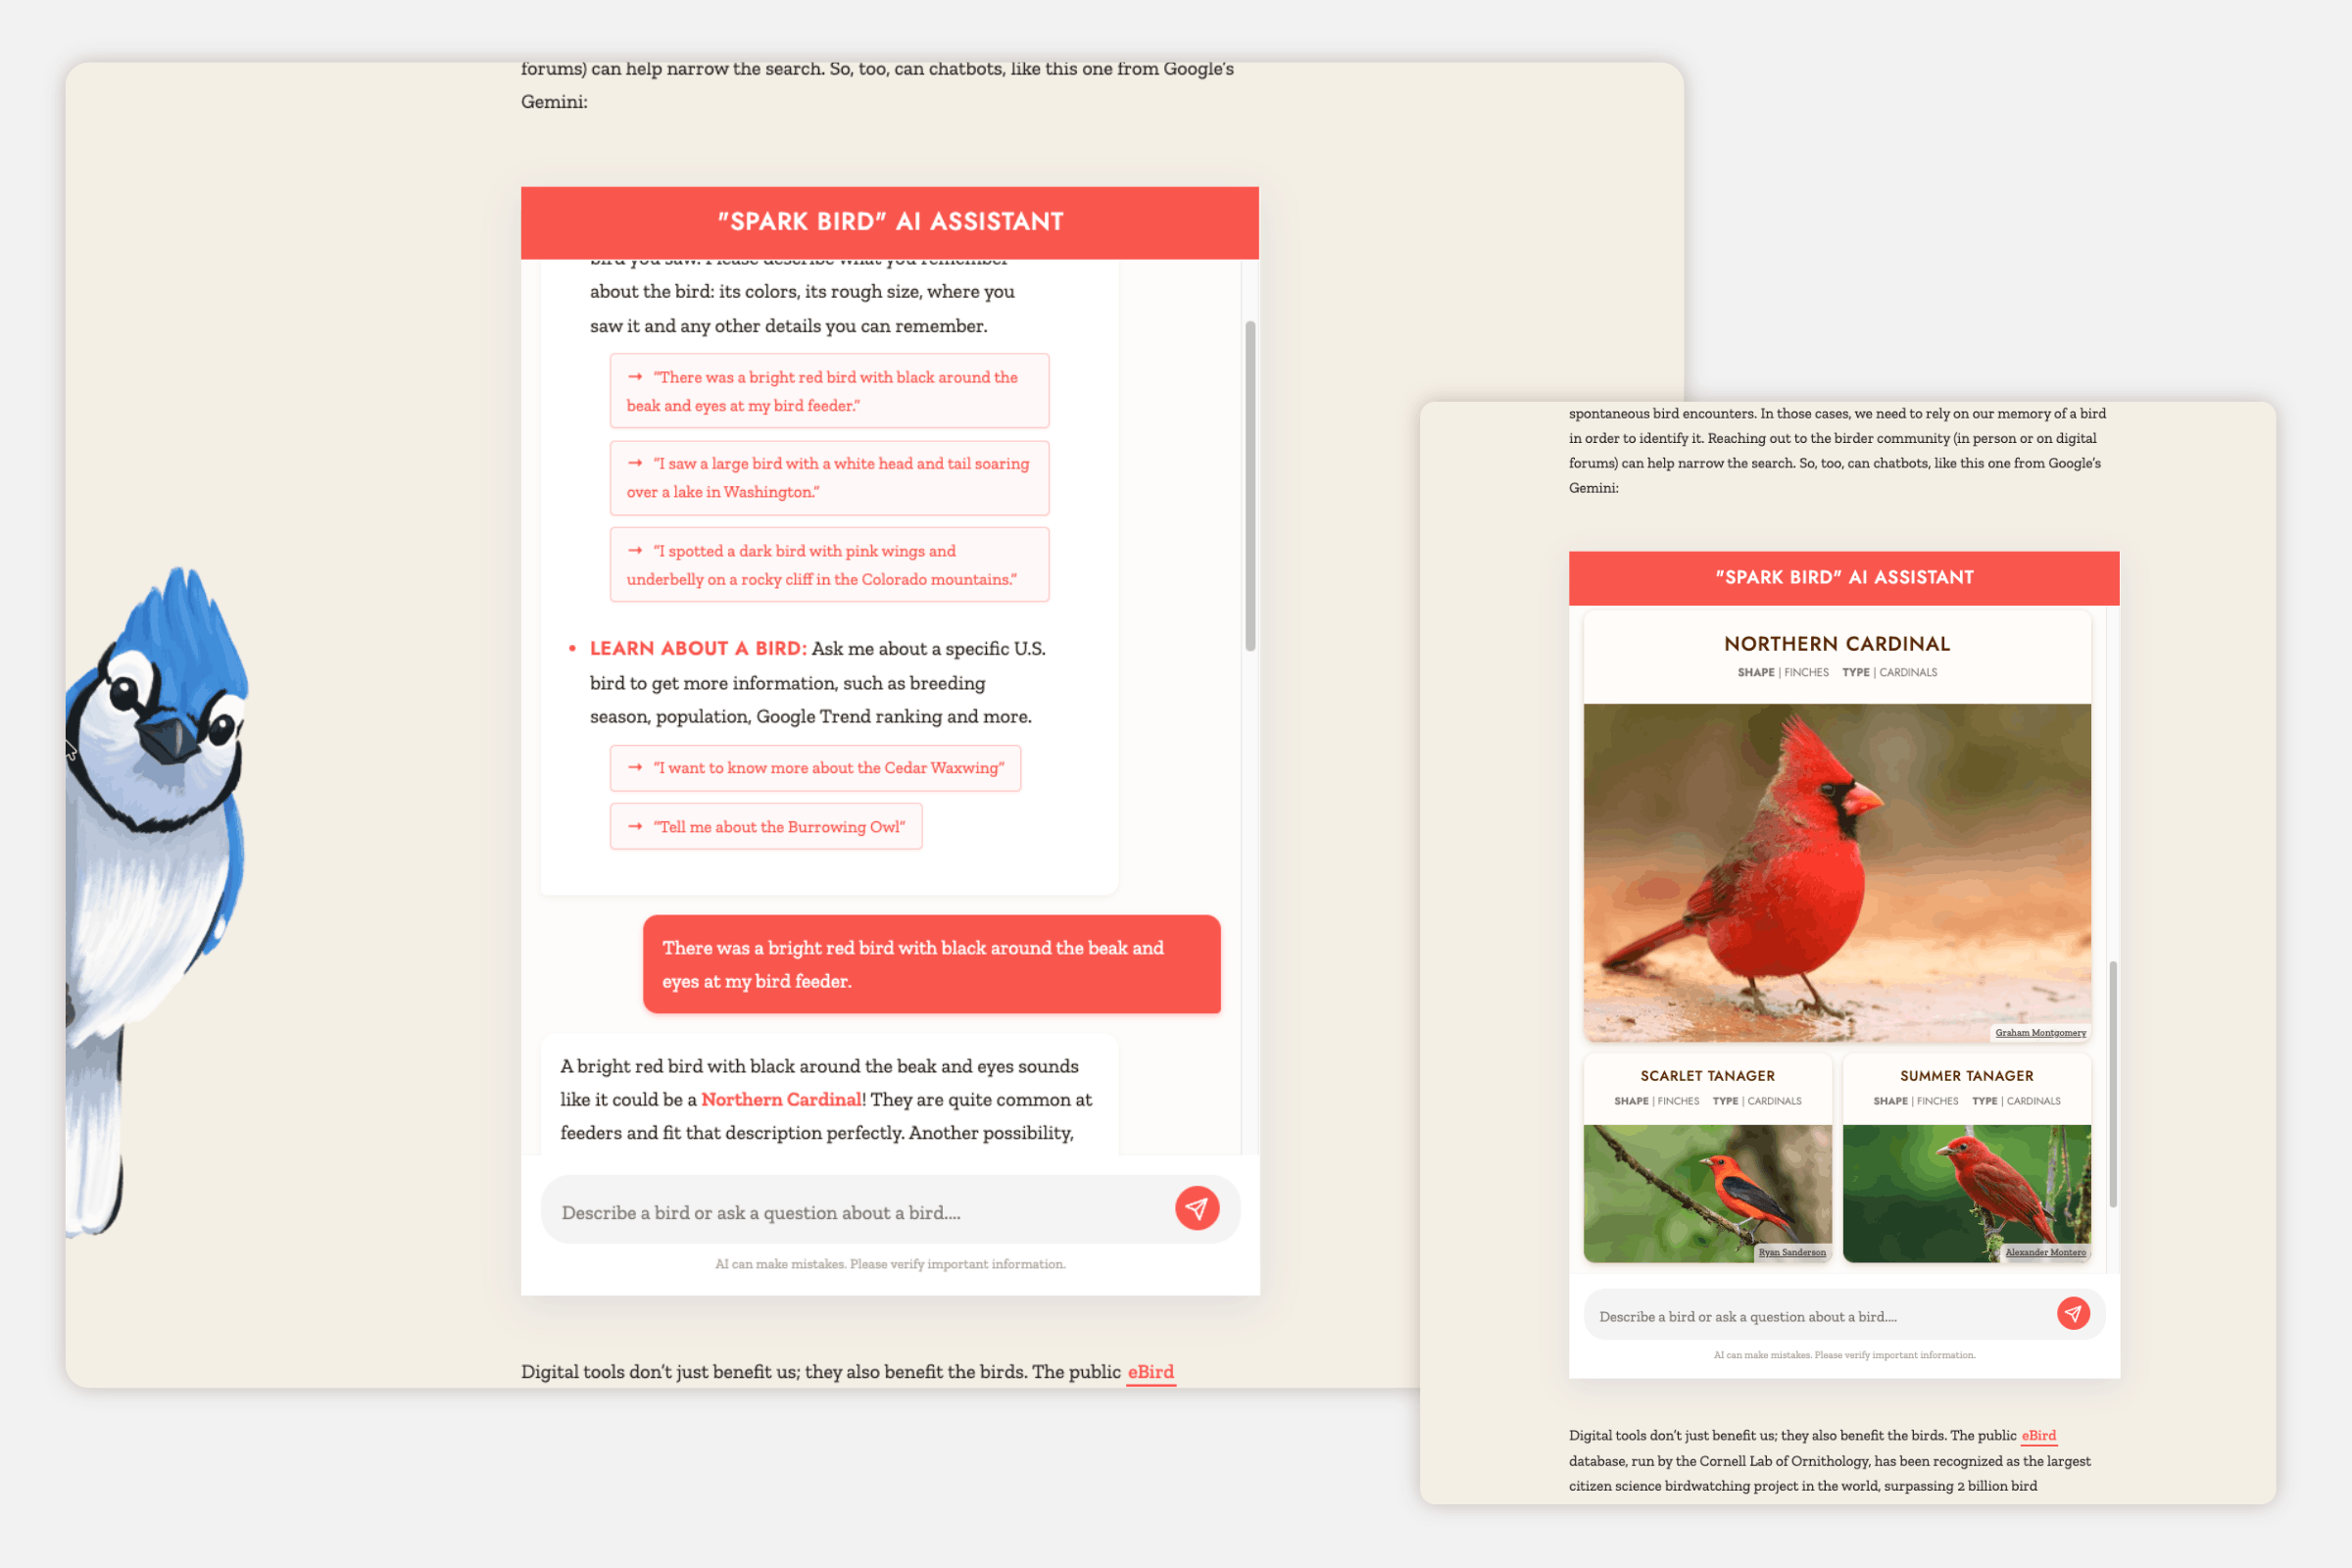
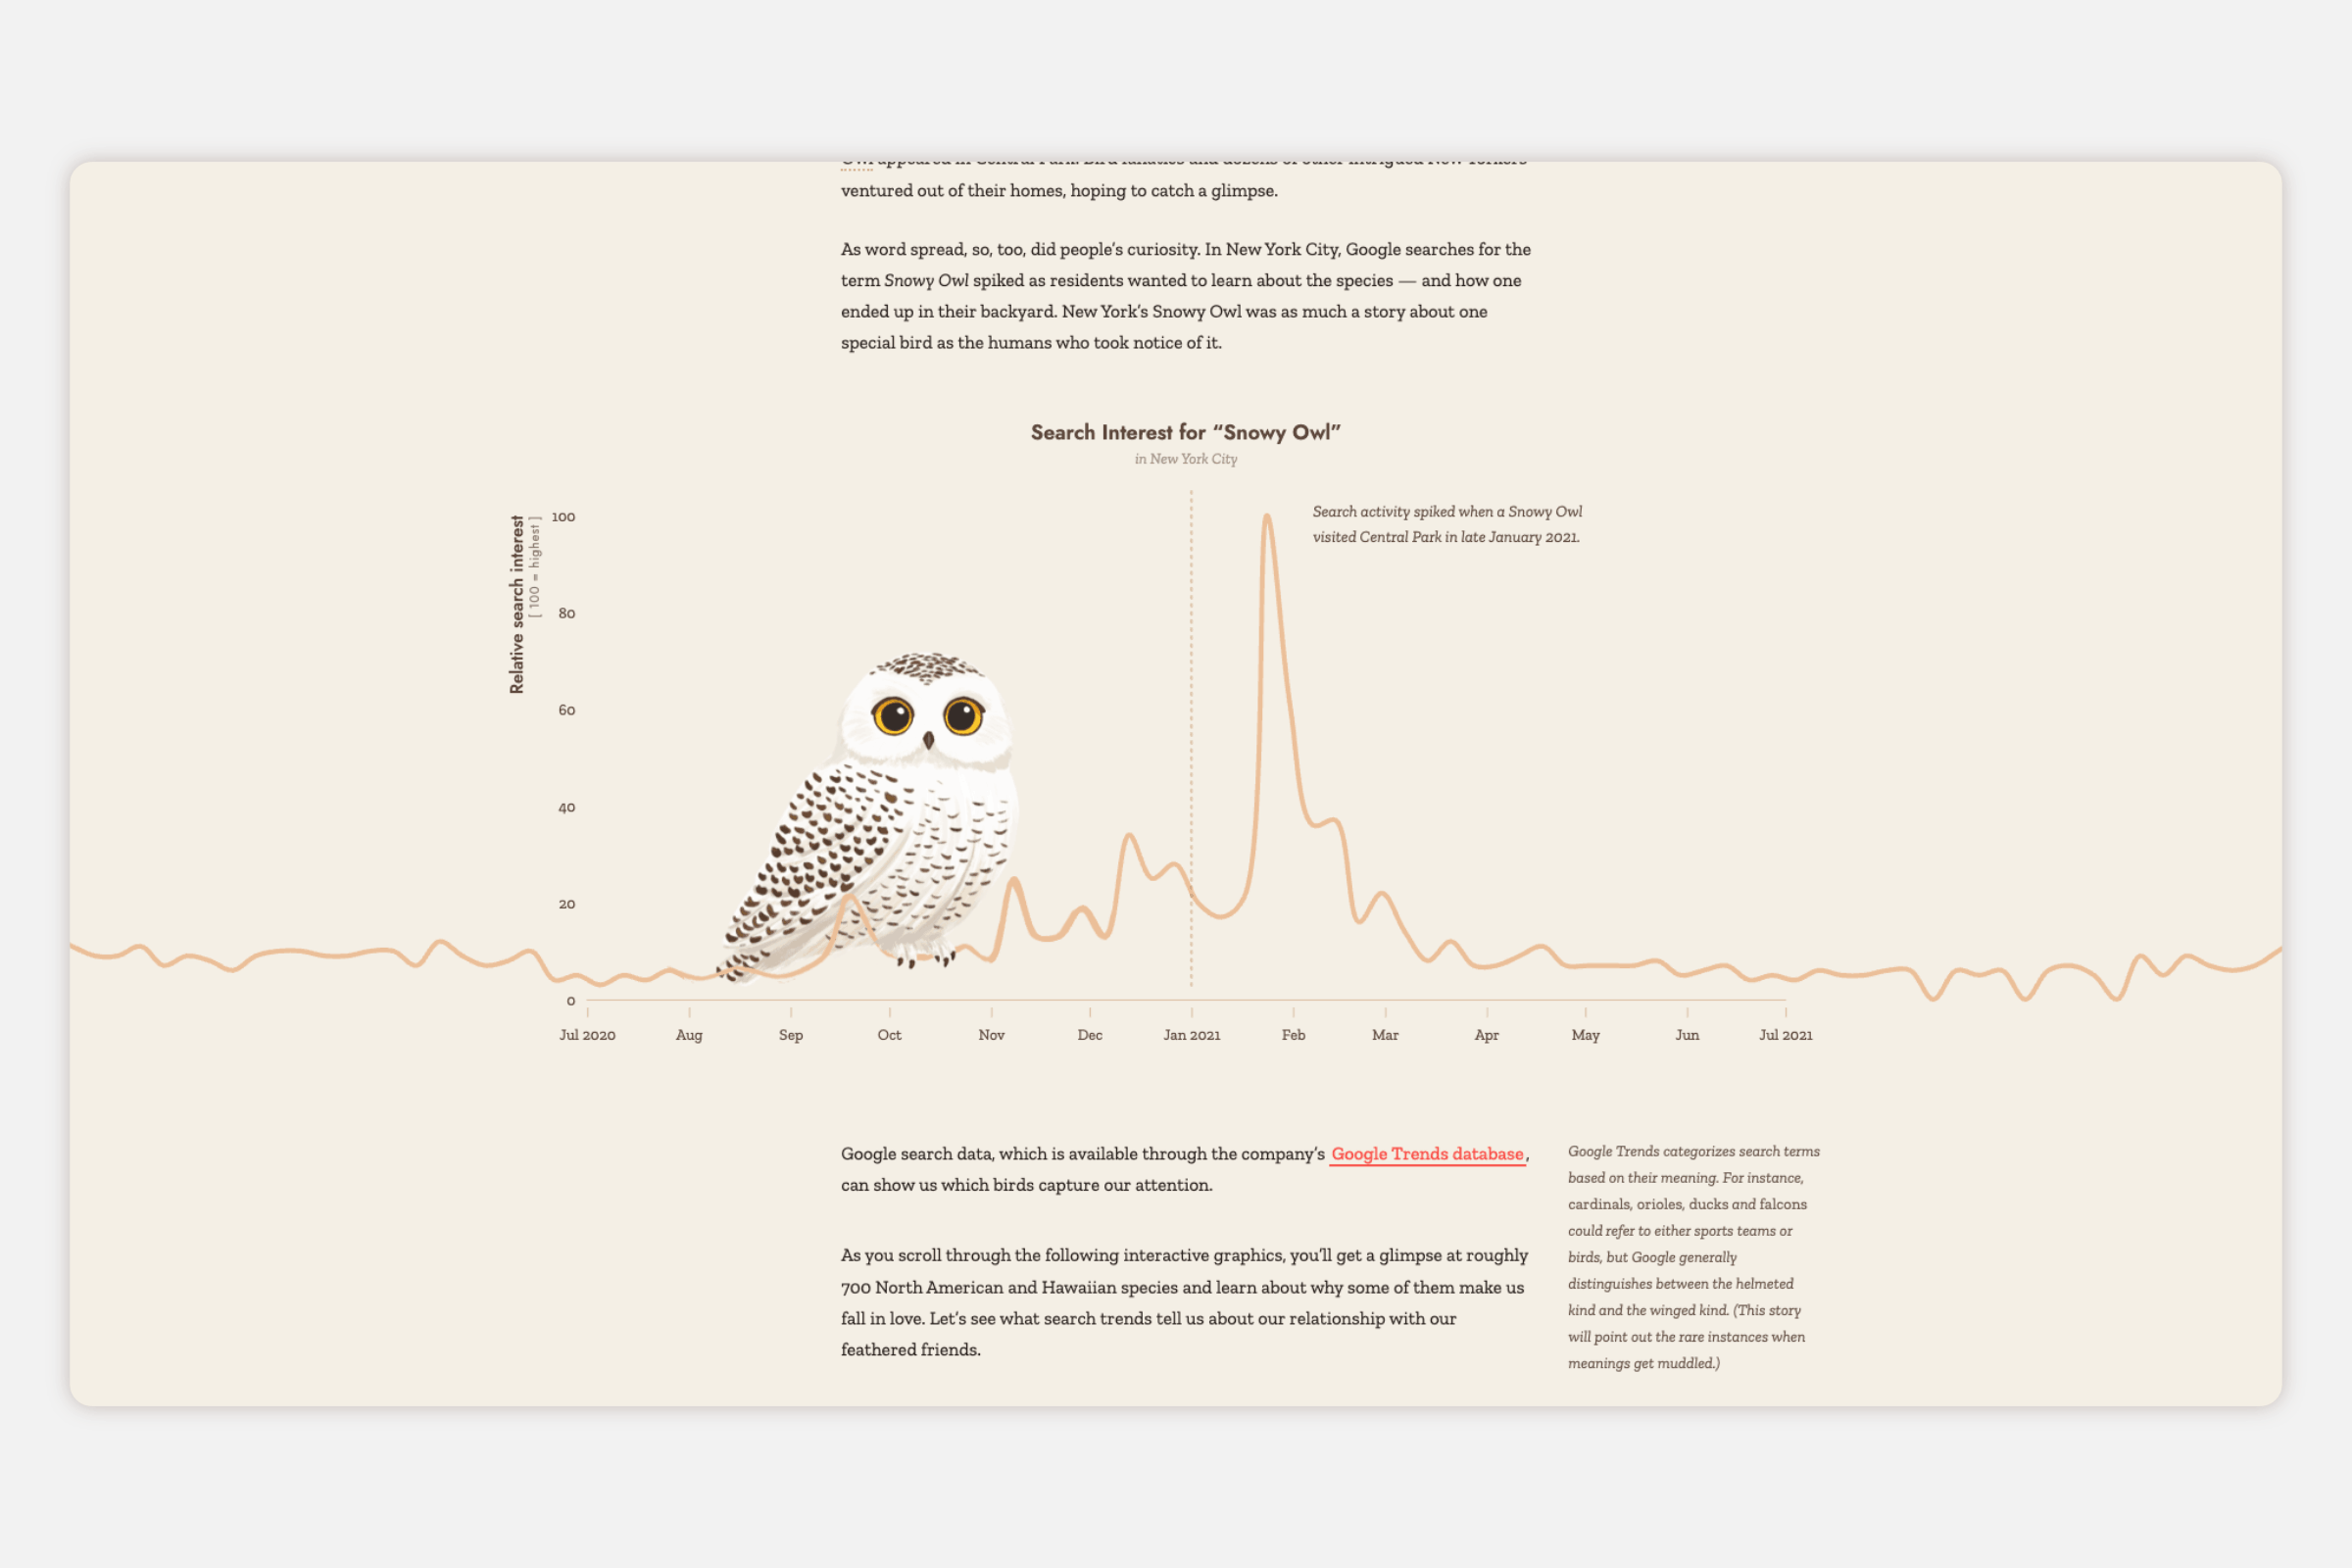
The color system, typographic hierarchy, and interaction details were carefully crafted to balance showcasing the large datasets with warmth and accessibility. The story, written by Emily Barone, was carefully crafted to be engaging and easy to follow, focusing on the connection between humans and birds. Subtle motion and whimsical transitions create the feeling of wandering through a designed environment, encouraging curiosity and discovery. The result is a cohesive visual world where story, data, illustration, and interface are inseparable.
By rethinking how data can be presented, this project demonstrates how rigorous analysis and expressive visual storytelling can coexist. Transforming abstract data into something memorable, emotionally resonant, and aesthetically refined that captured the hearts of its readers.