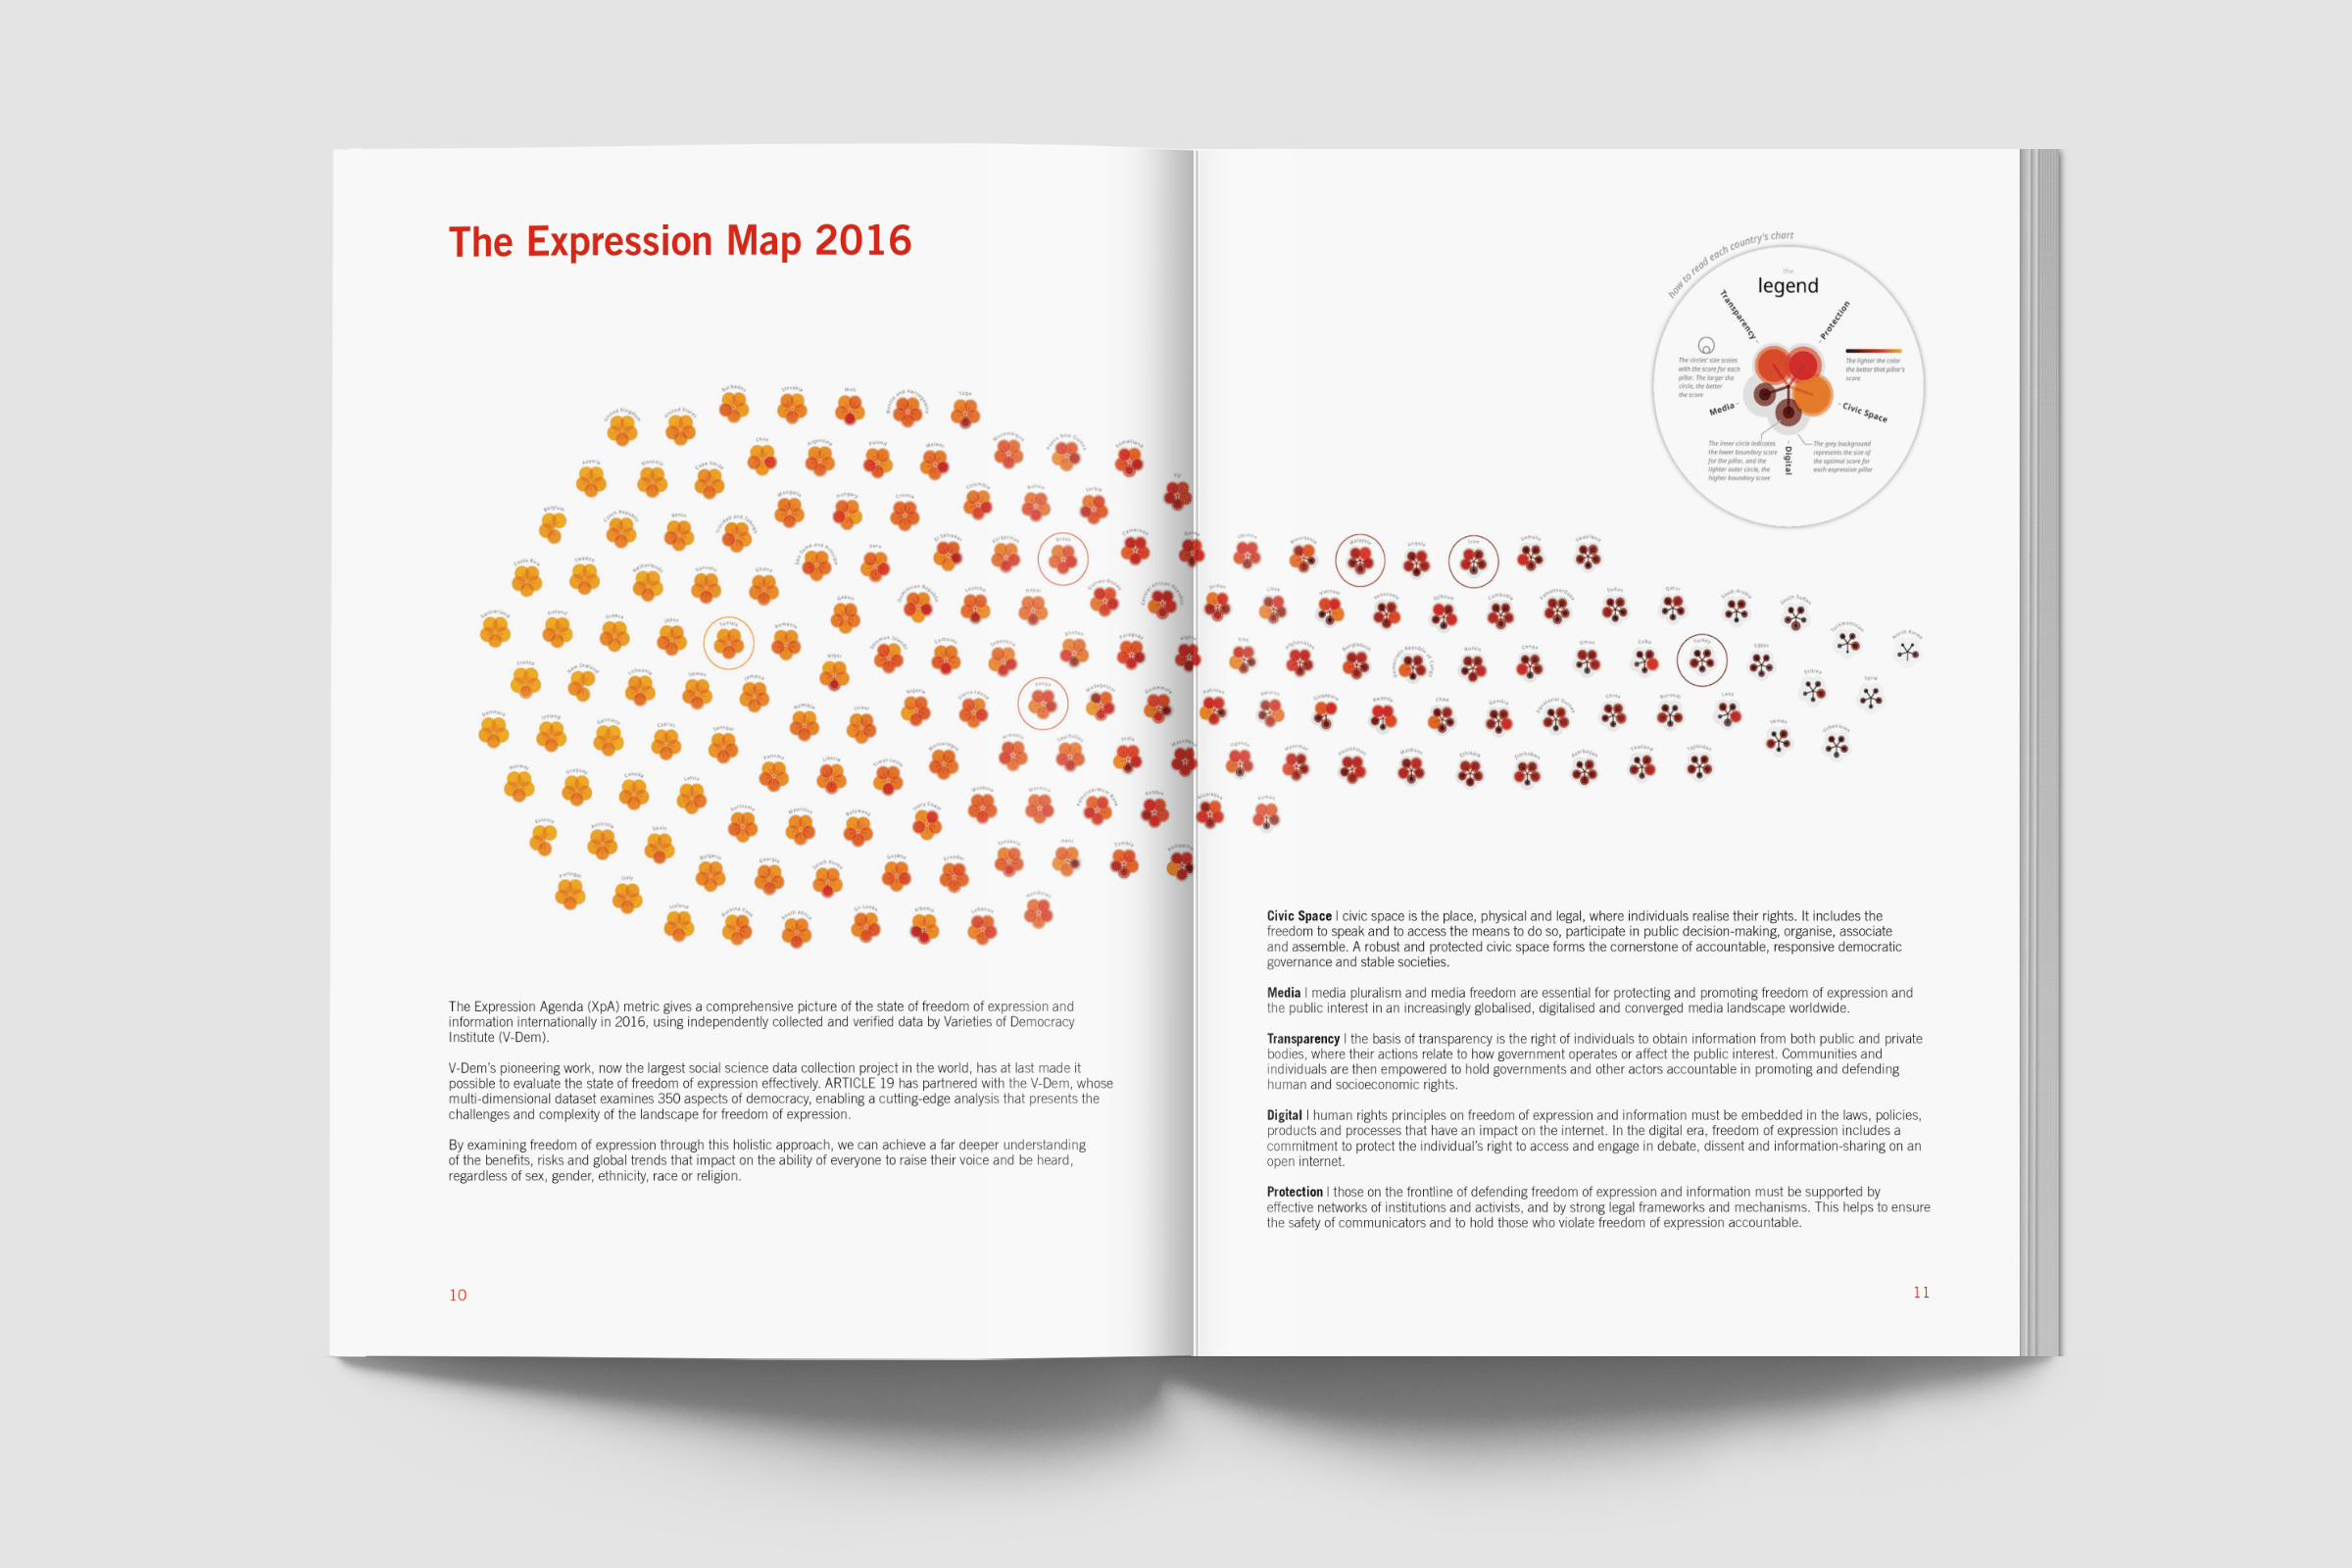
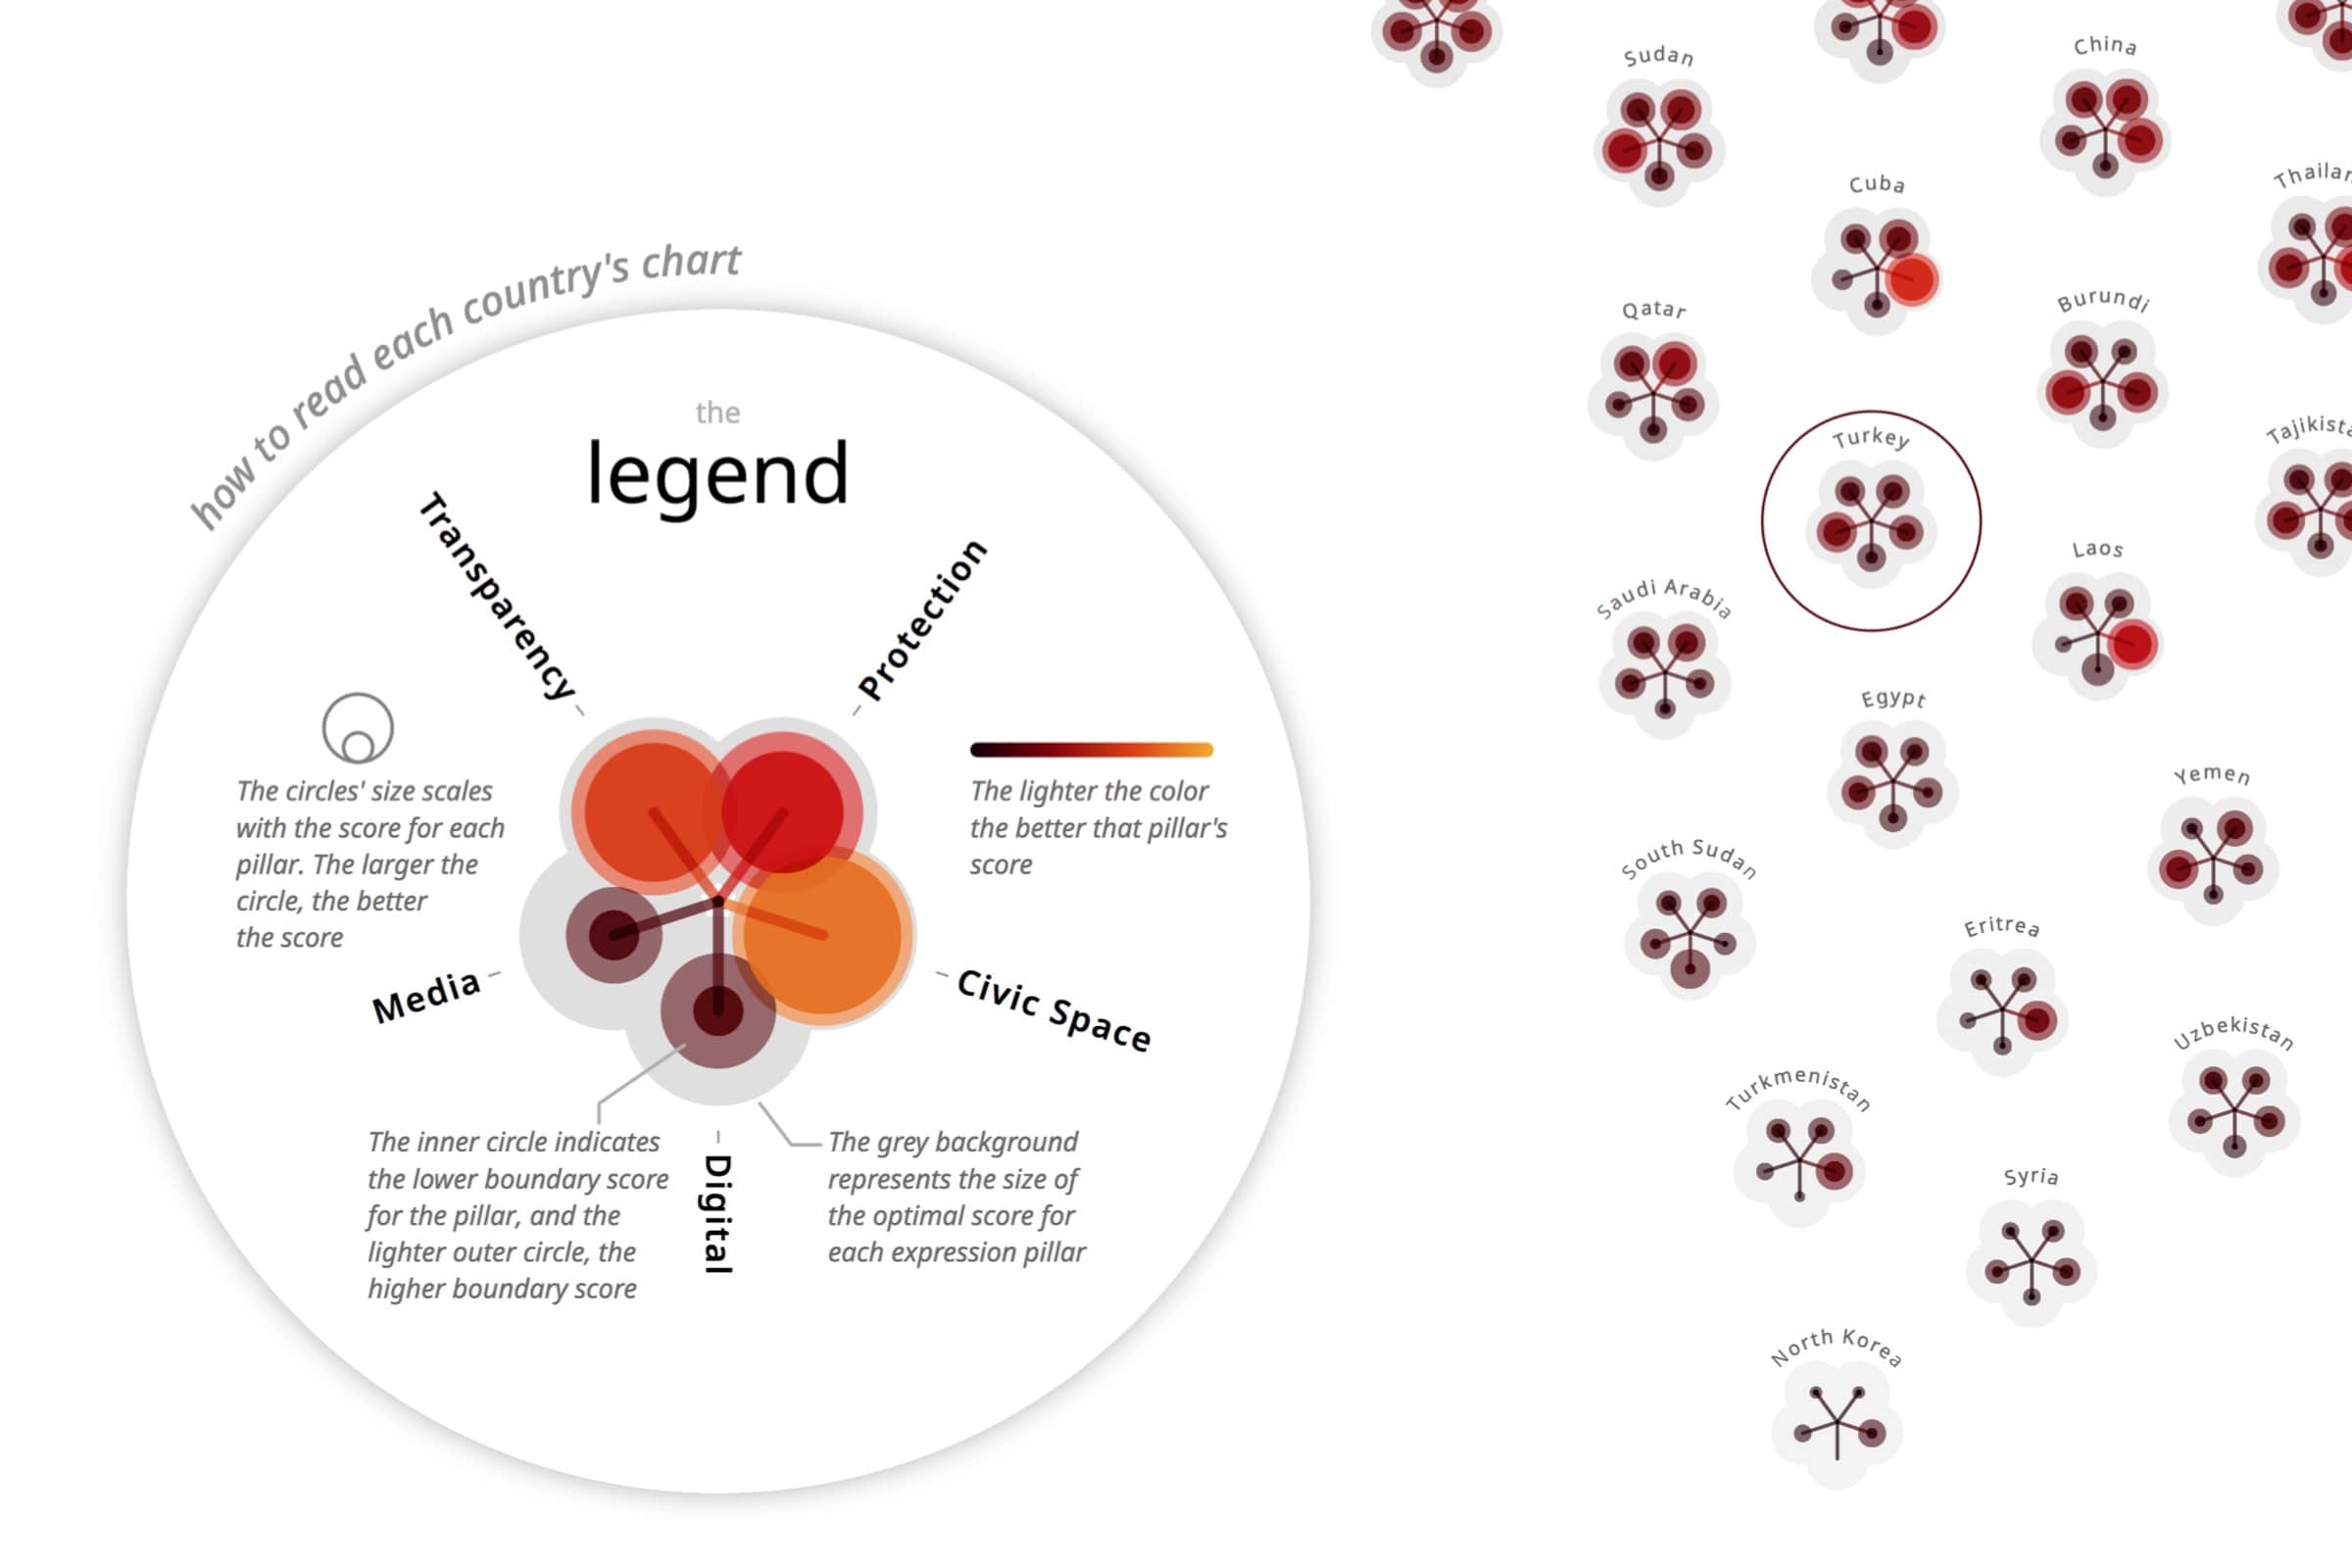
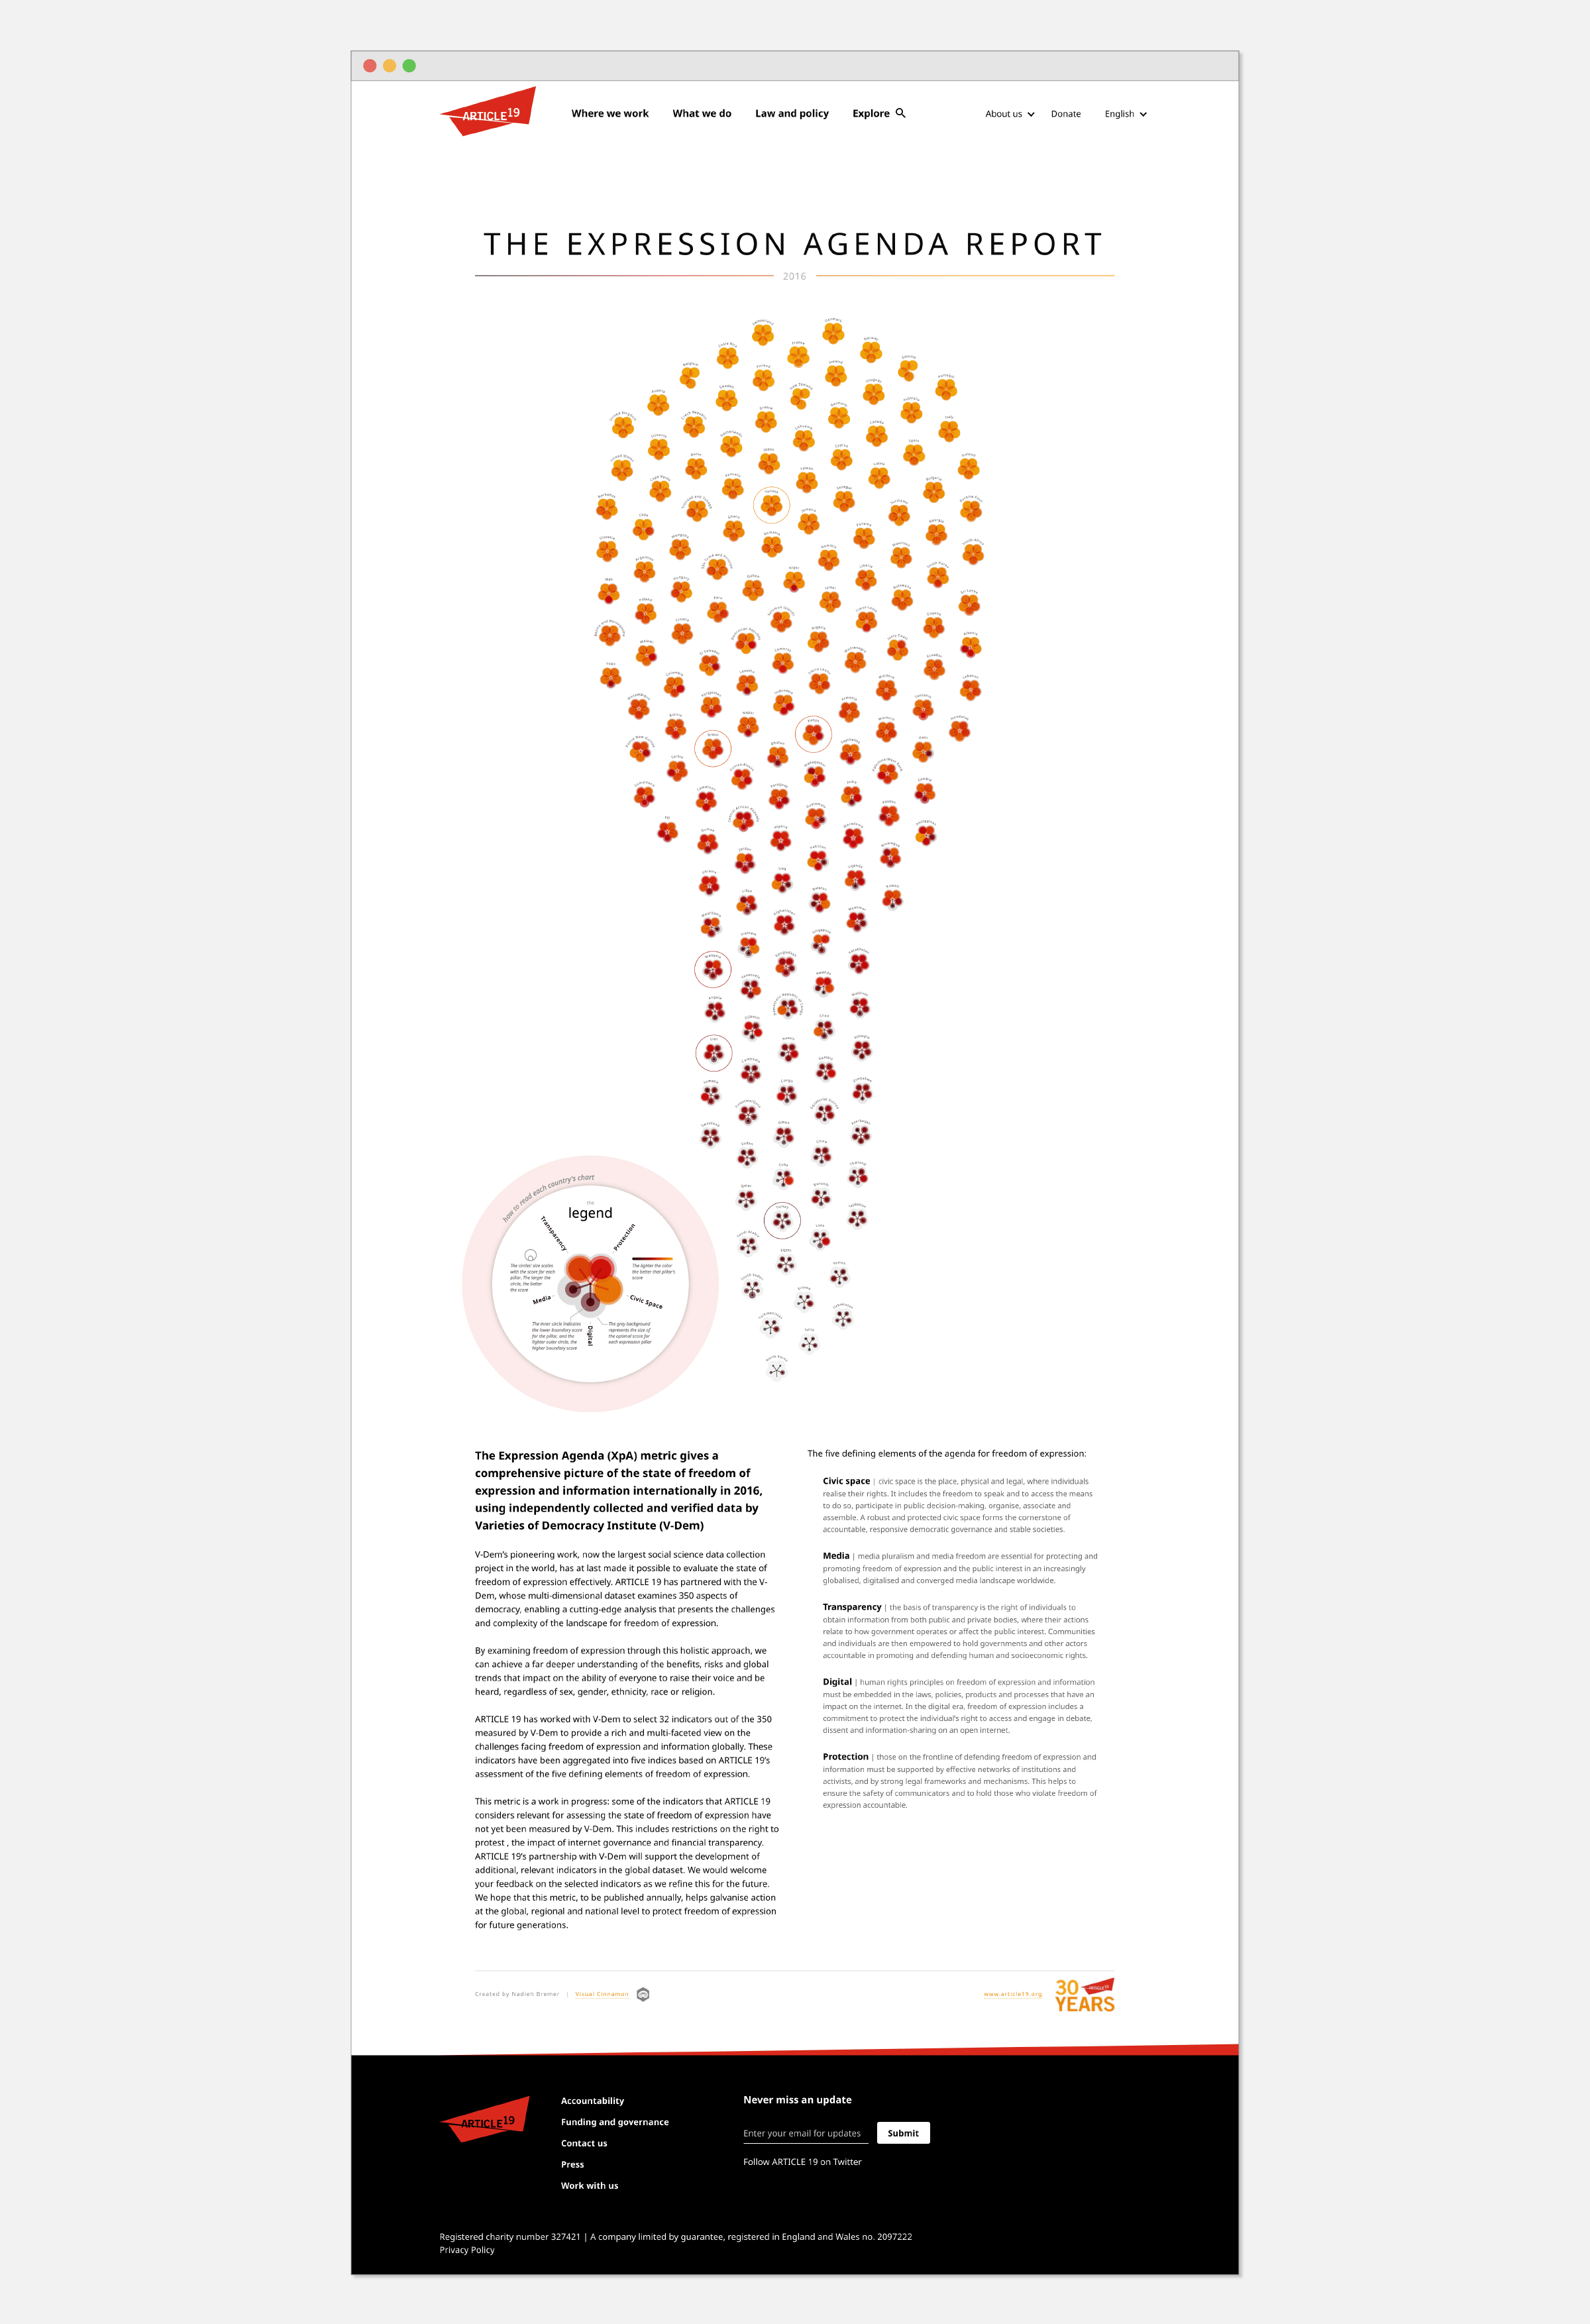
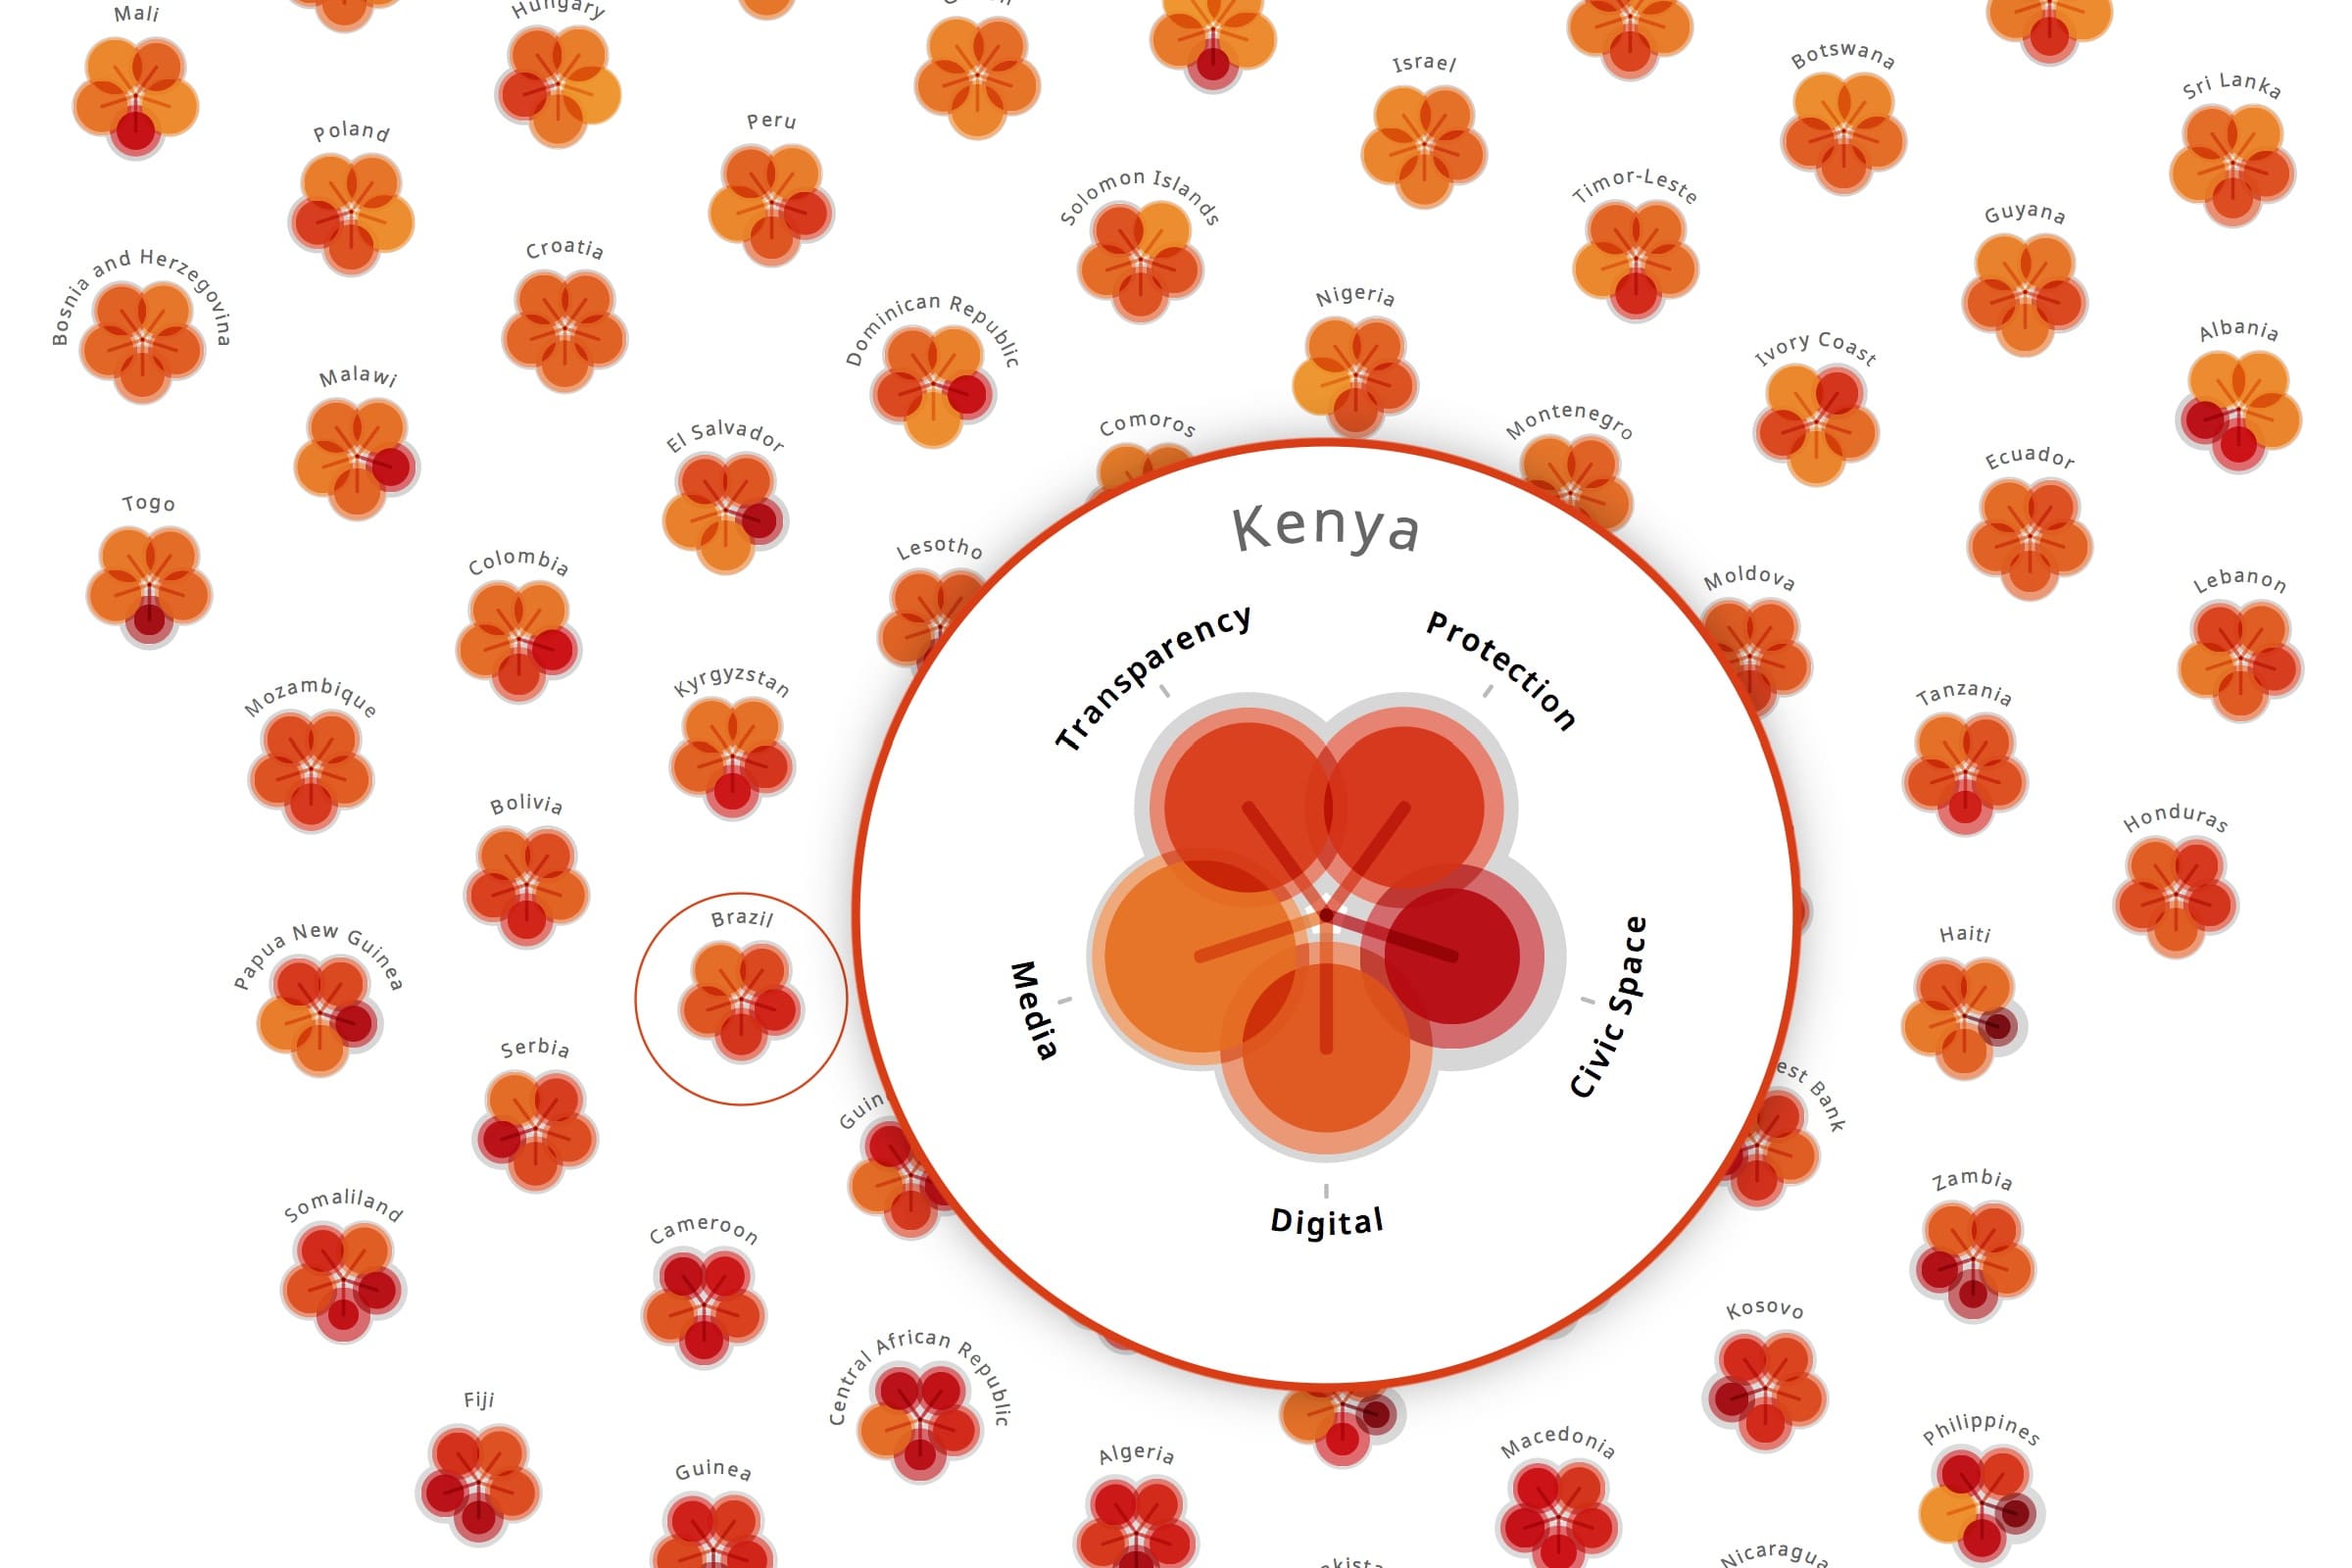
Article 19’s new Expression Agenda (XpA) metric gives a comprehensive picture of the state of freedom of expression and information internationally in 2016. The metric examines 350 aspects of democracy in 172 countries to provide an analysis that captures the challenges and complexity of the freedom expression across the world. By examining freedom of expression through this holistic approach, a far deeper understanding can be achieved of the benefits, risks and global trends that impact on the ability of everyone to raise their voice and be heard, regardless of sex, gender, ethnicity, race or religion.
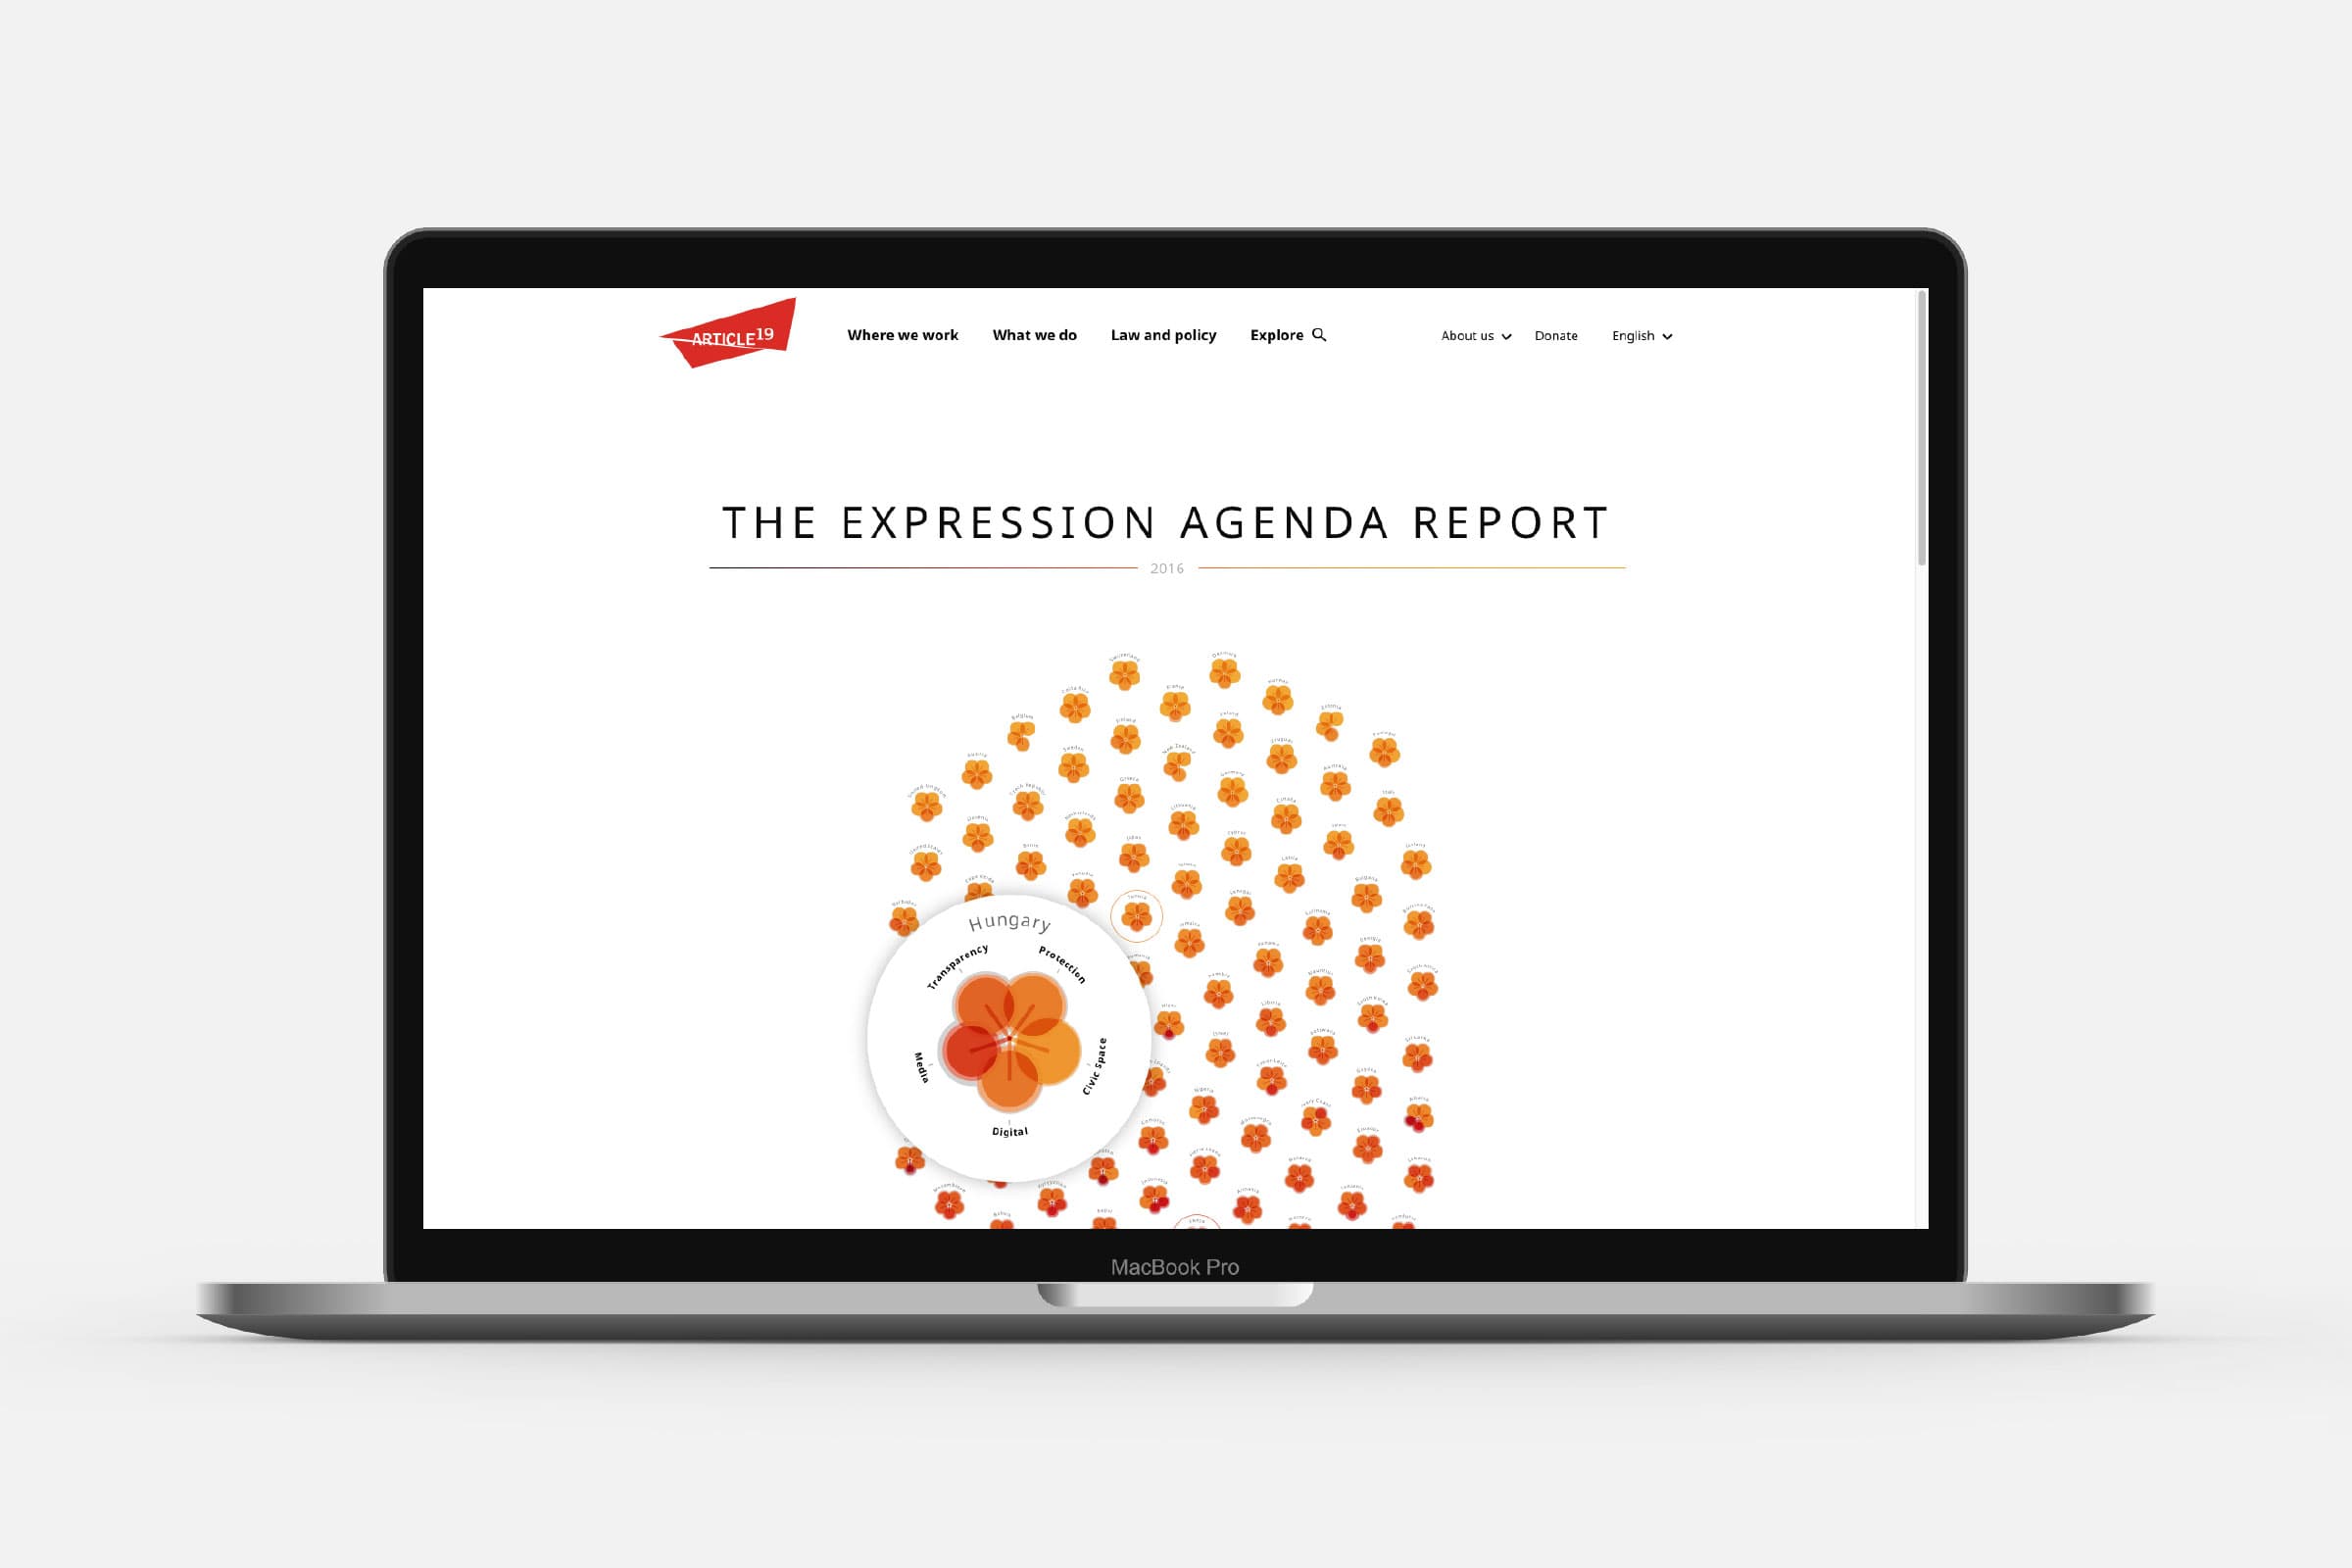
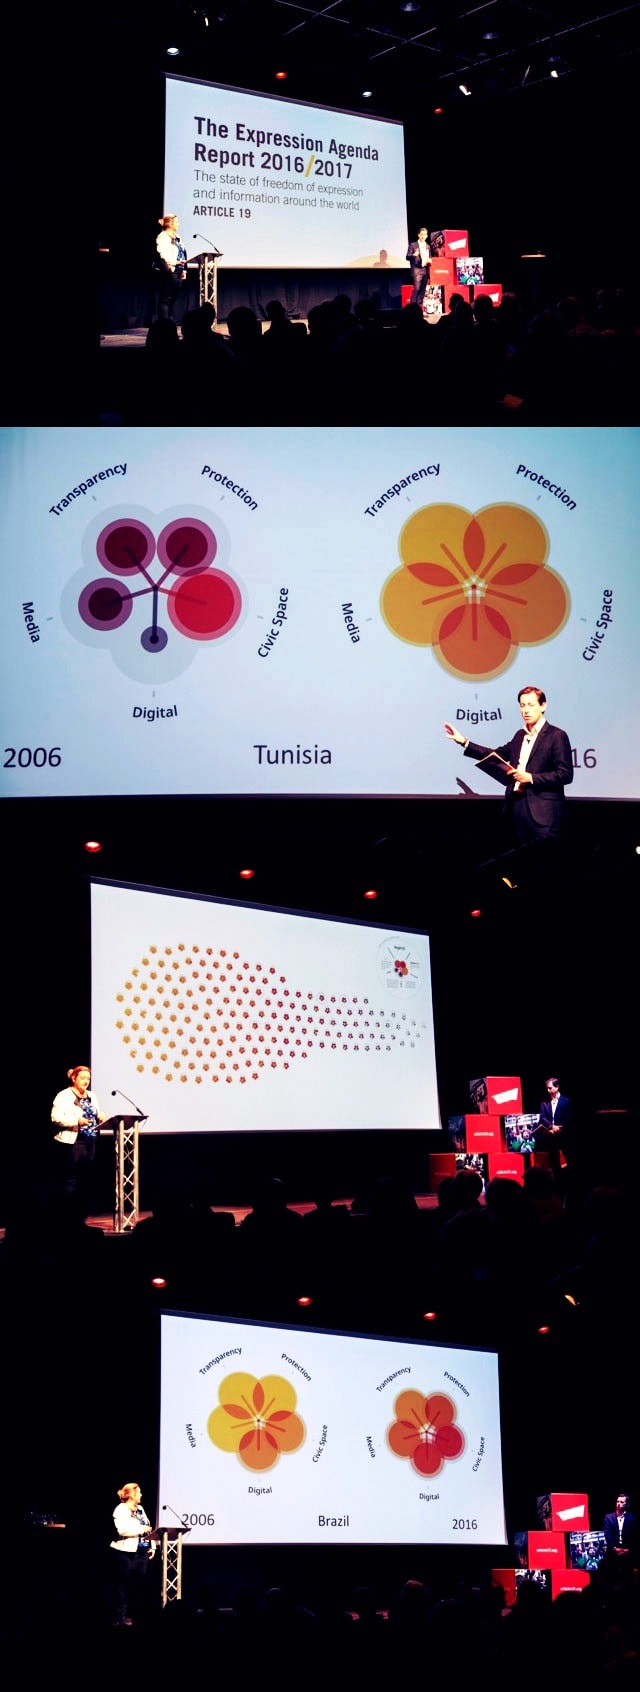
On November 30th Article19, planned the release of their new yearly Freedom of Expression metric. To accompany the report they wanted a data visualization that would not be a standard collection of charts. Instead, they wanted a visualization that could be holistically viewed, understood and then more closely inspected per country. But also something that would draw in their audience and look beautiful.
I created several designs for them. After discussing these, we found the small multiple approach, where each country would be its own mini-chart would to fit best with the different uses for the eventual visualization. Since there are many countries, to be able to see a large portion on the screen they had to be made quite small. I therefore implemented a technique that makes a country’s chart bigger, and thereby readable, when a mouse hovers over it.
The press release was a big success, with the report and the visualization being very well received by the governments and journalists present. Article 19 was asked to present the visual and findings at several other governments straight after the presentation.